


 |
市場調查報告書
商品編碼
1145451
網路經營者的電力使用數量:2021年Network Operator Power Use Grew 10% in 2021: Webscalers Grew Fastest (+25%) but Telcos Still 66% of Network Operator Total, Lowering Costs and Carbon Footprint for Industry Depend on the Mobile RAN |
||||||
本報告提供全球網路經營者的電力使用數量的相關調查,市場概要,以及各經營者類型的電力使用量,成本與碳足跡的影響等資訊。
視覺
圖2:
各經營者類型的電力強度(每100萬美元銷售額的消耗功率數量MWh)
出處:MTN Consulting
目錄
- 概要
- 能源的使用,帶給成本和碳足跡影響
- 網路經營者的電力使用量2021年增加10%
- 業者對氣候的影響,比電力使用複雜
- 含意
- 附錄
This brief examines power consumption in the network operator industry, spanning telcos, webscalers, and carrier-neutral operators (CNNOs). This is based on a bottoms-up review of sustainability reports from 57 operators: 16 webscalers, 21 telcos and 20 CNNOs. The webscalers reviewed account for about 94% of that sector's total 2021 revenues. For telco and carrier-neutral, the surveyed companies account for a bit over 60% of revenues in the respective sectors.
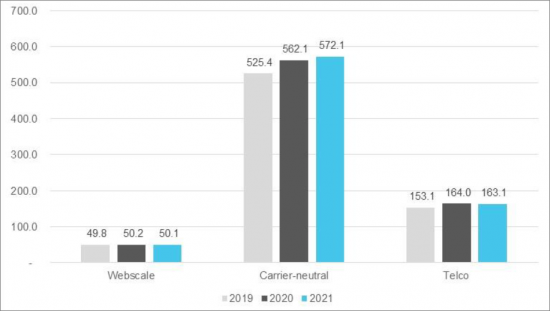
Based on this large sample, we estimate that in 2021 network operators consumed approximately 467.6 Terawatt-hours (TWh) of electricity, including purchased and self-generated. Power consumption by network operators in 2021 grew by 9.8%, about the same as the 9.3% growth recorded in 2020. By operator type, webscale power consumption is booming, up 19% and 25% in 2020 and 2021, respectively, while telco power consumption grew by just 6.0% and 4.7% in the same two years. CNNOs were in the middle, recording 16% growth in power consumption in 2020, and 15% in 2021. The CNNO segment's data center specialists stand out as the biggest electricity users in the operator industry, as measured by power intensity (MWh of power per unit of revenue). In 2021, for instance, Digital Realty consumed 2,094 MWh of power per US$1M of revenue, versus 97.6 for American Tower, 82.9 for AT&T and 71.0 for Alphabet, a large tower CNNO, telco and webscaler, respectively.
Data centers rightfully get a lot of attention for their power requirements. However, despite the last few years of heavy data center investments in both the webscale and carrier-neutral market, these two segments accounted for just 22.9% and 11.1% of total network operator electricity consumption in 2021. Telcos are dominant, accounting for 66% of the three-segment total in 2021 (2020: 69.2%). Telcos' impact on the environment is even higher than this 66% would imply. For many telcos, their electricity consumption is almost entirely based on fossil fuels. KDDI's electricity consumption from renewable sources, for instance, was only 10.4% of total in 2021. Moreover, telcos consume significant amounts of non-electric energy (diesel, propane, heating oil, etc.) to power their facilities, especially mobile base stations. Africa's MTN Group, for instance, relied on diesel for 46% of its total energy consumption in 2021. For telcos to really begin reducing their carbon footprint, big improvements in both energy efficiency and fuel mix will be required in their mobile access networks.
VISUALS
Figure 2: Power intensity by
operator type (MWh consumed per US$1M in revenue)
Source: MTN Consulting.
Companies and organizations mentioned in this report include:
|
|
Table of Contents
- Summary
- Energy use impacts costs and carbon footprint
- Network operator power use up 10% in 2021
- Operators' climate impact more complex than power use
- Implications
- Appendix
List of Figures
- Figure 1: Electricity consumption by operator type, 2019-21 (GWh)
- Figure 2: Power intensity by operator type (MWh consumed per US$1M in revenue)
- Figure 3: Power intensity for webscalers in sample (MWh consumed per US$1M in revenue)
- Figure 4: Power intensity for carrier-neutral operators in sample (MWh consumed per US$1M in revenue)
- Figure 5: Power intensity for telcos in sample (MWh consumed per US$1M in revenue)
- Figure 6: Telkom Indonesia's electricity consumption by facility type
- Figure 7: Components of Scope 3 emissions in 2021, Digital Realty
 虛擬網路營運商市場- 按服務(行動虛擬網路營運商(MVNO)、固定虛擬網路營運商(FVNO))、按產品(預付費、後付費)、按最終用戶(消費者、企業)、2024 - 2032 年預測
 網路營運商預測(~2028 年):資本支出將在 2023 年下降後恢復,並在 2028 年增長至約 6500 億美元,生成式人工智慧推動資本支出和員工人數減少
 營運商中立者希望搭乘 GenAI 浪潮 - 2023 年 1 月更新:CNNO 收入預計在 2023 年達到 100B 美元,資本密集度 >35%,因為行業抓住生成式 AI 和 5G 緻密化的機會
 運營商中立部門的2022年的OPEX電費及燃料費對劇增:對許多運營商中立部門經營者來說電費及燃料費是最大的運營成本,佔OPEX (ex-D&A) 的最大80%
 運營商中立網絡運營商(CNNO):市場分析(2022 Q4)CNNO將在2022投資超過450億美元,通過資本支出和併購進行擴張,以支持運營商領域快速雲端增長降低成本
 職業中性增長在行業整合中放緩2022:年市場收入接近1000億美元,對運營商行業的健康至關重要,但易受經濟壓力影響,私募股權公司崛起
 22年前半期運營商中立市場的資料中心投資飆升