


 |
市場調查報告書
商品編碼
1139418
廚房檯面的美國市場Kitchen Countertops |
||||||
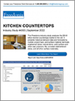
美國的廚房檯面的市場規模,預計至2026年以5.0%的年複合成長率成長,達到6億6,200萬平方英呎、373億美元。希望更換高價材料的消費者增加,有偏好檯面空間寬廣的廚房的傾向,商業大樓建設增加,促進廚房檯面市場成長。
本報告提供美國的廚房檯面市場的相關調查,市場概要,主要供應商與產業結構等全面性資訊。
目錄
第1章 摘要整理
第2章 本報告
- 本報告詳細內容
- 範圍與產品的說明
- COVID-19大流行的影響
第3章 概要
- 過去的市場趨勢
- 需求:各市場
- 需求預測
- 住宅
- 商業
- 車輛
- 需求:各計劃類型
- 需求預測
- 廚房的新安裝
- 廚房的改裝
- 價格趨勢
- 安裝費用
- 永續趨勢
- 綠色大樓的措施
- 回收與再利用的內容物
- 對健康的擔憂
- 產品的品質標準
第4章 表面材料
- 需求:各材料
- 人造石檯面
- 層壓板檯面
- 天然石材檯面(花崗岩、大理石、其他)
- 固體表面、其他鑄造聚合物檯面
- 瓷磚檯面
- 瓷器厚板/燒結石的檯面
- 其他的資料
第5章 主要供應商和產業結構
- 產業結構
- 主要供應商
- 合併和收購
- 行銷
第6章 附錄
- 範圍
- 定義
- Freedonia的調查手法
- 固有的調查手法
- 資訊來源
- 協會和機關
- 相關調查和報告
- 宏觀經濟的假設
- 經濟環境
- 人口動態趨勢
- 建築物的建設
- 住宅建設
- 住宅的改善與維修
- 商業大樓建設
- 商業大樓的改善與維修
- 住宅完成
- 住宅庫存量
- 消費者取向金融
This Freedonia industry study analyzes the $24.6 billion kitchen countertops market in the US. It presents historical demand data (2011, 2016, and 2021) and forecasts (2026 and 2031) by market (residential, commercial, vehicle), project type (new construction, remodeling), and surface material (laminate, engineered stone, natural stone, solid surface and other cast polymers, tile, porcelain slab/sintered stone, and all other surface materials). The study also offers competitive analysis on industry competitors including Wilsonart, Cambria, Caesarstone, Formica, Panolam, DuPont, Cosentino, and LX Hausys.
Demand for kitchen countertops in the US is forecast to rise 5.0% per year to 662 million square feet in 2026, valued at $37.3 billion. Gains will be supported by:
- consumer willingness to trade up to more expensive materials such as granite and engineered stone to improve home values
- trends favoring larger kitchens with more counter space, including kitchen islands and bar seating areas
- rising commercial building construction
- popularity of extended backsplashes in kitchen designs, particularly of materials that match the countertops themselves
New housing construction and home remodeling began to normalize in 2022 following exceedingly high levels in 2021. This trend will continue through the forecast period, limiting even greater demand gains.
Engineered Stone Surpasses Laminate as the Most Popular Kitchen Countertop Material
In 2021, engineered stone surpassed laminate to become the most used kitchen countertop material in the US, marking the first time in decades that laminate was not the most popular countertop material. Through 2026, engineered stone will significantly expand its leading market share to account for 44% of kitchen countertop demand in area terms:
- The rapid increase in low-cost slabs from foreign markets - particularly India, Turkey, and Vietnam - has made engineered stone countertops more affordable for middle-class homeowners.
- Consumers will continue to strongly prefer the aesthetics and quality of engineered stone over laminates, especially as engineered stone's color availability expands.
Laminates will continue to fall out of favor, with more expensive types like natural stone seeing use instead.
Demand for Porcelain Slab Kitchen Countertops Grows Robustly
Rapidly rising in popularity as an alternative to engineered stone and granite, porcelain slab is expected to be the fastest growing kitchen countertop material. Porcelain slab appeals to consumers who want to differentiate their homes but still install countertops with a natural appearance and favorable performance properties, such as:
- stain resistance in both indoor and outdoor settings, as well as heat and frost resistance, which makes porcelain a top choice for outdoor kitchens
- greater strength and durability when compared to granite
- absence of discoloration or color change issues
- wide variety of finishes, patterns, and colors available from manufacturers
- easy-to-clean, hygienic surface
Table of Contents
1. Executive Summary
2. About This Report
Report Details
Scope & Product Description
Impact of COVID-19 Pandemic
3. Overview
Historical Market Trends
Demand by Market
Demand Forecasts
Residential
Commercial
Vehicles
Demand by Project Type
Demand Forecasts
New Kitchens
Kitchen Remodeling
Pricing Trends
Installation Costs
Sustainability Trends
Green Building Initiatives
Recycling & Recycled Content
Health Concerns
Product Quality Standards
4. Surface Materials
Demand by Material
Engineered Stone Countertops
Laminate Countertops
Natural Stone Countertops (Granite, Marble, Other)
Solid Surface & Other Cast Polymers Countertops
Tile Countertops
Porcelain Slab/Sintered Stone Countertops
Other Materials
5. Key Suppliers & Industry Structure
Industry Composition
Key Suppliers
Mergers & Acquisitions
Marketing
6. Appendix
Scope
Definitions
Freedonia Methodology
Study-Specific Methodology
Sources
Associations & Agencies
Related Studies & Reports
Macroeconomic Assumptions
Economic Environment
Demographic Trends
Building Construction
Residential Building Construction
Residential Improvements & Repairs
Commercial Building Construction
Commercial Building Improvements & Repairs
Housing Completions
Housing Stock
Consumer Financing
List of Tables
2. About This Report
Table 2-1 | Annual Kitchen Countertop Demand by Market & Project Type, 2019 - 2022 (million square feet)
3. Overview
Table 3-1 | Kitchen Countertop Demand, 2011 - 2021 (million dollars & million square feet)
Table 3-2 | Kitchen Countertop Demand by Market, 2011 - 2031 (million square feet & million dollars)
Table 3-3 | Residential Kitchen Countertop Demand by Surface Material, 2011 - 2031 (million square feet & million dollars)
Table 3-4 | Commercial Kitchen Countertop Demand by Surface Material, 2011 - 2031 (million square feet & million dollars)
Table 3-5 | Vehicle Kitchen Countertop Demand by Surface Material, 2011 - 2031 (million square feet & million dollars)
Table 3-6 | Kitchen Countertop Demand by Project Type, 2011 - 2031 (million square feet)
Table 3-7 | New Kitchen Countertop Demand by Surface Material & Market, 2011 - 2031 (million square feet)
Table 3-8 | Kitchen Countertop Remodeling Demand by Surface Material & Market, 2011 - 2031 (million square feet)
Table 3-9 | Kitchen Countertop Pricing by Surface Material, 2011 - 2031 (dollars per square foot)
4. Surface Materials
Table 4-1 | Kitchen Countertop Demand by Surface Material, 2011 - 2031 (million square feet & million dollars)
Table 4-2 | Engineered Stone Kitchen Countertop Demand by Market, 2011 - 2031 (million square feet & million dollars)
Table 4-3 | Laminate Kitchen Countertop Demand by Market, 2011 - 2031 (million square feet & million dollars)
Table 4-4 | Natural Stone Kitchen Countertop Demand by Market, 2011 - 2031 (million square feet & million dollars)
Table 4-5 | Solid Surface & Other Cast Polymer Kitchen Countertop Demand by Market, 2011 - 2031 (million square feet & million dollars)
Table 4-6 | Tile Kitchen Countertop Demand by Market, 2011 - 2031 (million square feet & million dollars)
Table 4-7 | Porcelain Slab/Sintered Stone Kitchen Countertop Demand by Market, 2011 - 2031 (million square feet & million dollars)
Table 4-8 | Other Kitchen Countertop Material Demand by Market, 2011 - 2031 (million square feet & million dollars)
5. Key Suppliers & Industry Structure
Table 5-1 | Selected Mergers & Acquisitions
6. Appendix
Table 6-1 | Relevant Industry Codes
Table 6-2 | Relevant HS Codes
Table 6-3 | Macroeconomic Indicators, 2011 - 2031 (billion 2012 dollars)
Table 6-4 | Population & Households, 2011 - 2031 (million persons)
Table 6-5 | Building Construction Expenditures, 2011 - 2031 (billion 2012 dollars & billion dollars)
Table 6-6 | Residential Building Construction Expenditures, 2011 - 2031 (billion 2012 dollars & billion dollars)
Table 6-7 | Residential Improvement & Repair Expenditures, 2011 - 2031 (billion 2012 dollars & billion dollars)
Table 6-8 | Commercial Building Construction Expenditures, 2011 - 2031 (billion 2012 dollars & billion dollars)
Table 6-9 | Commercial Building Improvement & Repair Expenditures, 2011 - 2031 (billion 2012 dollars & billion dollars)
Table 6-10 | New Housing Indicators, 2011 - 2031
Table 6-11 | Housing Stock by Type, 2011 - 2031 (million units)
Table 6-12 | Consumer Financing Environment, 2011 - 2021
List of Figures
1. Executive Summary
Figure 1-1 | Kitchen Countertops Market
2. About This Report
Figure 2-1 | Kitchen Countertops: Product Examples
Figure 2-2 | Kitchen Countertop Volume Demand by Market, 2019 - 2023 (% annual change)
3. Overview
Figure 3-1 | Kitchen Countertop Demand, 2007 - 2021 (million square feet)
Figure 3-2 | Kitchen Countertop Demand by Market, 2011 - 2031 (million square feet)
Figure 3-3 | Kitchen Countertop Demand by Project Type, 2011 - 2031 (million square feet)
Figure 3-4 | Kitchen Countertop Pricing by Surface Material, 2011 - 2031 (dollars per square foot)
Figure 3-5 | Countertop Installation Costs by Surface Material, 2021 (dollars per square foot)
Figure 3-6 | Average Final Installed Countertop Price by Surface Material, 2021 (dollars per square foot)
4. Surface Materials
Figure 4-1 | Kitchen Countertop Demand by Surface Material, 2011 - 2031 (million square feet)
Figure 4-2 | Engineered Stone Kitchen Countertop Demand by Market, 2011 - 2031 (million square feet)
Figure 4-3 | Laminate Kitchen Countertop Demand by Market, 2011 - 2031 (million square feet)
Figure 4-4 | Natural Stone Kitchen Countertop Demand by Market, 2011 - 2031 (million square feet)
Figure 4-5 | Solid Surface & Other Cast Polymer Kitchen Countertop Demand by Market, 2011 - 2031 (million square feet)
Figure 4-6 | Tile Kitchen Countertop Demand by Market, 2011 - 2031 (million square feet)
Figure 4-7 | Porcelain Slab/Sintered Stone Kitchen Countertop Demand by Market, 2011 - 2031 (million square feet)
Figure 4-8 | Other Kitchen Countertop Material Demand by Market, 2011 - 2031 (million square feet)
6. Appendix
Figure 6-1 | New Housing Square Footage by Housing Type, 2006 - 2021 (average square feet per unit)
Figure 6-2 | Housing Stock: Share by Year of Construction, 2021 (percent)


