


 |
市場調查報告書
商品編碼
1440534
尿素:全球市場佔有率分析、產業趨勢與統計、成長預測(2024-2030)Global Urea - Market Share Analysis, Industry Trends & Statistics, Growth Forecasts (2024 - 2030) |
||||||
價格
※ 本網頁內容可能與最新版本有所差異。詳細情況請與我們聯繫。
簡介目錄
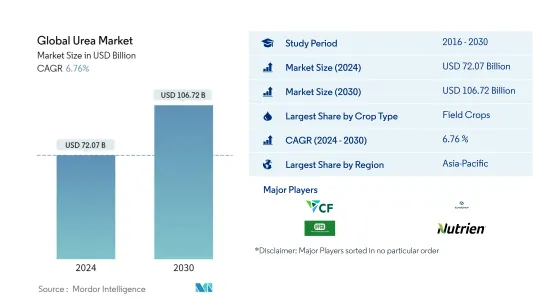
2024年全球尿素市場規模估計為720.7億美元,預計到2030年將達到1067.2億美元,在預測期間(2024-2030年)以6.76%的複合年增長率增長。
主要亮點
- 依類型分類的最大量 - 直接:傳統尿素是全世界消耗最多的肥料,因為氮是作物生長最產量的養分,而且農民非常適應其使用。
- 依塗層類型最大化 - 聚合物塗層:聚合物塗層肥料可在較長時間內釋放養分,並減少土壤中肥料的淋失損失。它還降低了施用率。
- 最大的作物類型 -田間作物:田間作物在世界各地廣泛種植,並且是世界許多地區的主食。在大多數農業國家,它們在單位面積中所佔的佔有率最大。
尿素市場趨勢
依作物類型分類,田間作物是最大的部分。
- 平均而言,田間作物比其他作物類型需要更多的氮。田間作物種植在世界形勢佔據主導地位,佔所有農業用地的95.0%以上。水稻、小麥和玉米是世界上最重要的田間作物,約佔農田總面積的38.0%。田間作物佔據全球尿素市場的大部分,約佔市場價值的86.1%,2021年達到約392.7億美元。田間作物市場主要由亞太地區主導。
- 園藝作物約佔尿素肥料市場總量的10.7%,到2021年將達到約49.6億美元。世界各地對水果和蔬菜的需求正在增加,特別是在大流行之後。亞太地區在園藝作物尿素肥料市場上佔據主導地位,主要是由於該地區廣泛種植園藝作物。
- 北美主導草坪和觀賞作物的尿素肥料市場。草坪和觀賞作物約佔整個市場的60.9%,2021年達到約7.864億美元。眾多高爾夫球場、運動俱樂部和私人草坪區的存在有助於該地區的市場佔有率優勢。例如,美國的草坪覆蓋了約 1500 萬公頃的土地,包括所有體育場、草坪和公園。
- 至於田間作物和園藝作物,由於農業用地充足,亞太地區預計將以更快的速度成長。草坪和裝飾部分生長在北美和歐洲地區。
亞太地區是最大的地區。
- 2021年全球尿素肥料市場價值455.2億美元,消費量為1.146億噸。
- 該地區尿素市佔率最大,2021年佔市佔率63%。預計在預測期內複合年成長率為 5.25%。隨著人口的增加,農業在區域內發展,增加了消費量並帶動了市場。
- 依國家分類,2021年中國和印度分別佔53.8%和19.5%的市場。消費成長主要由尿素作為直接施肥的需求所推動,佔這些國家尿素總消費量的90%以上。因此,預計這些地區的尿素市場在預測期內將大幅成長。
- 北美佔全球尿素市場總量的8.8%。 2021年尿素消費量量為890萬噸,高於2017年的840萬噸。儘管耕地面積減少,尿素消費量卻從2017年的4,660萬公頃增加到4,570萬公頃。觀察到這一趨勢的原因是為了提高可用土地面積上的作物產量和生產力而增加化肥的使用。
- 基於上述因素以及提高生產力以滿足不斷成長的人口的需要,尿素的需求預計將增加,從而在預測期內顯著提振市場。
尿素產業概況
全球尿素市場較為分散,前5名企業佔18.90%。該市場的主要企業包括 CF Industries Holdings Inc、EuroChem Group、IFFCO、Nutrien Limited、Yara(依字母順序排列)。
其他福利
- Excel 格式的市場預測 (ME) 表
- 3 個月分析師支持
目錄
第1章執行摘要和主要發現
第2章 提供報告
第3章簡介
- 研究假設和市場定義
- 調查範圍
- 調查方法
第4章 產業主要趨勢
- 主要作物種植面積
- 平均養分施用量
- 法律規範
- 價值鍊和通路分析
第5章市場區隔
- 特種
- CRF
- 聚合物塗層
- 聚合物硫塗層
- 其他
- SRF
- CRF
- 作物類型
- 田裡的作物
- 園藝作物
- 草坪和裝飾
- 型態
- 傳統的
- 特別的
- 地區
- 亞太地區
- 澳洲
- 孟加拉
- 中國
- 印度
- 印尼
- 日本
- 巴基斯坦
- 菲律賓
- 泰國
- 越南
- 其他亞太地區
- 歐洲
- 法國
- 德國
- 義大利
- 荷蘭
- 俄羅斯
- 西班牙
- 烏克蘭
- 英國
- 其他歐洲國家
- 中東和非洲
- 奈及利亞
- 沙烏地阿拉伯
- 南非
- 土耳其
- 其他中東和非洲
- 北美洲
- 加拿大
- 墨西哥
- 美國
- 北美其他地區
- 南美洲
- 阿根廷
- 巴西
- 南美洲其他地區
- 亞太地區
第6章 競爭形勢
- 重大策略舉措
- 市場佔有率分析
- 公司形勢
- 公司簡介
- CF Industries Holdings Inc
- Coromandel International
- EuroChem Group
- IFFCO
- Koch Fertilizer LLC
- Nutrien Limited
- OCI NV
- SABIC
- URALCHEM JSC
- Yara
第7章 CEO 面臨的關鍵策略問題
第8章附錄
- 世界概況
- 概述
- 波特的五力框架
- 全球價值鏈分析
- 市場動態(DRO)
- 來源和參考文獻
- 表格和圖形列表
- 重要見解
- 資料包
- 詞彙表
簡介目錄
Product Code: 92586
The Global Urea Market size is estimated at USD 72.07 billion in 2024, and is expected to reach USD 106.72 billion by 2030, growing at a CAGR of 6.76% during the forecast period (2024-2030).
Key Highlights
- Largest By Type - Straight : Conventional urea is the most consumed fertilizer globally, as nitrogen is the most yield-limiting nutrient for crop growth, and farmers are highly adapted to its usage.
- Largest by Coating Type - Polymer Coated : The polymer-coated fertilizers release the nutrients for a longer duration and decrease the leaching losses of fertilizers in the soil. They also reduce the application rate.
- Largest By Crop Type - Field Crops : Field crops are widely cultivated worldwide and are a staple food in many parts of the world. They account for a maximum share by area in most agricultural countries.
Urea Market Trends
Field Crops is the largest segment by Crop Type.
- Field crops, on average, require more nitrogen than other crop types. Field crop cultivation dominates the global agricultural landscape, accounting for more than 95.0% of all agricultural land. Rice, wheat, and corn are the world's most important field crops, accounting for about 38.0% of total agricultural land. Field crops dominate the global urea market, accounting for about 86.1% of the market value, amounting to around USD 39.27 billion in 2021. The Asia-Pacific region dominates the market for field crops.
- Horticultural crops accounted for about 10.7% of the total market value of urea fertilizers, amounting to around USD 4.96 billion in 2021. There is an increasing demand for fruits and vegetables around the world, particularly after the pandemic. The Asia-Pacific region dominates the urea fertilizer market for horticultural crops, primarily due to the extensive cultivation of horticultural crops in the region.
- North America dominates the urea fertilizer market in turf and ornamental crops. Turf and ornamental crops accounted for about 60.9% of the total market value, amounting to around USD 786.4 million in 2021. The presence of a large number of golf courses, sports clubs, and private lawn areas contributes to the region's dominance by share. Turf grass, for example, covers about 15.0 million hectares of land in the United States, which includes all stadiums, lawns, and parks.
- In terms of field and horticultural crops, the Asia-Pacific region is anticipated to grow at a faster rate due to the large availability of agricultural land. The turf and the ornamental segment is growing in the North American and European regions.
Asia-Pacific is the largest segment by Region.
- The global urea fertilizers market was valued at USD 45.52 billion in 2021, recording a volume consumption of 114.6 million metric tons.
- The urea market in the region occupies the largest share, accounting for 63% of the market in 2021. It is estimated to register a CAGR of 5.25% during the forecast period. With the increase in population, developments in the agriculture industries are taking place regionally, resulting in an increase in consumption, thereby driving the market.
- By country, China and India accounted for 53.8% and 19.5% of the market in 2021. Consumption growth is mainly driven by the demand for urea as a direct application fertilizer, accounting for more than 90% of the total urea consumption in these countries. Hence, the urea market in these regions is anticipated to grow significantly during the forecast period.
- North America accounted for 8.8% of the total global urea market. The consumption of urea in 2021 was 8.9 million metric tons, which increased from 8.4 million metric tons in 2017. Despite the decrease in the area under cultivation, there was an increase in the consumption of urea from 46.6 million hectares in 2017 to 45.7 million hectares in 2021. This trend was observed due to the higher usage of fertilizers to increase the yield and productivity of the crop in the available land area.
- Based on the aforementioned factors and the need for enhanced productivity to feed the increasing population, the demand for urea is expected to increase, thereby boosting the market significantly during the forecast period.
Urea Industry Overview
The Global Urea Market is fragmented, with the top five companies occupying 18.90%. The major players in this market are CF Industries Holdings Inc, EuroChem Group, IFFCO, Nutrien Limited and Yara (sorted alphabetically).
Additional Benefits:
- The market estimate (ME) sheet in Excel format
- 3 months of analyst support
TABLE OF CONTENTS
1 EXECUTIVE SUMMARY & KEY FINDINGS
2 REPORT OFFERS
3 INTRODUCTION
- 3.1 Study Assumptions & Market Definition
- 3.2 Scope of the Study
- 3.3 Research Methodology
4 KEY INDUSTRY TRENDS
- 4.1 Acreage Of Major Crop Types
- 4.2 Average Nutrient Application Rates
- 4.3 Regulatory Framework
- 4.4 Value Chain & Distribution Channel Analysis
5 MARKET SEGMENTATION
- 5.1 Speciality Type
- 5.1.1 CRF
- 5.1.1.1 Polymer Coated
- 5.1.1.2 Polymer-Sulfur Coated
- 5.1.1.3 Others
- 5.1.2 SRF
- 5.1.1 CRF
- 5.2 Crop Type
- 5.2.1 Field Crops
- 5.2.2 Horticultural Crops
- 5.2.3 Turf & Ornamental
- 5.3 Form
- 5.3.1 Conventional
- 5.3.2 Speciality
- 5.4 Region
- 5.4.1 Asia-Pacific
- 5.4.1.1 Australia
- 5.4.1.2 Bangladesh
- 5.4.1.3 China
- 5.4.1.4 India
- 5.4.1.5 Indonesia
- 5.4.1.6 Japan
- 5.4.1.7 Pakistan
- 5.4.1.8 Philippines
- 5.4.1.9 Thailand
- 5.4.1.10 Vietnam
- 5.4.1.11 Rest Of Asia-Pacific
- 5.4.2 Europe
- 5.4.2.1 France
- 5.4.2.2 Germany
- 5.4.2.3 Italy
- 5.4.2.4 Netherlands
- 5.4.2.5 Russia
- 5.4.2.6 Spain
- 5.4.2.7 Ukraine
- 5.4.2.8 United Kingdom
- 5.4.2.9 Rest Of Europe
- 5.4.3 Middle East & Africa
- 5.4.3.1 Nigeria
- 5.4.3.2 Saudi Arabia
- 5.4.3.3 South Africa
- 5.4.3.4 Turkey
- 5.4.3.5 Rest Of Middle East & Africa
- 5.4.4 North America
- 5.4.4.1 Canada
- 5.4.4.2 Mexico
- 5.4.4.3 United States
- 5.4.4.4 Rest Of North America
- 5.4.5 South America
- 5.4.5.1 Argentina
- 5.4.5.2 Brazil
- 5.4.5.3 Rest Of South America
- 5.4.1 Asia-Pacific
6 COMPETITIVE LANDSCAPE
- 6.1 Key Strategic Moves
- 6.2 Market Share Analysis
- 6.3 Company Landscape
- 6.4 Company Profiles
- 6.4.1 CF Industries Holdings Inc
- 6.4.2 Coromandel International
- 6.4.3 EuroChem Group
- 6.4.4 IFFCO
- 6.4.5 Koch Fertilizer LLC
- 6.4.6 Nutrien Limited
- 6.4.7 OCI NV
- 6.4.8 SABIC
- 6.4.9 URALCHEM JSC
- 6.4.10 Yara
7 KEY STRATEGIC QUESTIONS FOR FERTILIZER CEOS
8 APPENDIX
- 8.1 Global Overview
- 8.1.1 Overview
- 8.1.2 Porter's Five Forces Framework
- 8.1.3 Global Value Chain Analysis
- 8.1.4 Market Dynamics (DROs)
- 8.2 Sources & References
- 8.3 List of Tables & Figures
- 8.4 Primary Insights
- 8.5 Data Pack
- 8.6 Glossary of Terms
02-2729-4219
+886-2-2729-4219
 工業級尿素 - 市場佔有率分析、產業趨勢與統計、成長預測(2024 - 2029)
 2024 年尿素全球市場報告
 尿素市場:依等級、最終用戶產業分類 - 2024-2030 年全球預測
 2024-2028年商用車尿素罐全球市場
 尿素全球市場分析:工廠產能、產量、運營效率、需求/供應、最終用戶行業、銷售渠道、按地區劃分的需求、對外貿易、公司份額 (2015-2032)
 全球尿素市場規模、佔有率和成長分析:按類型和應用分類 - 產業預測(2023-2030)
 奈米尿素市場 - 2018-2028 年全球產業規模、佔有率、趨勢、機會和預測,按最終用戶(糧食作物、經濟作物、園藝作物、種植園作物等)、地區和競爭細分
 尿素市場:2023-2028 年全球行業趨勢、佔有率、規模、成長、機遇和預測
 2023-2030年全球尿素市場
 尿素的生產能力與設備投資(CapEx)的預測:各地區,各主要國家,各企業,計劃(新安裝,擴張,計劃中,已公佈的)(2023年~2030年)
▼