


 |
市場調查報告書
商品編碼
1434792
AIOps 平台市場:按組件、按部署、按組織規模、按應用、按行業 - 2024-2030 年全球預測AIOps Platform Market by Component (Platform, Services), Deployment (Cloud, On-premise), Organization Size, Application, Vertical - Global Forecast 2024-2030 |
||||||
※ 本網頁內容可能與最新版本有所差異。詳細情況請與我們聯繫。
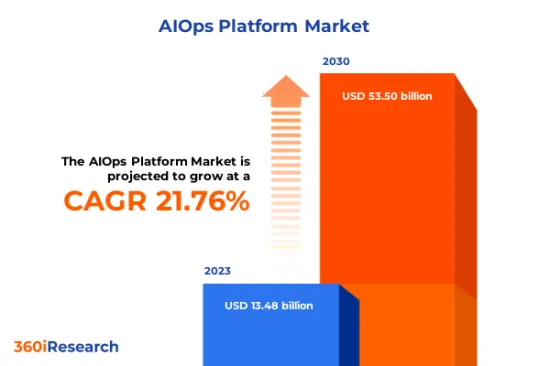
預計2023年AIOps平台市場規模為134.8億美元,預計2024年將達163.7億美元,2030年將達535億美元,複合年成長率為21.76%。
AIOps 平台的全球市場
| 主要市場統計 | |
|---|---|
| 基準年[2023] | 134.8億美元 |
| 預測年份 [2024] | 163.7億美元 |
| 預測年份 [2030] | 535億美元 |
| 複合年成長率(%) | 21.76% |
IT 營運人工智慧 (AIOps) 平台利用先進演算法、機器學習和巨量資料分析來自動化和增強 IT 營運。 AIOps 透過分析來自各種 IT 工具和設備的大量營運資料,幫助偵測問題、分析根本原因並主動解決問題。這使組織能夠簡化 IT 營運、減少停機時間並最佳化服務效能。 IT基礎設施的複雜性不斷增加和資料量不斷增加正在推動市場成長。然而,市場存在局限性,包括缺乏熟練實施和管理 AIOps 平台的專業人士。此外,與 AIOps 整合相關的資料安全和隱私問題也限制了 AIOps 平台的採用。此外,人工智慧和機器學習技術的進步進一步推動了對智慧IT營運解決方案的需求。由於其可擴展性和成本效率,企業正在逐漸採用雲端基礎的AIOps 解決方案。
區域洞察
在美洲地區,成熟的IT基礎設施以及大量早期採用者AI技術的大型企業的存在正在推動對AIOps平台的需求。企業專注於改善使用者體驗並經濟高效地最佳化 IT 營運。 IT 營運對敏捷性、擴充性和高階分析的需求正在影響該地區的客戶購買行為。對人工智慧和機器學習技術的投資以及強大的研究生態系統帶來持續創新,服務於金融、醫療保健和零售等許多行業。歐盟 (EU) 專注於監管合規性、資料隱私和數位轉型工作。這推動了對 AIOps 解決方案的需求,這些解決方案在遵守 GDPR 和其他法規的同時提供見解。歐洲公司表現出謹慎的採購行為,青睞 AIOps 解決方案並優先考慮安全性和合規性。南美洲和 MEA 是 AIOps 平台市場前景看好的地區,受經濟多元化、數位轉型措施和智慧基礎設施投資增加的影響,這兩個地區都呈現出強勁的成長趨勢。亞太地區正迅速採用 AIOps 平台,其中中國、日本和印度等國家處於領先地位。該政府舉措強調了人工智慧的國家戰略,並延伸到AIOps,並展示了對該技術的堅定承諾和投資。企業對技術創新的關注以及高效管理複雜 IT 系統的需求正在推動 AIOps 市場的發展。快速發展的 IT 產業充滿了精通技術的專業人士,他們為 AIOps 解決方案的採用做出了貢獻。
FPNV定位矩陣
FPNV定位矩陣對於評估AIOps平台市場至關重要。我們檢視與業務策略和產品滿意度相關的關鍵指標,以對供應商進行全面評估。這種深入的分析使用戶能夠根據自己的要求做出明智的決策。根據評估,供應商被分為四個成功程度不同的像限:前沿(F)、探路者(P)、利基(N)和重要(V)。
市場佔有率分析
市場佔有率分析是一個綜合工具,可以對 AIOps 平台市場中供應商的現狀進行深入而深入的研究。全面比較和分析供應商在整體收益、基本客群和其他關鍵指標方面的貢獻,以便更好地了解公司的績效及其在爭奪市場佔有率時面臨的挑戰。此外,該分析還提供了對該行業競爭特徵的寶貴見解,包括在研究基準年觀察到的累積、分散主導地位和合併特徵等因素。這種詳細程度的提高使供應商能夠做出更明智的決策並制定有效的策略,從而在市場上獲得競爭優勢。
該報告對以下幾個方面提供了寶貴的見解:
1-市場滲透率:提供有關主要企業所服務的市場的全面資訊。
2-市場開拓:我們深入研究利潤豐厚的新興市場,並分析它們在成熟細分市場中的滲透率。
3- 市場多元化:提供有關新產品發布、開拓地區、最新發展和投資的詳細資訊。
4-競爭力評估與資訊:對主要企業的市場佔有率、策略、產品、認證、監管狀況、專利狀況、製造能力等進行全面評估。
5- 產品開發與創新:提供對未來技術、研發活動和突破性產品開發的見解。
本報告解決了以下關鍵問題:
1-AIOps平台市場的市場規模與預測是多少?
2-AIOps 平台市場預測期內需要考慮投資的產品、細分市場、應用程式和領域有哪些?
3-AIOps平台市場的技術趨勢和法律規範是什麼?
4-AIOps平台市場主要廠商的市場佔有率是多少?
5-進入AIOps平台市場的合適型態和策略手段是什麼?
目錄
第1章 前言
第2章調查方法
第3章執行摘要
第4章市場概況
第5章市場洞察
- 市場動態
- 促進因素
- 亞太地區IT基礎設施基礎架構快速發展,大資料管理帶來的 IT 複雜度不斷增加
- 對解決語言和文化多樣性問題的增強解決方案的需求日益成長
- 對預測分析的需求不斷成長,以主動避免網路問題並最佳化網路效能
- 抑制因素
- 實施並維護 AIOps 平台的複雜性
- 機會
- 開發並推出先進的 AIOps 平台
- AIOps 滿足各經濟體各種監管要求的巨大潛力
- 任務
- 與 AIOps 整合相關的資料安全和隱私問題
- 促進因素
- 市場區隔分析
- 要素:對高效率且經過驗證的服務交付的需求不斷成長
- 採用:更多地採用雲端基礎的模型,這些模型具有較低的初期成本和較高的擴充性
- 組織規模:由於 IT 營運複雜,優先考慮可擴展性和自動化的大型企業對 AIOps 的需求不斷增加
- 應用:網路和安全管理應用大量採用 AIOps 平台
- 垂直領域:透過強大的預測維護功能,在能源和公共產業中更多地採用 AIOps
- 市場趨勢分析
- 專注印度IT產業數位轉型與擴張
- 先進的人工智慧和機器學習演算法技術的整合增加了AIOps平台在中國的採用
- 隨著日本勞動年齡人口的減少,對先進 IT 管理服務和 AIOps 解決方案的需求將會增加。
- 在韓國,先進的科技形勢正成為AIOps平台的合適環境
- 結構完善的國家策略,旨在促進新加坡創建智慧國家,並廣泛部署 AIOps 以支援這一廣泛的數位轉型
- 政府將專注於在澳洲商業部門創建更安全的人工智慧環境和多方面的人工智慧營運考慮
- 高通膨的累積效應
- 波特五力分析
- 價值鍊和關鍵路徑分析
- 法律規範
第6章 AIOps 平台市場:依組件分類
- 平台
- 服務
第 7 章 AIOps 平台市場:按部署分類
- 雲
- 本地
第 8 章 AIOps 平台市場:依組織規模
- 主要企業
- 中小企業
第 9 章 AIOps 平台市場:依應用分類
- 應用效能分析
- 基礎設施管理
- 網路和安全管理
- 即時分析
第10章AIOps平台市場:依產業分類
- BFSI
- 能源和公共
- 政府和國防
- 醫療保健和生命科學
- 資訊科技與電信
- 媒體與娛樂
- 零售與電子商務
第11章 美洲AIOps平台市場
- 阿根廷
- 巴西
- 加拿大
- 墨西哥
- 美國
第12章亞太AIOps平台市場
- 澳洲
- 中國
- 印度
- 印尼
- 日本
- 馬來西亞
- 菲律賓
- 新加坡
- 韓國
- 台灣
- 泰國
- 越南
第13章歐洲、中東和非洲AIOps平台市場
- 丹麥
- 埃及
- 芬蘭
- 法國
- 德國
- 以色列
- 義大利
- 荷蘭
- 奈及利亞
- 挪威
- 波蘭
- 卡達
- 俄羅斯
- 沙烏地阿拉伯
- 南非
- 西班牙
- 瑞典
- 瑞士
- 土耳其
- 阿拉伯聯合大公國
- 英國
第14章競爭形勢
- FPNV定位矩陣
- 市場佔有率分析:主要企業
- 主要企業競爭情境分析
- 併購
- 合約、合作和夥伴關係
- 新產品發布和功能增強
- 投資、資金籌措
第15章競爭組合
- 主要公司簡介
- Amazon Web Services, Inc.
- BigPanda, Inc.
- BMC Software, Inc.
- Broadcom Inc.
- Cisco Systems, Inc.
- CloudFabrix Software Inc.
- Cloudwise
- Datadog, Inc.
- Dell Inc.
- Dynatrace, Inc.
- Elasticsearch BV
- GAVS Technologies
- Google LLC by Alphabet Inc.
- HCL Technologies Limited
- Hewlett Packard Enterprise Company
- Hexaware Technologies Limited
- Infosys Ltd.
- International Business Machines Corporation
- Knot Solutions Pvt. Ltd.
- LogicMonitor Inc.
- LTIMindtree Limited
- MeshIQ
- Microsoft Corporation
- Netreo, Inc.
- New Relic, Inc.
- OKESTRO Co., Ltd.
- OpenText Corporation
- Oracle Corporation
- PagerDuty, Inc.
- Prodapt Solutions Private Limited
- ProphetStor Data Services, Inc.
- ScienceLogic, Inc.
- Selector Software, Inc.
- ServiceNow, Inc.
- Sigma Data Systems
- Tata Consultancy Services Limited
- Tech Mahindra Limited
- VuNet Systems Private Limited
- Wipro Limited
- Zenoss Inc.
- Zoho Corporation
- 主要產品系列
第16章附錄
- 討論指南
- 關於許可證和定價
[199 Pages Report] The AIOps Platform Market size was estimated at USD 13.48 billion in 2023 and expected to reach USD 16.37 billion in 2024, at a CAGR 21.76% to reach USD 53.50 billion by 2030.
Global AIOps Platform Market
| KEY MARKET STATISTICS | |
|---|---|
| Base Year [2023] | USD 13.48 billion |
| Estimated Year [2024] | USD 16.37 billion |
| Forecast Year [2030] | USD 53.50 billion |
| CAGR (%) | 21.76% |
An artificial intelligence for IT operations (AIOps) platform utilizes advanced algorithms, machine learning, and big data analytics to automate and enhance IT operations. AIOps aid in problem detection, root cause analysis, and proactive resolution of issues by analyzing various IT tools and devices' vast volumes of operational data. This allows organizations to streamline IT operations, reduce downtime, and optimize service performance. The increasing complexity of IT infrastructure and a growing volume of data drives the market growth. However, the market faces limitations, such as a lack of skilled professionals adept at implementing and managing AIOps platforms. In addition, data security and privacy concerns associated with AIOps integration limit the adoption of the AIOps platform. Furthermore, advancements in AI and machine learning technologies further propel the demand for smart IT operations solutions. Enterprises are progressively adopting cloud-based AIOps solutions due to their scalable nature and cost efficiency.
Regional Insights
In the Americas region, the demand for AIOps platforms is driven by a mature IT infrastructure and the presence of a significant number of large-scale enterprises that are early adopters of AI technology. The focus on enhancing user experience and optimizing IT operations cost-effectively is prevalent among businesses. The need for agility, scalability, and advanced analytics in IT operations influences customer purchasing behaviors in the region. Investments in AI and ML technologies and a robust research ecosystem lead to ongoing innovation and cater to many verticals, including finance, healthcare, and retail. A high emphasis on regulatory compliance, data privacy, and digital transformation initiatives is observed in the European Union. This has resulted in a strong demand for AIOps solutions that provide insights while adhering to GDPR and other regulations. European enterprises exhibit cautious purchasing behavior, preferring AIOps solutions and prioritizing security and compliance. South America and MEA are promising regions for the AIOps platform market, with both displaying strong growth trends influenced by economic diversification, digital transformation initiatives, and the rise of smart infrastructure investments. The Asia-Pacific region is rapidly embracing AIOps platforms, with countries such as China, Japan, and India leading the way. The government's initiatives underline the national strategy for AI and, by extension, AIOps, showing strong commitment and investment in this technology. Companies focus on technological innovation, and the need to manage complex IT systems effectively drives the AIOps market. The burgeoning IT sector has a vast pool of tech-savvy professionals contributing to adopting AIOps solutions.
FPNV Positioning Matrix
The FPNV Positioning Matrix is pivotal in evaluating the AIOps Platform Market. It offers a comprehensive assessment of vendors, examining key metrics related to Business Strategy and Product Satisfaction. This in-depth analysis empowers users to make well-informed decisions aligned with their requirements. Based on the evaluation, the vendors are then categorized into four distinct quadrants representing varying levels of success: Forefront (F), Pathfinder (P), Niche (N), or Vital (V).
Market Share Analysis
The Market Share Analysis is a comprehensive tool that provides an insightful and in-depth examination of the current state of vendors in the AIOps Platform Market. By meticulously comparing and analyzing vendor contributions in terms of overall revenue, customer base, and other key metrics, we can offer companies a greater understanding of their performance and the challenges they face when competing for market share. Additionally, this analysis provides valuable insights into the competitive nature of the sector, including factors such as accumulation, fragmentation dominance, and amalgamation traits observed over the base year period studied. With this expanded level of detail, vendors can make more informed decisions and devise effective strategies to gain a competitive edge in the market.
Key Company Profiles
The report delves into recent significant developments in the AIOps Platform Market, highlighting leading vendors and their innovative profiles. These include Amazon Web Services, Inc., BigPanda, Inc., BMC Software, Inc., Broadcom Inc., Cisco Systems, Inc., CloudFabrix Software Inc., Cloudwise, Datadog, Inc., Dell Inc., Dynatrace, Inc., Elasticsearch B.V., GAVS Technologies, Google LLC by Alphabet Inc., HCL Technologies Limited, Hewlett Packard Enterprise Company, Hexaware Technologies Limited, Infosys Ltd., International Business Machines Corporation, Knot Solutions Pvt. Ltd., LogicMonitor Inc., LTIMindtree Limited, MeshIQ, Microsoft Corporation, Netreo, Inc., New Relic, Inc., OKESTRO Co., Ltd., OpenText Corporation, Oracle Corporation, PagerDuty, Inc., Prodapt Solutions Private Limited, ProphetStor Data Services, Inc., ScienceLogic, Inc., Selector Software, Inc., ServiceNow, Inc., Sigma Data Systems, Tata Consultancy Services Limited, Tech Mahindra Limited, VuNet Systems Private Limited, Wipro Limited, Zenoss Inc., and Zoho Corporation.
Market Segmentation & Coverage
This research report categorizes the AIOps Platform Market to forecast the revenues and analyze trends in each of the following sub-markets:
- Component
- Platform
- Services
- Deployment
- Cloud
- On-premise
- Organization Size
- Large Enterprises
- Small & Medium Enterprises
- Application
- Application Performance Analysis
- Infrastructure Management
- Network & Security Management
- Real-Time Analytics
- Vertical
- BFSI
- Energy & Utilities
- Government & Defense
- Healthcare & Life Sciences
- IT & Telecom
- Media & Entertainment
- Retail & eCommerce
- Region
- Americas
- Argentina
- Brazil
- Canada
- Mexico
- United States
- California
- Florida
- Illinois
- New York
- Ohio
- Pennsylvania
- Texas
- Asia-Pacific
- Australia
- China
- India
- Indonesia
- Japan
- Malaysia
- Philippines
- Singapore
- South Korea
- Taiwan
- Thailand
- Vietnam
- Europe, Middle East & Africa
- Denmark
- Egypt
- Finland
- France
- Germany
- Israel
- Italy
- Netherlands
- Nigeria
- Norway
- Poland
- Qatar
- Russia
- Saudi Arabia
- South Africa
- Spain
- Sweden
- Switzerland
- Turkey
- United Arab Emirates
- United Kingdom
- Americas
The report offers valuable insights on the following aspects:
1. Market Penetration: It presents comprehensive information on the market provided by key players.
2. Market Development: It delves deep into lucrative emerging markets and analyzes the penetration across mature market segments.
3. Market Diversification: It provides detailed information on new product launches, untapped geographic regions, recent developments, and investments.
4. Competitive Assessment & Intelligence: It conducts an exhaustive assessment of market shares, strategies, products, certifications, regulatory approvals, patent landscape, and manufacturing capabilities of the leading players.
5. Product Development & Innovation: It offers intelligent insights on future technologies, R&D activities, and breakthrough product developments.
The report addresses key questions such as:
1. What is the market size and forecast of the AIOps Platform Market?
2. Which products, segments, applications, and areas should one consider investing in over the forecast period in the AIOps Platform Market?
3. What are the technology trends and regulatory frameworks in the AIOps Platform Market?
4. What is the market share of the leading vendors in the AIOps Platform Market?
5. Which modes and strategic moves are suitable for entering the AIOps Platform Market?
Table of Contents
1. Preface
- 1.1. Objectives of the Study
- 1.2. Market Segmentation & Coverage
- 1.3. Years Considered for the Study
- 1.4. Currency & Pricing
- 1.5. Language
- 1.6. Limitations
- 1.7. Assumptions
- 1.8. Stakeholders
2. Research Methodology
- 2.1. Define: Research Objective
- 2.2. Determine: Research Design
- 2.3. Prepare: Research Instrument
- 2.4. Collect: Data Source
- 2.5. Analyze: Data Interpretation
- 2.6. Formulate: Data Verification
- 2.7. Publish: Research Report
- 2.8. Repeat: Report Update
3. Executive Summary
4. Market Overview
- 4.1. Introduction
- 4.2. AIOps Platform Market, by Region
5. Market Insights
- 5.1. Market Dynamics
- 5.1.1. Drivers
- 5.1.1.1. Rapidly growing IT infrastructure and rising IT complexities related to high-volume data management across Asia-Pacific
- 5.1.1.2. Increasing need for enhanced solutions to address language and cultural diversity
- 5.1.1.3. Growing demand for predictive analytics to preempt network issues and optimize network performance
- 5.1.2. Restraints
- 5.1.2.1. Complexities in implementing and maintaining AIOps platforms
- 5.1.3. Opportunities
- 5.1.3.1. Development and launch of advanced AIOps platforms
- 5.1.3.2. High potential for AIOps to meet varied regulatory requirements across economies
- 5.1.4. Challenges
- 5.1.4.1. Data security and privacy concerns associated with AIOps integration
- 5.1.1. Drivers
- 5.2. Market Segmentation Analysis
- 5.2.1. Component: Rising need for efficient and proven service offerings
- 5.2.2. Deployment: Growing deployment of cloud-based models with less upfront cost, offering high scalability
- 5.2.3. Organization Size: Rising demand for AIOps from large enterprises prioritizing scalability and automation due to complex IT operations
- 5.2.4. Application: Significant adoption of AIOps platforms for network and security management applications
- 5.2.5. Vertical: Higher adoption of AIOps in energy & utilities with strong predictive maintenance capabilities
- 5.3. Market Trend Analysis
- 5.3.1. Significant focus on digital transformation and expansion of the IT industry in India
- 5.3.2. Rising adoption of AIOps platforms in China due to integration of advanced AI and machine learning algorithm technologies
- 5.3.3. Growing need for advanced IT management services and AIOps solutions with reduction in working-age population in Japan
- 5.3.4. Advanced technological landscape is becoming a conducive environment for AIOps platforms in South Korea
- 5.3.5. Well-structured national strategies to promote smart national establishment in Singapore and their extensive deployment of AIOps to support this widespread digital transformation
- 5.3.6. Diversified focus on exploring AIOps across commercial sectors in Australia with government emphasis on building a more secure AI environment
- 5.4. Cumulative Impact of High Inflation
- 5.5. Porter's Five Forces Analysis
- 5.5.1. Threat of New Entrants
- 5.5.2. Threat of Substitutes
- 5.5.3. Bargaining Power of Customers
- 5.5.4. Bargaining Power of Suppliers
- 5.5.5. Industry Rivalry
- 5.6. Value Chain & Critical Path Analysis
- 5.7. Regulatory Framework
6. AIOps Platform Market, by Component
- 6.1. Introduction
- 6.2. Platform
- 6.3. Services
7. AIOps Platform Market, by Deployment
- 7.1. Introduction
- 7.2. Cloud
- 7.3. On-premise
8. AIOps Platform Market, by Organization Size
- 8.1. Introduction
- 8.2. Large Enterprises
- 8.3. Small & Medium Enterprises
9. AIOps Platform Market, by Application
- 9.1. Introduction
- 9.2. Application Performance Analysis
- 9.3. Infrastructure Management
- 9.4. Network & Security Management
- 9.5. Real-Time Analytics
10. AIOps Platform Market, by Vertical
- 10.1. Introduction
- 10.2. BFSI
- 10.3. Energy & Utilities
- 10.4. Government & Defense
- 10.5. Healthcare & Life Sciences
- 10.6. IT & Telecom
- 10.7. Media & Entertainment
- 10.8. Retail & eCommerce
11. Americas AIOps Platform Market
- 11.1. Introduction
- 11.2. Argentina
- 11.3. Brazil
- 11.4. Canada
- 11.5. Mexico
- 11.6. United States
12. Asia-Pacific AIOps Platform Market
- 12.1. Introduction
- 12.2. Australia
- 12.3. China
- 12.4. India
- 12.5. Indonesia
- 12.6. Japan
- 12.7. Malaysia
- 12.8. Philippines
- 12.9. Singapore
- 12.10. South Korea
- 12.11. Taiwan
- 12.12. Thailand
- 12.13. Vietnam
13. Europe, Middle East & Africa AIOps Platform Market
- 13.1. Introduction
- 13.2. Denmark
- 13.3. Egypt
- 13.4. Finland
- 13.5. France
- 13.6. Germany
- 13.7. Israel
- 13.8. Italy
- 13.9. Netherlands
- 13.10. Nigeria
- 13.11. Norway
- 13.12. Poland
- 13.13. Qatar
- 13.14. Russia
- 13.15. Saudi Arabia
- 13.16. South Africa
- 13.17. Spain
- 13.18. Sweden
- 13.19. Switzerland
- 13.20. Turkey
- 13.21. United Arab Emirates
- 13.22. United Kingdom
14. Competitive Landscape
- 14.1. FPNV Positioning Matrix
- 14.2. Market Share Analysis, By Key Player
- 14.3. Competitive Scenario Analysis, By Key Player
- 14.3.1. Merger & Acquisition
- 14.3.1.1. Dell Would Acquire AIOps Platform Moogsoft to Enhancing Offerings
- 14.3.2. Agreement, Collaboration, & Partnership
- 14.3.2.1. Kyndryl and Dynatrace Announce Global Alliance to Enhance Customers' Insights
- 14.3.2.2. GTT Elevates its Global IT Operations with AIOps from Selector
- 14.3.2.3. Google Cloud Collaborates with StarHub to Bolster its Cloud Infinity Transformation Program
- 14.3.2.4. CloudFabrix Announces Validation of HashiCorp Consul Integration and Premier Partner Status, Demonstrating AIOps Value in Multi-cloud Deployments
- 14.3.3. New Product Launch & Enhancement
- 14.3.3.1. LTIMindtree Introduces Canvas CloudXperienz
- 14.3.3.2. BMC Revolutionizes Observability and AIOps With BMC HelixGPT
- 14.3.3.3. Elastic Unveils AI Assistant for Observability and General Availability of Universal Profiling
- 14.3.3.4. Senser Unveils AIOps Platform Using eBPF to Collect Data
- 14.3.3.5. LogicMonitor Expands Observability Intelligence, Introduces New AIOps and ML Capabilities
- 14.3.3.6. Xalient Launches Next Generation AIOps Platform Martina 2.0
- 14.3.3.7. IBM Announces New AIOps Solutions Designed to Automate Software License Compliance
- 14.3.4. Investment & Funding
- 14.3.4.1. Infosys Signs Deal for AI-led Development, to Spend About USD 2 Billion Over Five Years
- 14.3.1. Merger & Acquisition
15. Competitive Portfolio
- 15.1. Key Company Profiles
- 15.1.1. Amazon Web Services, Inc.
- 15.1.2. BigPanda, Inc.
- 15.1.3. BMC Software, Inc.
- 15.1.4. Broadcom Inc.
- 15.1.5. Cisco Systems, Inc.
- 15.1.6. CloudFabrix Software Inc.
- 15.1.7. Cloudwise
- 15.1.8. Datadog, Inc.
- 15.1.9. Dell Inc.
- 15.1.10. Dynatrace, Inc.
- 15.1.11. Elasticsearch B.V.
- 15.1.12. GAVS Technologies
- 15.1.13. Google LLC by Alphabet Inc.
- 15.1.14. HCL Technologies Limited
- 15.1.15. Hewlett Packard Enterprise Company
- 15.1.16. Hexaware Technologies Limited
- 15.1.17. Infosys Ltd.
- 15.1.18. International Business Machines Corporation
- 15.1.19. Knot Solutions Pvt. Ltd.
- 15.1.20. LogicMonitor Inc.
- 15.1.21. LTIMindtree Limited
- 15.1.22. MeshIQ
- 15.1.23. Microsoft Corporation
- 15.1.24. Netreo, Inc.
- 15.1.25. New Relic, Inc.
- 15.1.26. OKESTRO Co., Ltd.
- 15.1.27. OpenText Corporation
- 15.1.28. Oracle Corporation
- 15.1.29. PagerDuty, Inc.
- 15.1.30. Prodapt Solutions Private Limited
- 15.1.31. ProphetStor Data Services, Inc.
- 15.1.32. ScienceLogic, Inc.
- 15.1.33. Selector Software, Inc.
- 15.1.34. ServiceNow, Inc.
- 15.1.35. Sigma Data Systems
- 15.1.36. Tata Consultancy Services Limited
- 15.1.37. Tech Mahindra Limited
- 15.1.38. VuNet Systems Private Limited
- 15.1.39. Wipro Limited
- 15.1.40. Zenoss Inc.
- 15.1.41. Zoho Corporation
- 15.2. Key Product Portfolio
16. Appendix
- 16.1. Discussion Guide
- 16.2. License & Pricing
LIST OF FIGURES
- FIGURE 1. AIOPS PLATFORM MARKET RESEARCH PROCESS
- FIGURE 2. AIOPS PLATFORM MARKET SIZE, 2023 VS 2030
- FIGURE 3. AIOPS PLATFORM MARKET SIZE, 2019-2030 (USD MILLION)
- FIGURE 4. AIOPS PLATFORM MARKET SIZE, BY REGION, 2023 VS 2030 (%)
- FIGURE 5. AIOPS PLATFORM MARKET SIZE, BY REGION, 2023 VS 2024 VS 2030 (USD MILLION)
- FIGURE 6. AIOPS PLATFORM MARKET DYNAMICS
- FIGURE 7. AIOPS PLATFORM MARKET SIZE, BY COMPONENT, 2023 VS 2030 (%)
- FIGURE 8. AIOPS PLATFORM MARKET SIZE, BY COMPONENT, 2023 VS 2024 VS 2030 (USD MILLION)
- FIGURE 9. AIOPS PLATFORM MARKET SIZE, BY DEPLOYMENT, 2023 VS 2030 (%)
- FIGURE 10. AIOPS PLATFORM MARKET SIZE, BY DEPLOYMENT, 2023 VS 2024 VS 2030 (USD MILLION)
- FIGURE 11. AIOPS PLATFORM MARKET SIZE, BY ORGANIZATION SIZE, 2023 VS 2030 (%)
- FIGURE 12. AIOPS PLATFORM MARKET SIZE, BY ORGANIZATION SIZE, 2023 VS 2024 VS 2030 (USD MILLION)
- FIGURE 13. AIOPS PLATFORM MARKET SIZE, BY APPLICATION, 2023 VS 2030 (%)
- FIGURE 14. AIOPS PLATFORM MARKET SIZE, BY APPLICATION, 2023 VS 2024 VS 2030 (USD MILLION)
- FIGURE 15. AIOPS PLATFORM MARKET SIZE, BY VERTICAL, 2023 VS 2030 (%)
- FIGURE 16. AIOPS PLATFORM MARKET SIZE, BY VERTICAL, 2023 VS 2024 VS 2030 (USD MILLION)
- FIGURE 17. AMERICAS AIOPS PLATFORM MARKET SIZE, BY COUNTRY, 2023 VS 2030 (%)
- FIGURE 18. AMERICAS AIOPS PLATFORM MARKET SIZE, BY COUNTRY, 2023 VS 2024 VS 2030 (USD MILLION)
- FIGURE 19. UNITED STATES AIOPS PLATFORM MARKET SIZE, BY STATE, 2023 VS 2030 (%)
- FIGURE 20. UNITED STATES AIOPS PLATFORM MARKET SIZE, BY STATE, 2023 VS 2024 VS 2030 (USD MILLION)
- FIGURE 21. ASIA-PACIFIC AIOPS PLATFORM MARKET SIZE, BY COUNTRY, 2023 VS 2030 (%)
- FIGURE 22. ASIA-PACIFIC AIOPS PLATFORM MARKET SIZE, BY COUNTRY, 2023 VS 2024 VS 2030 (USD MILLION)
- FIGURE 23. EUROPE, MIDDLE EAST & AFRICA AIOPS PLATFORM MARKET SIZE, BY COUNTRY, 2023 VS 2030 (%)
- FIGURE 24. EUROPE, MIDDLE EAST & AFRICA AIOPS PLATFORM MARKET SIZE, BY COUNTRY, 2023 VS 2024 VS 2030 (USD MILLION)
- FIGURE 25. AIOPS PLATFORM MARKET, FPNV POSITIONING MATRIX, 2023
- FIGURE 26. AIOPS PLATFORM MARKET SHARE, BY KEY PLAYER, 2023
LIST OF TABLES
- TABLE 1. AIOPS PLATFORM MARKET SEGMENTATION & COVERAGE
- TABLE 2. UNITED STATES DOLLAR EXCHANGE RATE, 2019-2023
- TABLE 3. AIOPS PLATFORM MARKET SIZE, 2019-2030 (USD MILLION)
- TABLE 4. GLOBAL AIOPS PLATFORM MARKET SIZE, BY REGION, 2019-2030 (USD MILLION)
- TABLE 5. AIOPS PLATFORM MARKET SIZE, BY COMPONENT, 2019-2030 (USD MILLION)
- TABLE 6. AIOPS PLATFORM MARKET SIZE, BY PLATFORM, BY REGION, 2019-2030 (USD MILLION)
- TABLE 7. AIOPS PLATFORM MARKET SIZE, BY SERVICES, BY REGION, 2019-2030 (USD MILLION)
- TABLE 8. AIOPS PLATFORM MARKET SIZE, BY DEPLOYMENT, 2019-2030 (USD MILLION)
- TABLE 9. AIOPS PLATFORM MARKET SIZE, BY CLOUD, BY REGION, 2019-2030 (USD MILLION)
- TABLE 10. AIOPS PLATFORM MARKET SIZE, BY ON-PREMISE, BY REGION, 2019-2030 (USD MILLION)
- TABLE 11. AIOPS PLATFORM MARKET SIZE, BY ORGANIZATION SIZE, 2019-2030 (USD MILLION)
- TABLE 12. AIOPS PLATFORM MARKET SIZE, BY LARGE ENTERPRISES, BY REGION, 2019-2030 (USD MILLION)
- TABLE 13. AIOPS PLATFORM MARKET SIZE, BY SMALL & MEDIUM ENTERPRISES, BY REGION, 2019-2030 (USD MILLION)
- TABLE 14. AIOPS PLATFORM MARKET SIZE, BY APPLICATION, 2019-2030 (USD MILLION)
- TABLE 15. AIOPS PLATFORM MARKET SIZE, BY APPLICATION PERFORMANCE ANALYSIS, BY REGION, 2019-2030 (USD MILLION)
- TABLE 16. AIOPS PLATFORM MARKET SIZE, BY INFRASTRUCTURE MANAGEMENT, BY REGION, 2019-2030 (USD MILLION)
- TABLE 17. AIOPS PLATFORM MARKET SIZE, BY NETWORK & SECURITY MANAGEMENT, BY REGION, 2019-2030 (USD MILLION)
- TABLE 18. AIOPS PLATFORM MARKET SIZE, BY REAL-TIME ANALYTICS, BY REGION, 2019-2030 (USD MILLION)
- TABLE 19. AIOPS PLATFORM MARKET SIZE, BY VERTICAL, 2019-2030 (USD MILLION)
- TABLE 20. AIOPS PLATFORM MARKET SIZE, BY BFSI, BY REGION, 2019-2030 (USD MILLION)
- TABLE 21. AIOPS PLATFORM MARKET SIZE, BY ENERGY & UTILITIES, BY REGION, 2019-2030 (USD MILLION)
- TABLE 22. AIOPS PLATFORM MARKET SIZE, BY GOVERNMENT & DEFENSE, BY REGION, 2019-2030 (USD MILLION)
- TABLE 23. AIOPS PLATFORM MARKET SIZE, BY HEALTHCARE & LIFE SCIENCES, BY REGION, 2019-2030 (USD MILLION)
- TABLE 24. AIOPS PLATFORM MARKET SIZE, BY IT & TELECOM, BY REGION, 2019-2030 (USD MILLION)
- TABLE 25. AIOPS PLATFORM MARKET SIZE, BY MEDIA & ENTERTAINMENT, BY REGION, 2019-2030 (USD MILLION)
- TABLE 26. AIOPS PLATFORM MARKET SIZE, BY RETAIL & ECOMMERCE, BY REGION, 2019-2030 (USD MILLION)
- TABLE 27. AMERICAS AIOPS PLATFORM MARKET SIZE, BY COMPONENT, 2019-2030 (USD MILLION)
- TABLE 28. AMERICAS AIOPS PLATFORM MARKET SIZE, BY DEPLOYMENT, 2019-2030 (USD MILLION)
- TABLE 29. AMERICAS AIOPS PLATFORM MARKET SIZE, BY ORGANIZATION SIZE, 2019-2030 (USD MILLION)
- TABLE 30. AMERICAS AIOPS PLATFORM MARKET SIZE, BY APPLICATION, 2019-2030 (USD MILLION)
- TABLE 31. AMERICAS AIOPS PLATFORM MARKET SIZE, BY VERTICAL, 2019-2030 (USD MILLION)
- TABLE 32. AMERICAS AIOPS PLATFORM MARKET SIZE, BY COUNTRY, 2019-2030 (USD MILLION)
- TABLE 33. ARGENTINA AIOPS PLATFORM MARKET SIZE, BY COMPONENT, 2019-2030 (USD MILLION)
- TABLE 34. ARGENTINA AIOPS PLATFORM MARKET SIZE, BY DEPLOYMENT, 2019-2030 (USD MILLION)
- TABLE 35. ARGENTINA AIOPS PLATFORM MARKET SIZE, BY ORGANIZATION SIZE, 2019-2030 (USD MILLION)
- TABLE 36. ARGENTINA AIOPS PLATFORM MARKET SIZE, BY APPLICATION, 2019-2030 (USD MILLION)
- TABLE 37. ARGENTINA AIOPS PLATFORM MARKET SIZE, BY VERTICAL, 2019-2030 (USD MILLION)
- TABLE 38. BRAZIL AIOPS PLATFORM MARKET SIZE, BY COMPONENT, 2019-2030 (USD MILLION)
- TABLE 39. BRAZIL AIOPS PLATFORM MARKET SIZE, BY DEPLOYMENT, 2019-2030 (USD MILLION)
- TABLE 40. BRAZIL AIOPS PLATFORM MARKET SIZE, BY ORGANIZATION SIZE, 2019-2030 (USD MILLION)
- TABLE 41. BRAZIL AIOPS PLATFORM MARKET SIZE, BY APPLICATION, 2019-2030 (USD MILLION)
- TABLE 42. BRAZIL AIOPS PLATFORM MARKET SIZE, BY VERTICAL, 2019-2030 (USD MILLION)
- TABLE 43. CANADA AIOPS PLATFORM MARKET SIZE, BY COMPONENT, 2019-2030 (USD MILLION)
- TABLE 44. CANADA AIOPS PLATFORM MARKET SIZE, BY DEPLOYMENT, 2019-2030 (USD MILLION)
- TABLE 45. CANADA AIOPS PLATFORM MARKET SIZE, BY ORGANIZATION SIZE, 2019-2030 (USD MILLION)
- TABLE 46. CANADA AIOPS PLATFORM MARKET SIZE, BY APPLICATION, 2019-2030 (USD MILLION)
- TABLE 47. CANADA AIOPS PLATFORM MARKET SIZE, BY VERTICAL, 2019-2030 (USD MILLION)
- TABLE 48. MEXICO AIOPS PLATFORM MARKET SIZE, BY COMPONENT, 2019-2030 (USD MILLION)
- TABLE 49. MEXICO AIOPS PLATFORM MARKET SIZE, BY DEPLOYMENT, 2019-2030 (USD MILLION)
- TABLE 50. MEXICO AIOPS PLATFORM MARKET SIZE, BY ORGANIZATION SIZE, 2019-2030 (USD MILLION)
- TABLE 51. MEXICO AIOPS PLATFORM MARKET SIZE, BY APPLICATION, 2019-2030 (USD MILLION)
- TABLE 52. MEXICO AIOPS PLATFORM MARKET SIZE, BY VERTICAL, 2019-2030 (USD MILLION)
- TABLE 53. UNITED STATES AIOPS PLATFORM MARKET SIZE, BY COMPONENT, 2019-2030 (USD MILLION)
- TABLE 54. UNITED STATES AIOPS PLATFORM MARKET SIZE, BY DEPLOYMENT, 2019-2030 (USD MILLION)
- TABLE 55. UNITED STATES AIOPS PLATFORM MARKET SIZE, BY ORGANIZATION SIZE, 2019-2030 (USD MILLION)
- TABLE 56. UNITED STATES AIOPS PLATFORM MARKET SIZE, BY APPLICATION, 2019-2030 (USD MILLION)
- TABLE 57. UNITED STATES AIOPS PLATFORM MARKET SIZE, BY VERTICAL, 2019-2030 (USD MILLION)
- TABLE 58. UNITED STATES AIOPS PLATFORM MARKET SIZE, BY STATE, 2019-2030 (USD MILLION)
- TABLE 59. ASIA-PACIFIC AIOPS PLATFORM MARKET SIZE, BY COMPONENT, 2019-2030 (USD MILLION)
- TABLE 60. ASIA-PACIFIC AIOPS PLATFORM MARKET SIZE, BY DEPLOYMENT, 2019-2030 (USD MILLION)
- TABLE 61. ASIA-PACIFIC AIOPS PLATFORM MARKET SIZE, BY ORGANIZATION SIZE, 2019-2030 (USD MILLION)
- TABLE 62. ASIA-PACIFIC AIOPS PLATFORM MARKET SIZE, BY APPLICATION, 2019-2030 (USD MILLION)
- TABLE 63. ASIA-PACIFIC AIOPS PLATFORM MARKET SIZE, BY VERTICAL, 2019-2030 (USD MILLION)
- TABLE 64. ASIA-PACIFIC AIOPS PLATFORM MARKET SIZE, BY COUNTRY, 2019-2030 (USD MILLION)
- TABLE 65. AUSTRALIA AIOPS PLATFORM MARKET SIZE, BY COMPONENT, 2019-2030 (USD MILLION)
- TABLE 66. AUSTRALIA AIOPS PLATFORM MARKET SIZE, BY DEPLOYMENT, 2019-2030 (USD MILLION)
- TABLE 67. AUSTRALIA AIOPS PLATFORM MARKET SIZE, BY ORGANIZATION SIZE, 2019-2030 (USD MILLION)
- TABLE 68. AUSTRALIA AIOPS PLATFORM MARKET SIZE, BY APPLICATION, 2019-2030 (USD MILLION)
- TABLE 69. AUSTRALIA AIOPS PLATFORM MARKET SIZE, BY VERTICAL, 2019-2030 (USD MILLION)
- TABLE 70. CHINA AIOPS PLATFORM MARKET SIZE, BY COMPONENT, 2019-2030 (USD MILLION)
- TABLE 71. CHINA AIOPS PLATFORM MARKET SIZE, BY DEPLOYMENT, 2019-2030 (USD MILLION)
- TABLE 72. CHINA AIOPS PLATFORM MARKET SIZE, BY ORGANIZATION SIZE, 2019-2030 (USD MILLION)
- TABLE 73. CHINA AIOPS PLATFORM MARKET SIZE, BY APPLICATION, 2019-2030 (USD MILLION)
- TABLE 74. CHINA AIOPS PLATFORM MARKET SIZE, BY VERTICAL, 2019-2030 (USD MILLION)
- TABLE 75. INDIA AIOPS PLATFORM MARKET SIZE, BY COMPONENT, 2019-2030 (USD MILLION)
- TABLE 76. INDIA AIOPS PLATFORM MARKET SIZE, BY DEPLOYMENT, 2019-2030 (USD MILLION)
- TABLE 77. INDIA AIOPS PLATFORM MARKET SIZE, BY ORGANIZATION SIZE, 2019-2030 (USD MILLION)
- TABLE 78. INDIA AIOPS PLATFORM MARKET SIZE, BY APPLICATION, 2019-2030 (USD MILLION)
- TABLE 79. INDIA AIOPS PLATFORM MARKET SIZE, BY VERTICAL, 2019-2030 (USD MILLION)
- TABLE 80. INDONESIA AIOPS PLATFORM MARKET SIZE, BY COMPONENT, 2019-2030 (USD MILLION)
- TABLE 81. INDONESIA AIOPS PLATFORM MARKET SIZE, BY DEPLOYMENT, 2019-2030 (USD MILLION)
- TABLE 82. INDONESIA AIOPS PLATFORM MARKET SIZE, BY ORGANIZATION SIZE, 2019-2030 (USD MILLION)
- TABLE 83. INDONESIA AIOPS PLATFORM MARKET SIZE, BY APPLICATION, 2019-2030 (USD MILLION)
- TABLE 84. INDONESIA AIOPS PLATFORM MARKET SIZE, BY VERTICAL, 2019-2030 (USD MILLION)
- TABLE 85. JAPAN AIOPS PLATFORM MARKET SIZE, BY COMPONENT, 2019-2030 (USD MILLION)
- TABLE 86. JAPAN AIOPS PLATFORM MARKET SIZE, BY DEPLOYMENT, 2019-2030 (USD MILLION)
- TABLE 87. JAPAN AIOPS PLATFORM MARKET SIZE, BY ORGANIZATION SIZE, 2019-2030 (USD MILLION)
- TABLE 88. JAPAN AIOPS PLATFORM MARKET SIZE, BY APPLICATION, 2019-2030 (USD MILLION)
- TABLE 89. JAPAN AIOPS PLATFORM MARKET SIZE, BY VERTICAL, 2019-2030 (USD MILLION)
- TABLE 90. MALAYSIA AIOPS PLATFORM MARKET SIZE, BY COMPONENT, 2019-2030 (USD MILLION)
- TABLE 91. MALAYSIA AIOPS PLATFORM MARKET SIZE, BY DEPLOYMENT, 2019-2030 (USD MILLION)
- TABLE 92. MALAYSIA AIOPS PLATFORM MARKET SIZE, BY ORGANIZATION SIZE, 2019-2030 (USD MILLION)
- TABLE 93. MALAYSIA AIOPS PLATFORM MARKET SIZE, BY APPLICATION, 2019-2030 (USD MILLION)
- TABLE 94. MALAYSIA AIOPS PLATFORM MARKET SIZE, BY VERTICAL, 2019-2030 (USD MILLION)
- TABLE 95. PHILIPPINES AIOPS PLATFORM MARKET SIZE, BY COMPONENT, 2019-2030 (USD MILLION)
- TABLE 96. PHILIPPINES AIOPS PLATFORM MARKET SIZE, BY DEPLOYMENT, 2019-2030 (USD MILLION)
- TABLE 97. PHILIPPINES AIOPS PLATFORM MARKET SIZE, BY ORGANIZATION SIZE, 2019-2030 (USD MILLION)
- TABLE 98. PHILIPPINES AIOPS PLATFORM MARKET SIZE, BY APPLICATION, 2019-2030 (USD MILLION)
- TABLE 99. PHILIPPINES AIOPS PLATFORM MARKET SIZE, BY VERTICAL, 2019-2030 (USD MILLION)
- TABLE 100. SINGAPORE AIOPS PLATFORM MARKET SIZE, BY COMPONENT, 2019-2030 (USD MILLION)
- TABLE 101. SINGAPORE AIOPS PLATFORM MARKET SIZE, BY DEPLOYMENT, 2019-2030 (USD MILLION)
- TABLE 102. SINGAPORE AIOPS PLATFORM MARKET SIZE, BY ORGANIZATION SIZE, 2019-2030 (USD MILLION)
- TABLE 103. SINGAPORE AIOPS PLATFORM MARKET SIZE, BY APPLICATION, 2019-2030 (USD MILLION)
- TABLE 104. SINGAPORE AIOPS PLATFORM MARKET SIZE, BY VERTICAL, 2019-2030 (USD MILLION)
- TABLE 105. SOUTH KOREA AIOPS PLATFORM MARKET SIZE, BY COMPONENT, 2019-2030 (USD MILLION)
- TABLE 106. SOUTH KOREA AIOPS PLATFORM MARKET SIZE, BY DEPLOYMENT, 2019-2030 (USD MILLION)
- TABLE 107. SOUTH KOREA AIOPS PLATFORM MARKET SIZE, BY ORGANIZATION SIZE, 2019-2030 (USD MILLION)
- TABLE 108. SOUTH KOREA AIOPS PLATFORM MARKET SIZE, BY APPLICATION, 2019-2030 (USD MILLION)
- TABLE 109. SOUTH KOREA AIOPS PLATFORM MARKET SIZE, BY VERTICAL, 2019-2030 (USD MILLION)
- TABLE 110. TAIWAN AIOPS PLATFORM MARKET SIZE, BY COMPONENT, 2019-2030 (USD MILLION)
- TABLE 111. TAIWAN AIOPS PLATFORM MARKET SIZE, BY DEPLOYMENT, 2019-2030 (USD MILLION)
- TABLE 112. TAIWAN AIOPS PLATFORM MARKET SIZE, BY ORGANIZATION SIZE, 2019-2030 (USD MILLION)
- TABLE 113. TAIWAN AIOPS PLATFORM MARKET SIZE, BY APPLICATION, 2019-2030 (USD MILLION)
- TABLE 114. TAIWAN AIOPS PLATFORM MARKET SIZE, BY VERTICAL, 2019-2030 (USD MILLION)
- TABLE 115. THAILAND AIOPS PLATFORM MARKET SIZE, BY COMPONENT, 2019-2030 (USD MILLION)
- TABLE 116. THAILAND AIOPS PLATFORM MARKET SIZE, BY DEPLOYMENT, 2019-2030 (USD MILLION)
- TABLE 117. THAILAND AIOPS PLATFORM MARKET SIZE, BY ORGANIZATION SIZE, 2019-2030 (USD MILLION)
- TABLE 118. THAILAND AIOPS PLATFORM MARKET SIZE, BY APPLICATION, 2019-2030 (USD MILLION)
- TABLE 119. THAILAND AIOPS PLATFORM MARKET SIZE, BY VERTICAL, 2019-2030 (USD MILLION)
- TABLE 120. VIETNAM AIOPS PLATFORM MARKET SIZE, BY COMPONENT, 2019-2030 (USD MILLION)
- TABLE 121. VIETNAM AIOPS PLATFORM MARKET SIZE, BY DEPLOYMENT, 2019-2030 (USD MILLION)
- TABLE 122. VIETNAM AIOPS PLATFORM MARKET SIZE, BY ORGANIZATION SIZE, 2019-2030 (USD MILLION)
- TABLE 123. VIETNAM AIOPS PLATFORM MARKET SIZE, BY APPLICATION, 2019-2030 (USD MILLION)
- TABLE 124. VIETNAM AIOPS PLATFORM MARKET SIZE, BY VERTICAL, 2019-2030 (USD MILLION)
- TABLE 125. EUROPE, MIDDLE EAST & AFRICA AIOPS PLATFORM MARKET SIZE, BY COMPONENT, 2019-2030 (USD MILLION)
- TABLE 126. EUROPE, MIDDLE EAST & AFRICA AIOPS PLATFORM MARKET SIZE, BY DEPLOYMENT, 2019-2030 (USD MILLION)
- TABLE 127. EUROPE, MIDDLE EAST & AFRICA AIOPS PLATFORM MARKET SIZE, BY ORGANIZATION SIZE, 2019-2030 (USD MILLION)
- TABLE 128. EUROPE, MIDDLE EAST & AFRICA AIOPS PLATFORM MARKET SIZE, BY APPLICATION, 2019-2030 (USD MILLION)
- TABLE 129. EUROPE, MIDDLE EAST & AFRICA AIOPS PLATFORM MARKET SIZE, BY VERTICAL, 2019-2030 (USD MILLION)
- TABLE 130. EUROPE, MIDDLE EAST & AFRICA AIOPS PLATFORM MARKET SIZE, BY COUNTRY, 2019-2030 (USD MILLION)
- TABLE 131. DENMARK AIOPS PLATFORM MARKET SIZE, BY COMPONENT, 2019-2030 (USD MILLION)
- TABLE 132. DENMARK AIOPS PLATFORM MARKET SIZE, BY DEPLOYMENT, 2019-2030 (USD MILLION)
- TABLE 133. DENMARK AIOPS PLATFORM MARKET SIZE, BY ORGANIZATION SIZE, 2019-2030 (USD MILLION)
- TABLE 134. DENMARK AIOPS PLATFORM MARKET SIZE, BY APPLICATION, 2019-2030 (USD MILLION)
- TABLE 135. DENMARK AIOPS PLATFORM MARKET SIZE, BY VERTICAL, 2019-2030 (USD MILLION)
- TABLE 136. EGYPT AIOPS PLATFORM MARKET SIZE, BY COMPONENT, 2019-2030 (USD MILLION)
- TABLE 137. EGYPT AIOPS PLATFORM MARKET SIZE, BY DEPLOYMENT, 2019-2030 (USD MILLION)
- TABLE 138. EGYPT AIOPS PLATFORM MARKET SIZE, BY ORGANIZATION SIZE, 2019-2030 (USD MILLION)
- TABLE 139. EGYPT AIOPS PLATFORM MARKET SIZE, BY APPLICATION, 2019-2030 (USD MILLION)
- TABLE 140. EGYPT AIOPS PLATFORM MARKET SIZE, BY VERTICAL, 2019-2030 (USD MILLION)
- TABLE 141. FINLAND AIOPS PLATFORM MARKET SIZE, BY COMPONENT, 2019-2030 (USD MILLION)
- TABLE 142. FINLAND AIOPS PLATFORM MARKET SIZE, BY DEPLOYMENT, 2019-2030 (USD MILLION)
- TABLE 143. FINLAND AIOPS PLATFORM MARKET SIZE, BY ORGANIZATION SIZE, 2019-2030 (USD MILLION)
- TABLE 144. FINLAND AIOPS PLATFORM MARKET SIZE, BY APPLICATION, 2019-2030 (USD MILLION)
- TABLE 145. FINLAND AIOPS PLATFORM MARKET SIZE, BY VERTICAL, 2019-2030 (USD MILLION)
- TABLE 146. FRANCE AIOPS PLATFORM MARKET SIZE, BY COMPONENT, 2019-2030 (USD MILLION)
- TABLE 147. FRANCE AIOPS PLATFORM MARKET SIZE, BY DEPLOYMENT, 2019-2030 (USD MILLION)
- TABLE 148. FRANCE AIOPS PLATFORM MARKET SIZE, BY ORGANIZATION SIZE, 2019-2030 (USD MILLION)
- TABLE 149. FRANCE AIOPS PLATFORM MARKET SIZE, BY APPLICATION, 2019-2030 (USD MILLION)
- TABLE 150. FRANCE AIOPS PLATFORM MARKET SIZE, BY VERTICAL, 2019-2030 (USD MILLION)
- TABLE 151. GERMANY AIOPS PLATFORM MARKET SIZE, BY COMPONENT, 2019-2030 (USD MILLION)
- TABLE 152. GERMANY AIOPS PLATFORM MARKET SIZE, BY DEPLOYMENT, 2019-2030 (USD MILLION)
- TABLE 153. GERMANY AIOPS PLATFORM MARKET SIZE, BY ORGANIZATION SIZE, 2019-2030 (USD MILLION)
- TABLE 154. GERMANY AIOPS PLATFORM MARKET SIZE, BY APPLICATION, 2019-2030 (USD MILLION)
- TABLE 155. GERMANY AIOPS PLATFORM MARKET SIZE, BY VERTICAL, 2019-2030 (USD MILLION)
- TABLE 156. ISRAEL AIOPS PLATFORM MARKET SIZE, BY COMPONENT, 2019-2030 (USD MILLION)
- TABLE 157. ISRAEL AIOPS PLATFORM MARKET SIZE, BY DEPLOYMENT, 2019-2030 (USD MILLION)
- TABLE 158. ISRAEL AIOPS PLATFORM MARKET SIZE, BY ORGANIZATION SIZE, 2019-2030 (USD MILLION)
- TABLE 159. ISRAEL AIOPS PLATFORM MARKET SIZE, BY APPLICATION, 2019-2030 (USD MILLION)
- TABLE 160. ISRAEL AIOPS PLATFORM MARKET SIZE, BY VERTICAL, 2019-2030 (USD MILLION)
- TABLE 161. ITALY AIOPS PLATFORM MARKET SIZE, BY COMPONENT, 2019-2030 (USD MILLION)
- TABLE 162. ITALY AIOPS PLATFORM MARKET SIZE, BY DEPLOYMENT, 2019-2030 (USD MILLION)
- TABLE 163. ITALY AIOPS PLATFORM MARKET SIZE, BY ORGANIZATION SIZE, 2019-2030 (USD MILLION)
- TABLE 164. ITALY AIOPS PLATFORM MARKET SIZE, BY APPLICATION, 2019-2030 (USD MILLION)
- TABLE 165. ITALY AIOPS PLATFORM MARKET SIZE, BY VERTICAL, 2019-2030 (USD MILLION)
- TABLE 166. NETHERLANDS AIOPS PLATFORM MARKET SIZE, BY COMPONENT, 2019-2030 (USD MILLION)
- TABLE 167. NETHERLANDS AIOPS PLATFORM MARKET SIZE, BY DEPLOYMENT, 2019-2030 (USD MILLION)
- TABLE 168. NETHERLANDS AIOPS PLATFORM MARKET SIZE, BY ORGANIZATION SIZE, 2019-2030 (USD MILLION)
- TABLE 169. NETHERLANDS AIOPS PLATFORM MARKET SIZE, BY APPLICATION, 2019-2030 (USD MILLION)
- TABLE 170. NETHERLANDS AIOPS PLATFORM MARKET SIZE, BY VERTICAL, 2019-2030 (USD MILLION)
- TABLE 171. NIGERIA AIOPS PLATFORM MARKET SIZE, BY COMPONENT, 2019-2030 (USD MILLION)
- TABLE 172. NIGERIA AIOPS PLATFORM MARKET SIZE, BY DEPLOYMENT, 2019-2030 (USD MILLION)
- TABLE 173. NIGERIA AIOPS PLATFORM MARKET SIZE, BY ORGANIZATION SIZE, 2019-2030 (USD MILLION)
- TABLE 174. NIGERIA AIOPS PLATFORM MARKET SIZE, BY APPLICATION, 2019-2030 (USD MILLION)
- TABLE 175. NIGERIA AIOPS PLATFORM MARKET SIZE, BY VERTICAL, 2019-2030 (USD MILLION)
- TABLE 176. NORWAY AIOPS PLATFORM MARKET SIZE, BY COMPONENT, 2019-2030 (USD MILLION)
- TABLE 177. NORWAY AIOPS PLATFORM MARKET SIZE, BY DEPLOYMENT, 2019-2030 (USD MILLION)
- TABLE 178. NORWAY AIOPS PLATFORM MARKET SIZE, BY ORGANIZATION SIZE, 2019-2030 (USD MILLION)
- TABLE 179. NORWAY AIOPS PLATFORM MARKET SIZE, BY APPLICATION, 2019-2030 (USD MILLION)
- TABLE 180. NORWAY AIOPS PLATFORM MARKET SIZE, BY VERTICAL, 2019-2030 (USD MILLION)
- TABLE 181. POLAND AIOPS PLATFORM MARKET SIZE, BY COMPONENT, 2019-2030 (USD MILLION)
- TABLE 182. POLAND AIOPS PLATFORM MARKET SIZE, BY DEPLOYMENT, 2019-2030 (USD MILLION)
- TABLE 183. POLAND AIOPS PLATFORM MARKET SIZE, BY ORGANIZATION SIZE, 2019-2030 (USD MILLION)
- TABLE 184. POLAND AIOPS PLATFORM MARKET SIZE, BY APPLICATION, 2019-2030 (USD MILLION)
- TABLE 185. POLAND AIOPS PLATFORM MARKET SIZE, BY VERTICAL, 2019-2030 (USD MILLION)
- TABLE 186. QATAR AIOPS PLATFORM MARKET SIZE, BY COMPONENT, 2019-2030 (USD MILLION)
- TABLE 187. QATAR AIOPS PLATFORM MARKET SIZE, BY DEPLOYMENT, 2019-2030 (USD MILLION)
- TABLE 188. QATAR AIOPS PLATFORM MARKET SIZE, BY ORGANIZATION SIZE, 2019-2030 (USD MILLION)
- TABLE 189. QATAR AIOPS PLATFORM MARKET SIZE, BY APPLICATION, 2019-2030 (USD MILLION)
- TABLE 190. QATAR AIOPS PLATFORM MARKET SIZE, BY VERTICAL, 2019-2030 (USD MILLION)
- TABLE 191. RUSSIA AIOPS PLATFORM MARKET SIZE, BY COMPONENT, 2019-2030 (USD MILLION)
- TABLE 192. RUSSIA AIOPS PLATFORM MARKET SIZE, BY DEPLOYMENT, 2019-2030 (USD MILLION)
- TABLE 193. RUSSIA AIOPS PLATFORM MARKET SIZE, BY ORGANIZATION SIZE, 2019-2030 (USD MILLION)
- TABLE 194. RUSSIA AIOPS PLATFORM MARKET SIZE, BY APPLICATION, 2019-2030 (USD MILLION)
- TABLE 195. RUSSIA AIOPS PLATFORM MARKET SIZE, BY VERTICAL, 2019-2030 (USD MILLION)
- TABLE 196. SAUDI ARABIA AIOPS PLATFORM MARKET SIZE, BY COMPONENT, 2019-2030 (USD MILLION)
- TABLE 197. SAUDI ARABIA AIOPS PLATFORM MARKET SIZE, BY DEPLOYMENT, 2019-2030 (USD MILLION)
- TABLE 198. SAUDI ARABIA AIOPS PLATFORM MARKET SIZE, BY ORGANIZATION SIZE, 2019-2030 (USD MILLION)
- TABLE 199. SAUDI ARABIA AIOPS PLATFORM MARKET SIZE, BY APPLICATION, 2019-2030 (USD MILLION)
- TABLE 200. SAUDI ARABIA AIOPS PLATFORM MARKET SIZE, BY VERTICAL, 2019-2030 (USD MILLION)
- TABLE 201. SOUTH AFRICA AIOPS PLATFORM MARKET SIZE, BY COMPONENT, 2019-2030 (USD MILLION)
- TABLE 202. SOUTH AFRICA AIOPS PLATFORM MARKET SIZE, BY DEPLOYMENT, 2019-2030 (USD MILLION)
- TABLE 203. SOUTH AFRICA AIOPS PLATFORM MARKET SIZE, BY ORGANIZATION SIZE, 2019-2030 (USD MILLION)
- TABLE 204. SOUTH AFRICA AIOPS PLATFORM MARKET SIZE, BY APPLICATION, 2019-2030 (USD MILLION)
- TABLE 205. SOUTH AFRICA AIOPS PLATFORM MARKET SIZE, BY VERTICAL, 2019-2030 (USD MILLION)
- TABLE 206. SPAIN AIOPS PLATFORM MARKET SIZE, BY COMPONENT, 2019-2030 (USD MILLION)
- TABLE 207. SPAIN AIOPS PLATFORM MARKET SIZE, BY DEPLOYMENT, 2019-2030 (USD MILLION)
- TABLE 208. SPAIN AIOPS PLATFORM MARKET SIZE, BY ORGANIZATION SIZE, 2019-2030 (USD MILLION)
- TABLE 209. SPAIN AIOPS PLATFORM MARKET SIZE, BY APPLICATION, 2019-2030 (USD MILLION)
- TABLE 210. SPAIN AIOPS PLATFORM MARKET SIZE, BY VERTICAL, 2019-2030 (USD MILLION)
- TABLE 211. SWEDEN AIOPS PLATFORM MARKET SIZE, BY COMPONENT, 2019-2030 (USD MILLION)
- TABLE 212. SWEDEN AIOPS PLATFORM MARKET SIZE, BY DEPLOYMENT, 2019-2030 (USD MILLION)
- TABLE 213. SWEDEN AIOPS PLATFORM MARKET SIZE, BY ORGANIZATION SIZE, 2019-2030 (USD MILLION)
- TABLE 214. SWEDEN AIOPS PLATFORM MARKET SIZE, BY APPLICATION, 2019-2030 (USD MILLION)
- TABLE 215. SWEDEN AIOPS PLATFORM MARKET SIZE, BY VERTICAL, 2019-2030 (USD MILLION)
- TABLE 216. SWITZERLAND AIOPS PLATFORM MARKET SIZE, BY COMPONENT, 2019-2030 (USD MILLION)
- TABLE 217. SWITZERLAND AIOPS PLATFORM MARKET SIZE, BY DEPLOYMENT, 2019-2030 (USD MILLION)
- TABLE 218. SWITZERLAND AIOPS PLATFORM MARKET SIZE, BY ORGANIZATION SIZE, 2019-2030 (USD MILLION)
- TABLE 219. SWITZERLAND AIOPS PLATFORM MARKET SIZE, BY APPLICATION, 2019-2030 (USD MILLION)
- TABLE 220. SWITZERLAND AIOPS PLATFORM MARKET SIZE, BY VERTICAL, 2019-2030 (USD MILLION)
- TABLE 221. TURKEY AIOPS PLATFORM MARKET SIZE, BY COMPONENT, 2019-2030 (USD MILLION)
- TABLE 222. TURKEY AIOPS PLATFORM MARKET SIZE, BY DEPLOYMENT, 2019-2030 (USD MILLION)
- TABLE 223. TURKEY AIOPS PLATFORM MARKET SIZE, BY ORGANIZATION SIZE, 2019-2030 (USD MILLION)
- TABLE 224. TURKEY AIOPS PLATFORM MARKET SIZE, BY APPLICATION, 2019-2030 (USD MILLION)
- TABLE 225. TURKEY AIOPS PLATFORM MARKET SIZE, BY VERTICAL, 2019-2030 (USD MILLION)
- TABLE 226. UNITED ARAB EMIRATES AIOPS PLATFORM MARKET SIZE, BY COMPONENT, 2019-2030 (USD MILLION)
- TABLE 227. UNITED ARAB EMIRATES AIOPS PLATFORM MARKET SIZE, BY DEPLOYMENT, 2019-2030 (USD MILLION)
- TABLE 228. UNITED ARAB EMIRATES AIOPS PLATFORM MARKET SIZE, BY ORGANIZATION SIZE, 2019-2030 (USD MILLION)
- TABLE 229. UNITED ARAB EMIRATES AIOPS PLATFORM MARKET SIZE, BY APPLICATION, 2019-2030 (USD MILLION)
- TABLE 230. UNITED ARAB EMIRATES AIOPS PLATFORM MARKET SIZE, BY VERTICAL, 2019-2030 (USD MILLION)
- TABLE 231. UNITED KINGDOM AIOPS PLATFORM MARKET SIZE, BY COMPONENT, 2019-2030 (USD MILLION)
- TABLE 232. UNITED KINGDOM AIOPS PLATFORM MARKET SIZE, BY DEPLOYMENT, 2019-2030 (USD MILLION)
- TABLE 233. UNITED KINGDOM AIOPS PLATFORM MARKET SIZE, BY ORGANIZATION SIZE, 2019-2030 (USD MILLION)
- TABLE 234. UNITED KINGDOM AIOPS PLATFORM MARKET SIZE, BY APPLICATION, 2019-2030 (USD MILLION)
- TABLE 235. UNITED KINGDOM AIOPS PLATFORM MARKET SIZE, BY VERTICAL, 2019-2030 (USD MILLION)
- TABLE 236. AIOPS PLATFORM MARKET, FPNV POSITIONING MATRIX, 2023
- TABLE 237. AIOPS PLATFORM MARKET SHARE, BY KEY PLAYER, 2023
- TABLE 238. AIOPS PLATFORM MARKET LICENSE & PRICING
 2024 年 IT 營運平台人工智慧全球市場報告
 IT 營運平台人工智慧的全球市場規模、佔有率和成長分析(按產品和應用分類)—2024-2031 年產業預測
 AIOps:市場佔有率分析、產業趨勢與統計、成長預測(2024-2029)
 IT 營運人工智慧市場:按組件、功能、部署和行業分類 - 2024-2030 年全球預測
 AIOps 平台市場:依組件、依組織規模、依行業、依地區
 AIOps全球市場報告 2024年
 AIOps(IT 營運人工智慧)平台市場規模、佔有率、趨勢分析報告:按產品、按應用、按部署模式、按組織規模、按行業、按地區、細分市場預測,2023-2030 年
 AIOps 平台的全球市場:按產品(平台(以領域為中心、與領域無關)、按服務(專業、託管))、按應用、按部署模式、按行業、按地區 - 預測到 2028 年
 IT 運營中的人工智能 (AIOps) 市場規模(按組件、部署模型、公司規模、應用、最終用途和預測),2023-2032 年
 AIOps平台的全球市場