


 |
市場調查報告書
商品編碼
1434420
農業科學市場:按產品、按應用分類 - 2024-2030 年全球預測Agroscience Market by Product (Biopesticides, Biostimulants, Genetically Modified Seeds), Application (Crop, Food & Vegetables) - Global Forecast 2024-2030 |
||||||
※ 本網頁內容可能與最新版本有所差異。詳細情況請與我們聯繫。
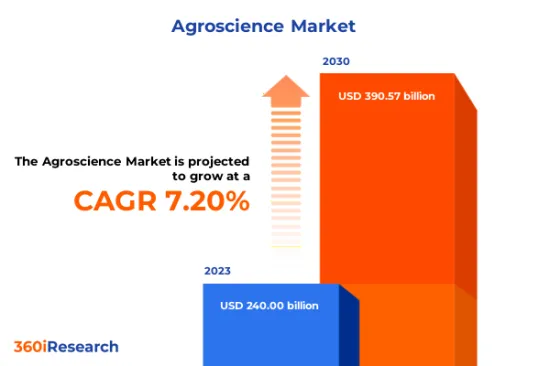
預計2023年農業科學市場規模將達2,400億美元,預計2024年將達2,566.1億美元,2030年將達3,905.7億美元,複合年成長率為7.20%。
全球農業科學市場
| 主要市場統計 | |
|---|---|
| 基準年[2023] | 2400億美元 |
| 預測年份 [2024] | 2566.1億美元 |
| 預測年份 [2030] | 3905.7億美元 |
| 複合年成長率(%) | 7.20% |
農業科學包括基因工程、生物技術、環境科學、作物保護、植物育種、土壤科學和精密農業等各領域的科學和創新技術的開發和使用。 AgroScience 的產品透過提高生產力、最佳化資源利用、減少環境影響以及應對人口成長和氣候變遷的挑戰來幫助確保糧食安全。由於人口成長、耕地面積減少以及提高產量的需要,全球糧食需求不斷增加,從而增加了農業科學產品的使用。氣候變遷對農業生產力的影響越來越大,以及精密農業中的巨量資料分析和物聯網設備等技術的不斷進步,正在推動農業科學市場的成長。政府透過研發投資促進永續農業實踐的措施正在擴大市場範圍。小規模農戶先進農業技術的高成本、社會對基因改造作物(GMO)的抵制以及農業記錄數位化引起的資料隱私和安全問題正在阻礙市場成長。擴大採用生物資訊學工具來支持作物改良和環境友善生物農藥的基因組學和育種技術,預計將創造市場成長機會。
區域洞察
美國農業科學市場的特點是大規模農業經營,優先考慮效率、產量最大化和永續實踐。該地區的農民嚴重依賴先進技術,如精密農業工具、基因改造種子和資料主導決策的數位平台。廣闊的農業用地以及政府持續積極努力提高作物生產力和滿足客戶需求正在推動美洲農業科學市場的發展。包括中國、印度、印尼、孟加拉、日本等在內的亞太國家,由於人口眾多、適合農業的土地比例較高,對農業和食品的需求正在快速成長。由於亞太地區農業用地比例較高,因此對農科產品的需求很高,以提高農產品的生產力。歐洲地區的農業生態學環境多種多樣,有利於多種作物的生產,但也面臨不同的植物檢疫挑戰。歐洲不可預測的氣候變遷正在改變威脅組合,增加了害蟲在全部區域傳播的風險,並推動了歐洲、中東和非洲地區對農業科學產品的需求。
FPNV定位矩陣
FPNV 定位矩陣對於評估農業科學市場至關重要。我們檢視與業務策略和產品滿意度相關的關鍵指標,以對供應商進行全面評估。這種深入的分析使用戶能夠根據自己的要求做出明智的決策。根據評估,供應商被分為四個成功程度不同的像限:前沿(F)、探路者(P)、利基(N)和重要(V)。
市場佔有率分析
市場佔有率分析是一種綜合工具,可以對農業科學市場中供應商的現狀進行深入而詳細的研究。全面比較和分析供應商在整體收益、基本客群和其他關鍵指標方面的貢獻,以便更好地了解公司的績效及其在爭奪市場佔有率時面臨的挑戰。此外,該分析還提供了對該行業競爭特徵的寶貴見解,包括在研究基準年觀察到的累積、分散主導地位和合併特徵等因素。這種詳細程度的提高使供應商能夠做出更明智的決策並制定有效的策略,從而在市場上獲得競爭優勢。
該報告對以下幾個方面提供了寶貴的見解:
1-市場滲透率:提供有關主要企業所服務的市場的全面資訊。
2-市場開拓:我們深入研究利潤豐厚的新興市場並分析其在成熟細分市場的滲透率。
3- 市場多元化:提供有關新產品發布、開拓地區、最新發展和投資的詳細資訊。
4-競爭力評估與資訊:對主要企業的市場佔有率、策略、產品、認證、監管狀況、專利狀況、製造能力等進行全面評估。
5- 產品開發與創新:提供對未來技術、研發活動和突破性產品開發的見解。
本報告解決了以下關鍵問題:
1-農業科學市場的市場規模和預測是多少?
2-農業科學市場預測期內需要考慮投資的產品、細分市場、應用和領域有哪些?
3-農業科學市場的技術趨勢和法律規範是什麼?
4-農業科學市場主要供應商的市場佔有率是多少?
5-進入農業科學市場合適的型態和策略手段是什麼?
目錄
第1章 前言
第2章調查方法
第3章執行摘要
第4章市場概況
第5章市場洞察
- 市場動態
- 促進因素
- 全球人口成長導致全球糧食需求增加
- 政府透過研發投資促進永續農業實踐的努力
- 氣候變遷對農業生產力的影響日益增加
- 抑制因素
- 農場記錄/農業資訊系統數位化的資料隱私和安全問題
- 機會
- 擴大環保生物農藥/生肥的開發,減少對合成化學品的依賴
- 垂直農業系統和受控環境農業 (CEA) 技術的進一步整合
- 任務
- 社會對基因改造生物(GMO)的抵制
- 促進因素
- 市場區隔分析
- 產品:隨著氣候變遷的進展,擴大生物農藥和生物刺激劑的使用
- 應用:用於作物保護的農業科學產品的使用迅速增加
- 市場趨勢分析
- 高通膨的累積效應
- 波特五力分析
- 價值鍊和關鍵路徑分析
- 法律規範
第6章農業科學市場:依產品
- 生物農藥
- 生物刺激劑
- 基因改造種子
第7章農業科學市場:依應用分類
- 作物
- 食品和蔬菜
第8章美洲農業科學市場
- 阿根廷
- 巴西
- 加拿大
- 墨西哥
- 美國
第9章亞太地區農業科學市場
- 澳洲
- 中國
- 印度
- 印尼
- 日本
- 馬來西亞
- 菲律賓
- 新加坡
- 韓國
- 台灣
- 泰國
- 越南
第10章歐洲、中東和非洲農業科學市場
- 丹麥
- 埃及
- 芬蘭
- 法國
- 德國
- 以色列
- 義大利
- 荷蘭
- 奈及利亞
- 挪威
- 波蘭
- 卡達
- 俄羅斯
- 沙烏地阿拉伯
- 南非
- 西班牙
- 瑞典
- 瑞士
- 土耳其
- 阿拉伯聯合大公國
- 英國
第11章競爭形勢
- FPNV定位矩陣
- 市場佔有率分析:主要企業
- 主要企業競爭情境分析
- 併購
- 獎項/獎勵/擴展
第12章競爭產品組合
- 主要公司簡介
- Adama Ltd.
- American Vanguard Corporation
- Bayer AG
- Biobest Group
- Bioline AgroSciences Ltd.
- Coromandel International Limited
- DuPont de Nemours, Inc.
- Euro Agro Science
- Eurofins Scientific SE
- FMC Corporation
- Godrej Agrovet Limited
- Jain Irrigation Systems Ltd.
- Kaveri Seed Company Ltd
- Koppert Biological Systems Inc.
- llumina Inc.
- Mitsumi Agriscience Pvt. Ltd.
- Nissan Chemical Corporation
- Novozymes A/S
- Nutrien Ltd.
- Oasis Agroscience Limited
- Sigma Agriscience, LLC
- Syngenta Crop Protection AG by China National Chemical Corporation
- TeselaGen Biotechnology Inc.
- UPL Limited
- VARO Energy
- 主要產品系列
第13章附錄
- 討論指南
- 關於許可證和定價
[189 Pages Report] The Agroscience Market size was estimated at USD 240.00 billion in 2023 and expected to reach USD 256.61 billion in 2024, at a CAGR 7.20% to reach USD 390.57 billion by 2030.
Global Agroscience Market
| KEY MARKET STATISTICS | |
|---|---|
| Base Year [2023] | USD 240.00 billion |
| Estimated Year [2024] | USD 256.61 billion |
| Forecast Year [2030] | USD 390.57 billion |
| CAGR (%) | 7.20% |
Agroscience includes developing and utilizing scientific and innovative techniques in various fields, such as genetic engineering, biotechnology, environmental science, crop protection, plant breeding, soil science, and precision agriculture. Agroscience products help enhance productivity, optimize resource utilization, reduce environmental impacts, and ensure food security by addressing population growth and climate change challenges. Increasing global food demand due to population growth, shrinking arable land coupled with the need for higher yield rates is increasing the usage of agriscience products. Rising climate change implications on agricultural productivity and continuous technological advancements, including big data analytics and IoT devices in precision farming, drive the agroscience market growth. The availability of government initiatives promoting sustainable agriculture practices through R&D investments is expanding the scope of the market. The high cost of advanced agricultural technologies for smallholder farmers, social resistance towards genetically modified organisms (GMOs), and data privacy & security concerns arising from the digitalization of farm records are hampering the market growth. The rising introduction of bioinformatics tools supporting genomics and breeding technologies for crop improvement and eco-friendly biopesticides is expected to create opportunities for market growth.
Regional Insights
The American market for agroscience is characterized by large-scale farming operations that prioritize efficiency, yield maximization, and sustainable practices. Farmers in the region rely heavily on advanced technologies such as precision agriculture tools, genetically modified seeds, and digital platforms for data-driven decision-making. The presence of substantial agricultural land areas with ongoing favorable government initiatives to improve crop productivity and meet the customers' demand encourages the agroscience market in the Americas. The countries in the Asia-Pacific, including China, India, Indonesia, Bangladesh, Japan, and others, have soaring demand for agriculture and food products due to the high population and contain a large percentage of land suitable for agriculture. The existence of a high percentage of agricultural land in Asia-Pacific creates considerable demand for agroscience products to enhance the productivity of the agricultural output. The European region spans a vast diversity of agroecological environments that ease the production of diverse crops; however, it is accompanied by various plant health challenges. The unpredictable climate change in Europe results in shifts in the composition of threats and enhanced risks of spreading pests across the region, subsequently driving the demand for agroscience products in EMEA.
FPNV Positioning Matrix
The FPNV Positioning Matrix is pivotal in evaluating the Agroscience Market. It offers a comprehensive assessment of vendors, examining key metrics related to Business Strategy and Product Satisfaction. This in-depth analysis empowers users to make well-informed decisions aligned with their requirements. Based on the evaluation, the vendors are then categorized into four distinct quadrants representing varying levels of success: Forefront (F), Pathfinder (P), Niche (N), or Vital (V).
Market Share Analysis
The Market Share Analysis is a comprehensive tool that provides an insightful and in-depth examination of the current state of vendors in the Agroscience Market. By meticulously comparing and analyzing vendor contributions in terms of overall revenue, customer base, and other key metrics, we can offer companies a greater understanding of their performance and the challenges they face when competing for market share. Additionally, this analysis provides valuable insights into the competitive nature of the sector, including factors such as accumulation, fragmentation dominance, and amalgamation traits observed over the base year period studied. With this expanded level of detail, vendors can make more informed decisions and devise effective strategies to gain a competitive edge in the market.
Key Company Profiles
The report delves into recent significant developments in the Agroscience Market, highlighting leading vendors and their innovative profiles. These include Adama Ltd., American Vanguard Corporation, Bayer AG, Biobest Group, Bioline AgroSciences Ltd., Coromandel International Limited, DuPont de Nemours, Inc., Euro Agro Science, Eurofins Scientific SE, FMC Corporation, Godrej Agrovet Limited, Jain Irrigation Systems Ltd., Kaveri Seed Company Ltd, Koppert Biological Systems Inc., llumina Inc., Mitsumi Agriscience Pvt. Ltd., Nissan Chemical Corporation, Novozymes A/S, Nutrien Ltd., Oasis Agroscience Limited, Sigma Agriscience, LLC, Syngenta Crop Protection AG by China National Chemical Corporation, TeselaGen Biotechnology Inc., UPL Limited, and VARO Energy.
Market Segmentation & Coverage
This research report categorizes the Agroscience Market to forecast the revenues and analyze trends in each of the following sub-markets:
- Product
- Biopesticides
- Biostimulants
- Genetically Modified Seeds
- Application
- Crop
- Food & Vegetables
- Region
- Americas
- Argentina
- Brazil
- Canada
- Mexico
- United States
- California
- Florida
- Illinois
- New York
- Ohio
- Pennsylvania
- Texas
- Asia-Pacific
- Australia
- China
- India
- Indonesia
- Japan
- Malaysia
- Philippines
- Singapore
- South Korea
- Taiwan
- Thailand
- Vietnam
- Europe, Middle East & Africa
- Denmark
- Egypt
- Finland
- France
- Germany
- Israel
- Italy
- Netherlands
- Nigeria
- Norway
- Poland
- Qatar
- Russia
- Saudi Arabia
- South Africa
- Spain
- Sweden
- Switzerland
- Turkey
- United Arab Emirates
- United Kingdom
- Americas
The report offers valuable insights on the following aspects:
1. Market Penetration: It presents comprehensive information on the market provided by key players.
2. Market Development: It delves deep into lucrative emerging markets and analyzes the penetration across mature market segments.
3. Market Diversification: It provides detailed information on new product launches, untapped geographic regions, recent developments, and investments.
4. Competitive Assessment & Intelligence: It conducts an exhaustive assessment of market shares, strategies, products, certifications, regulatory approvals, patent landscape, and manufacturing capabilities of the leading players.
5. Product Development & Innovation: It offers intelligent insights on future technologies, R&D activities, and breakthrough product developments.
The report addresses key questions such as:
1. What is the market size and forecast of the Agroscience Market?
2. Which products, segments, applications, and areas should one consider investing in over the forecast period in the Agroscience Market?
3. What are the technology trends and regulatory frameworks in the Agroscience Market?
4. What is the market share of the leading vendors in the Agroscience Market?
5. Which modes and strategic moves are suitable for entering the Agroscience Market?
Table of Contents
1. Preface
- 1.1. Objectives of the Study
- 1.2. Market Segmentation & Coverage
- 1.3. Years Considered for the Study
- 1.4. Currency & Pricing
- 1.5. Language
- 1.6. Limitations
- 1.7. Assumptions
- 1.8. Stakeholders
2. Research Methodology
- 2.1. Define: Research Objective
- 2.2. Determine: Research Design
- 2.3. Prepare: Research Instrument
- 2.4. Collect: Data Source
- 2.5. Analyze: Data Interpretation
- 2.6. Formulate: Data Verification
- 2.7. Publish: Research Report
- 2.8. Repeat: Report Update
3. Executive Summary
4. Market Overview
- 4.1. Introduction
- 4.2. Agroscience Market, by Region
5. Market Insights
- 5.1. Market Dynamics
- 5.1.1. Drivers
- 5.1.1.1. Rising global demand for food due to an increasing population globally
- 5.1.1.2. Government initiatives promoting sustainable agriculture practices through R&D investments
- 5.1.1.3. Growing climate change implications on agricultural productivity
- 5.1.2. Restraints
- 5.1.2.1. Data privacy & security concerns arising from digitalization of farm records/agricultural information systems
- 5.1.3. Opportunities
- 5.1.3.1. Growing development of eco-friendly biopesticides/biofertilizers to reduce dependency on synthetic chemicals
- 5.1.3.2. Rising integration of vertical farming systems and controlled environment agriculture (CEA) technologies
- 5.1.4. Challenges
- 5.1.4.1. Social resistance towards genetically modified organisms (GMOs)
- 5.1.1. Drivers
- 5.2. Market Segmentation Analysis
- 5.2.1. Product: Expanding the usage of biopesticides and biostimulants with growing climate changes
- 5.2.2. Application: Proliferating usage of agroscience products for crop protection
- 5.3. Market Trend Analysis
- 5.4. Cumulative Impact of High Inflation
- 5.5. Porter's Five Forces Analysis
- 5.5.1. Threat of New Entrants
- 5.5.2. Threat of Substitutes
- 5.5.3. Bargaining Power of Customers
- 5.5.4. Bargaining Power of Suppliers
- 5.5.5. Industry Rivalry
- 5.6. Value Chain & Critical Path Analysis
- 5.7. Regulatory Framework
6. Agroscience Market, by Product
- 6.1. Introduction
- 6.2. Biopesticides
- 6.3. Biostimulants
- 6.4. Genetically Modified Seeds
7. Agroscience Market, by Application
- 7.1. Introduction
- 7.2. Crop
- 7.3. Food & Vegetables
8. Americas Agroscience Market
- 8.1. Introduction
- 8.2. Argentina
- 8.3. Brazil
- 8.4. Canada
- 8.5. Mexico
- 8.6. United States
9. Asia-Pacific Agroscience Market
- 9.1. Introduction
- 9.2. Australia
- 9.3. China
- 9.4. India
- 9.5. Indonesia
- 9.6. Japan
- 9.7. Malaysia
- 9.8. Philippines
- 9.9. Singapore
- 9.10. South Korea
- 9.11. Taiwan
- 9.12. Thailand
- 9.13. Vietnam
10. Europe, Middle East & Africa Agroscience Market
- 10.1. Introduction
- 10.2. Denmark
- 10.3. Egypt
- 10.4. Finland
- 10.5. France
- 10.6. Germany
- 10.7. Israel
- 10.8. Italy
- 10.9. Netherlands
- 10.10. Nigeria
- 10.11. Norway
- 10.12. Poland
- 10.13. Qatar
- 10.14. Russia
- 10.15. Saudi Arabia
- 10.16. South Africa
- 10.17. Spain
- 10.18. Sweden
- 10.19. Switzerland
- 10.20. Turkey
- 10.21. United Arab Emirates
- 10.22. United Kingdom
11. Competitive Landscape
- 11.1. FPNV Positioning Matrix
- 11.2. Market Share Analysis, By Key Player
- 11.3. Competitive Scenario Analysis, By Key Player
- 11.3.1. Merger & Acquisition
- 11.3.1.1. VARO increases stake in agro-science leader SilviCarbon and announces issuance of high-quality carbon removal credits to customers
- 11.3.1.2. Corteva Agriscience Completes Acquisitions of Symborg and Stoller
- 11.3.2. Award, Recognition, & Expansion
- 11.3.2.1. Illumina expands genomics capabilities in India with opening of Solutions Center
- 11.3.1. Merger & Acquisition
12. Competitive Portfolio
- 12.1. Key Company Profiles
- 12.1.1. Adama Ltd.
- 12.1.2. American Vanguard Corporation
- 12.1.3. Bayer AG
- 12.1.4. Biobest Group
- 12.1.5. Bioline AgroSciences Ltd.
- 12.1.6. Coromandel International Limited
- 12.1.7. DuPont de Nemours, Inc.
- 12.1.8. Euro Agro Science
- 12.1.9. Eurofins Scientific SE
- 12.1.10. FMC Corporation
- 12.1.11. Godrej Agrovet Limited
- 12.1.12. Jain Irrigation Systems Ltd.
- 12.1.13. Kaveri Seed Company Ltd
- 12.1.14. Koppert Biological Systems Inc.
- 12.1.15. llumina Inc.
- 12.1.16. Mitsumi Agriscience Pvt. Ltd.
- 12.1.17. Nissan Chemical Corporation
- 12.1.18. Novozymes A/S
- 12.1.19. Nutrien Ltd.
- 12.1.20. Oasis Agroscience Limited
- 12.1.21. Sigma Agriscience, LLC
- 12.1.22. Syngenta Crop Protection AG by China National Chemical Corporation
- 12.1.23. TeselaGen Biotechnology Inc.
- 12.1.24. UPL Limited
- 12.1.25. VARO Energy
- 12.2. Key Product Portfolio
13. Appendix
- 13.1. Discussion Guide
- 13.2. License & Pricing
LIST OF FIGURES
- FIGURE 1. AGROSCIENCE MARKET RESEARCH PROCESS
- FIGURE 2. AGROSCIENCE MARKET SIZE, 2023 VS 2030
- FIGURE 3. AGROSCIENCE MARKET SIZE, 2018-2030 (USD MILLION)
- FIGURE 4. AGROSCIENCE MARKET SIZE, BY REGION, 2023 VS 2030 (%)
- FIGURE 5. AGROSCIENCE MARKET SIZE, BY REGION, 2023 VS 2024 VS 2030 (USD MILLION)
- FIGURE 6. AGROSCIENCE MARKET DYNAMICS
- FIGURE 7. AGROSCIENCE MARKET SIZE, BY PRODUCT, 2023 VS 2030 (%)
- FIGURE 8. AGROSCIENCE MARKET SIZE, BY PRODUCT, 2023 VS 2024 VS 2030 (USD MILLION)
- FIGURE 9. AGROSCIENCE MARKET SIZE, BY APPLICATION, 2023 VS 2030 (%)
- FIGURE 10. AGROSCIENCE MARKET SIZE, BY APPLICATION, 2023 VS 2024 VS 2030 (USD MILLION)
- FIGURE 11. AMERICAS AGROSCIENCE MARKET SIZE, BY COUNTRY, 2023 VS 2030 (%)
- FIGURE 12. AMERICAS AGROSCIENCE MARKET SIZE, BY COUNTRY, 2023 VS 2024 VS 2030 (USD MILLION)
- FIGURE 13. UNITED STATES AGROSCIENCE MARKET SIZE, BY STATE, 2023 VS 2030 (%)
- FIGURE 14. UNITED STATES AGROSCIENCE MARKET SIZE, BY STATE, 2023 VS 2024 VS 2030 (USD MILLION)
- FIGURE 15. ASIA-PACIFIC AGROSCIENCE MARKET SIZE, BY COUNTRY, 2023 VS 2030 (%)
- FIGURE 16. ASIA-PACIFIC AGROSCIENCE MARKET SIZE, BY COUNTRY, 2023 VS 2024 VS 2030 (USD MILLION)
- FIGURE 17. EUROPE, MIDDLE EAST & AFRICA AGROSCIENCE MARKET SIZE, BY COUNTRY, 2023 VS 2030 (%)
- FIGURE 18. EUROPE, MIDDLE EAST & AFRICA AGROSCIENCE MARKET SIZE, BY COUNTRY, 2023 VS 2024 VS 2030 (USD MILLION)
- FIGURE 19. AGROSCIENCE MARKET, FPNV POSITIONING MATRIX, 2023
- FIGURE 20. AGROSCIENCE MARKET SHARE, BY KEY PLAYER, 2023
LIST OF TABLES
- TABLE 1. AGROSCIENCE MARKET SEGMENTATION & COVERAGE
- TABLE 2. UNITED STATES DOLLAR EXCHANGE RATE, 2018-2023
- TABLE 3. AGROSCIENCE MARKET SIZE, 2018-2030 (USD MILLION)
- TABLE 4. GLOBAL AGROSCIENCE MARKET SIZE, BY REGION, 2018-2030 (USD MILLION)
- TABLE 5. AGROSCIENCE MARKET SIZE, BY PRODUCT, 2018-2030 (USD MILLION)
- TABLE 6. AGROSCIENCE MARKET SIZE, BY BIOPESTICIDES, BY REGION, 2018-2030 (USD MILLION)
- TABLE 7. AGROSCIENCE MARKET SIZE, BY BIOSTIMULANTS, BY REGION, 2018-2030 (USD MILLION)
- TABLE 8. AGROSCIENCE MARKET SIZE, BY GENETICALLY MODIFIED SEEDS, BY REGION, 2018-2030 (USD MILLION)
- TABLE 9. AGROSCIENCE MARKET SIZE, BY APPLICATION, 2018-2030 (USD MILLION)
- TABLE 10. AGROSCIENCE MARKET SIZE, BY CROP, BY REGION, 2018-2030 (USD MILLION)
- TABLE 11. AGROSCIENCE MARKET SIZE, BY FOOD & VEGETABLES, BY REGION, 2018-2030 (USD MILLION)
- TABLE 12. AMERICAS AGROSCIENCE MARKET SIZE, BY PRODUCT, 2018-2030 (USD MILLION)
- TABLE 13. AMERICAS AGROSCIENCE MARKET SIZE, BY APPLICATION, 2018-2030 (USD MILLION)
- TABLE 14. AMERICAS AGROSCIENCE MARKET SIZE, BY COUNTRY, 2018-2030 (USD MILLION)
- TABLE 15. ARGENTINA AGROSCIENCE MARKET SIZE, BY PRODUCT, 2018-2030 (USD MILLION)
- TABLE 16. ARGENTINA AGROSCIENCE MARKET SIZE, BY APPLICATION, 2018-2030 (USD MILLION)
- TABLE 17. BRAZIL AGROSCIENCE MARKET SIZE, BY PRODUCT, 2018-2030 (USD MILLION)
- TABLE 18. BRAZIL AGROSCIENCE MARKET SIZE, BY APPLICATION, 2018-2030 (USD MILLION)
- TABLE 19. CANADA AGROSCIENCE MARKET SIZE, BY PRODUCT, 2018-2030 (USD MILLION)
- TABLE 20. CANADA AGROSCIENCE MARKET SIZE, BY APPLICATION, 2018-2030 (USD MILLION)
- TABLE 21. MEXICO AGROSCIENCE MARKET SIZE, BY PRODUCT, 2018-2030 (USD MILLION)
- TABLE 22. MEXICO AGROSCIENCE MARKET SIZE, BY APPLICATION, 2018-2030 (USD MILLION)
- TABLE 23. UNITED STATES AGROSCIENCE MARKET SIZE, BY PRODUCT, 2018-2030 (USD MILLION)
- TABLE 24. UNITED STATES AGROSCIENCE MARKET SIZE, BY APPLICATION, 2018-2030 (USD MILLION)
- TABLE 25. UNITED STATES AGROSCIENCE MARKET SIZE, BY STATE, 2018-2030 (USD MILLION)
- TABLE 26. ASIA-PACIFIC AGROSCIENCE MARKET SIZE, BY PRODUCT, 2018-2030 (USD MILLION)
- TABLE 27. ASIA-PACIFIC AGROSCIENCE MARKET SIZE, BY APPLICATION, 2018-2030 (USD MILLION)
- TABLE 28. ASIA-PACIFIC AGROSCIENCE MARKET SIZE, BY COUNTRY, 2018-2030 (USD MILLION)
- TABLE 29. AUSTRALIA AGROSCIENCE MARKET SIZE, BY PRODUCT, 2018-2030 (USD MILLION)
- TABLE 30. AUSTRALIA AGROSCIENCE MARKET SIZE, BY APPLICATION, 2018-2030 (USD MILLION)
- TABLE 31. CHINA AGROSCIENCE MARKET SIZE, BY PRODUCT, 2018-2030 (USD MILLION)
- TABLE 32. CHINA AGROSCIENCE MARKET SIZE, BY APPLICATION, 2018-2030 (USD MILLION)
- TABLE 33. INDIA AGROSCIENCE MARKET SIZE, BY PRODUCT, 2018-2030 (USD MILLION)
- TABLE 34. INDIA AGROSCIENCE MARKET SIZE, BY APPLICATION, 2018-2030 (USD MILLION)
- TABLE 35. INDONESIA AGROSCIENCE MARKET SIZE, BY PRODUCT, 2018-2030 (USD MILLION)
- TABLE 36. INDONESIA AGROSCIENCE MARKET SIZE, BY APPLICATION, 2018-2030 (USD MILLION)
- TABLE 37. JAPAN AGROSCIENCE MARKET SIZE, BY PRODUCT, 2018-2030 (USD MILLION)
- TABLE 38. JAPAN AGROSCIENCE MARKET SIZE, BY APPLICATION, 2018-2030 (USD MILLION)
- TABLE 39. MALAYSIA AGROSCIENCE MARKET SIZE, BY PRODUCT, 2018-2030 (USD MILLION)
- TABLE 40. MALAYSIA AGROSCIENCE MARKET SIZE, BY APPLICATION, 2018-2030 (USD MILLION)
- TABLE 41. PHILIPPINES AGROSCIENCE MARKET SIZE, BY PRODUCT, 2018-2030 (USD MILLION)
- TABLE 42. PHILIPPINES AGROSCIENCE MARKET SIZE, BY APPLICATION, 2018-2030 (USD MILLION)
- TABLE 43. SINGAPORE AGROSCIENCE MARKET SIZE, BY PRODUCT, 2018-2030 (USD MILLION)
- TABLE 44. SINGAPORE AGROSCIENCE MARKET SIZE, BY APPLICATION, 2018-2030 (USD MILLION)
- TABLE 45. SOUTH KOREA AGROSCIENCE MARKET SIZE, BY PRODUCT, 2018-2030 (USD MILLION)
- TABLE 46. SOUTH KOREA AGROSCIENCE MARKET SIZE, BY APPLICATION, 2018-2030 (USD MILLION)
- TABLE 47. TAIWAN AGROSCIENCE MARKET SIZE, BY PRODUCT, 2018-2030 (USD MILLION)
- TABLE 48. TAIWAN AGROSCIENCE MARKET SIZE, BY APPLICATION, 2018-2030 (USD MILLION)
- TABLE 49. THAILAND AGROSCIENCE MARKET SIZE, BY PRODUCT, 2018-2030 (USD MILLION)
- TABLE 50. THAILAND AGROSCIENCE MARKET SIZE, BY APPLICATION, 2018-2030 (USD MILLION)
- TABLE 51. VIETNAM AGROSCIENCE MARKET SIZE, BY PRODUCT, 2018-2030 (USD MILLION)
- TABLE 52. VIETNAM AGROSCIENCE MARKET SIZE, BY APPLICATION, 2018-2030 (USD MILLION)
- TABLE 53. EUROPE, MIDDLE EAST & AFRICA AGROSCIENCE MARKET SIZE, BY PRODUCT, 2018-2030 (USD MILLION)
- TABLE 54. EUROPE, MIDDLE EAST & AFRICA AGROSCIENCE MARKET SIZE, BY APPLICATION, 2018-2030 (USD MILLION)
- TABLE 55. EUROPE, MIDDLE EAST & AFRICA AGROSCIENCE MARKET SIZE, BY COUNTRY, 2018-2030 (USD MILLION)
- TABLE 56. DENMARK AGROSCIENCE MARKET SIZE, BY PRODUCT, 2018-2030 (USD MILLION)
- TABLE 57. DENMARK AGROSCIENCE MARKET SIZE, BY APPLICATION, 2018-2030 (USD MILLION)
- TABLE 58. EGYPT AGROSCIENCE MARKET SIZE, BY PRODUCT, 2018-2030 (USD MILLION)
- TABLE 59. EGYPT AGROSCIENCE MARKET SIZE, BY APPLICATION, 2018-2030 (USD MILLION)
- TABLE 60. FINLAND AGROSCIENCE MARKET SIZE, BY PRODUCT, 2018-2030 (USD MILLION)
- TABLE 61. FINLAND AGROSCIENCE MARKET SIZE, BY APPLICATION, 2018-2030 (USD MILLION)
- TABLE 62. FRANCE AGROSCIENCE MARKET SIZE, BY PRODUCT, 2018-2030 (USD MILLION)
- TABLE 63. FRANCE AGROSCIENCE MARKET SIZE, BY APPLICATION, 2018-2030 (USD MILLION)
- TABLE 64. GERMANY AGROSCIENCE MARKET SIZE, BY PRODUCT, 2018-2030 (USD MILLION)
- TABLE 65. GERMANY AGROSCIENCE MARKET SIZE, BY APPLICATION, 2018-2030 (USD MILLION)
- TABLE 66. ISRAEL AGROSCIENCE MARKET SIZE, BY PRODUCT, 2018-2030 (USD MILLION)
- TABLE 67. ISRAEL AGROSCIENCE MARKET SIZE, BY APPLICATION, 2018-2030 (USD MILLION)
- TABLE 68. ITALY AGROSCIENCE MARKET SIZE, BY PRODUCT, 2018-2030 (USD MILLION)
- TABLE 69. ITALY AGROSCIENCE MARKET SIZE, BY APPLICATION, 2018-2030 (USD MILLION)
- TABLE 70. NETHERLANDS AGROSCIENCE MARKET SIZE, BY PRODUCT, 2018-2030 (USD MILLION)
- TABLE 71. NETHERLANDS AGROSCIENCE MARKET SIZE, BY APPLICATION, 2018-2030 (USD MILLION)
- TABLE 72. NIGERIA AGROSCIENCE MARKET SIZE, BY PRODUCT, 2018-2030 (USD MILLION)
- TABLE 73. NIGERIA AGROSCIENCE MARKET SIZE, BY APPLICATION, 2018-2030 (USD MILLION)
- TABLE 74. NORWAY AGROSCIENCE MARKET SIZE, BY PRODUCT, 2018-2030 (USD MILLION)
- TABLE 75. NORWAY AGROSCIENCE MARKET SIZE, BY APPLICATION, 2018-2030 (USD MILLION)
- TABLE 76. POLAND AGROSCIENCE MARKET SIZE, BY PRODUCT, 2018-2030 (USD MILLION)
- TABLE 77. POLAND AGROSCIENCE MARKET SIZE, BY APPLICATION, 2018-2030 (USD MILLION)
- TABLE 78. QATAR AGROSCIENCE MARKET SIZE, BY PRODUCT, 2018-2030 (USD MILLION)
- TABLE 79. QATAR AGROSCIENCE MARKET SIZE, BY APPLICATION, 2018-2030 (USD MILLION)
- TABLE 80. RUSSIA AGROSCIENCE MARKET SIZE, BY PRODUCT, 2018-2030 (USD MILLION)
- TABLE 81. RUSSIA AGROSCIENCE MARKET SIZE, BY APPLICATION, 2018-2030 (USD MILLION)
- TABLE 82. SAUDI ARABIA AGROSCIENCE MARKET SIZE, BY PRODUCT, 2018-2030 (USD MILLION)
- TABLE 83. SAUDI ARABIA AGROSCIENCE MARKET SIZE, BY APPLICATION, 2018-2030 (USD MILLION)
- TABLE 84. SOUTH AFRICA AGROSCIENCE MARKET SIZE, BY PRODUCT, 2018-2030 (USD MILLION)
- TABLE 85. SOUTH AFRICA AGROSCIENCE MARKET SIZE, BY APPLICATION, 2018-2030 (USD MILLION)
- TABLE 86. SPAIN AGROSCIENCE MARKET SIZE, BY PRODUCT, 2018-2030 (USD MILLION)
- TABLE 87. SPAIN AGROSCIENCE MARKET SIZE, BY APPLICATION, 2018-2030 (USD MILLION)
- TABLE 88. SWEDEN AGROSCIENCE MARKET SIZE, BY PRODUCT, 2018-2030 (USD MILLION)
- TABLE 89. SWEDEN AGROSCIENCE MARKET SIZE, BY APPLICATION, 2018-2030 (USD MILLION)
- TABLE 90. SWITZERLAND AGROSCIENCE MARKET SIZE, BY PRODUCT, 2018-2030 (USD MILLION)
- TABLE 91. SWITZERLAND AGROSCIENCE MARKET SIZE, BY APPLICATION, 2018-2030 (USD MILLION)
- TABLE 92. TURKEY AGROSCIENCE MARKET SIZE, BY PRODUCT, 2018-2030 (USD MILLION)
- TABLE 93. TURKEY AGROSCIENCE MARKET SIZE, BY APPLICATION, 2018-2030 (USD MILLION)
- TABLE 94. UNITED ARAB EMIRATES AGROSCIENCE MARKET SIZE, BY PRODUCT, 2018-2030 (USD MILLION)
- TABLE 95. UNITED ARAB EMIRATES AGROSCIENCE MARKET SIZE, BY APPLICATION, 2018-2030 (USD MILLION)
- TABLE 96. UNITED KINGDOM AGROSCIENCE MARKET SIZE, BY PRODUCT, 2018-2030 (USD MILLION)
- TABLE 97. UNITED KINGDOM AGROSCIENCE MARKET SIZE, BY APPLICATION, 2018-2030 (USD MILLION)
- TABLE 98. AGROSCIENCE MARKET, FPNV POSITIONING MATRIX, 2023
- TABLE 99. AGROSCIENCE MARKET SHARE, BY KEY PLAYER, 2023
- TABLE 100. AGROSCIENCE MARKET LICENSE & PRICING
 農業助劑市場:依功能、配方、化學組、作物、應用分類 - 2024-2030 年全球預測
 農業科學市場 - 全球產業規模、佔有率、趨勢、機會和預測,按產品類型(基因改造種子、生物農藥、生物刺激劑)、最終用戶、地區和競爭細分,2019-2029F
 2024-2032 年按產品(基因改造 (GM) 種子、生物農藥、生物刺激劑)和地區分類的農業科學市場報告
 2024 年農業助劑全球市場報告
 農業助劑:市場佔有率分析、產業趨勢與統計、成長預測(2024-2029)
 農用助劑市場-2024年至2029年預測
 全球農業助劑的成長機會
 農業助劑市場報告(按類型(活化助劑、實用助劑)、作物類型(穀物和油籽、水果和蔬菜等)、應用(除草劑、殺菌劑、殺蟲劑等)和地區 2024-2032
 農業科學全球市場報告 2024年
 農業用化學品的中國市場