


 |
市場調查報告書
商品編碼
1434364
探險旅遊市場:按類型、活動、通路分類 - 全球預測 2023-2030Adventure Tourism Market by Type (Hard, Soft), Activity (Air-based Activity, Land-based Activity, Water-based Activity), Distribution Channel - Global Forecast 2023-2030 |
||||||
※ 本網頁內容可能與最新版本有所差異。詳細情況請與我們聯繫。
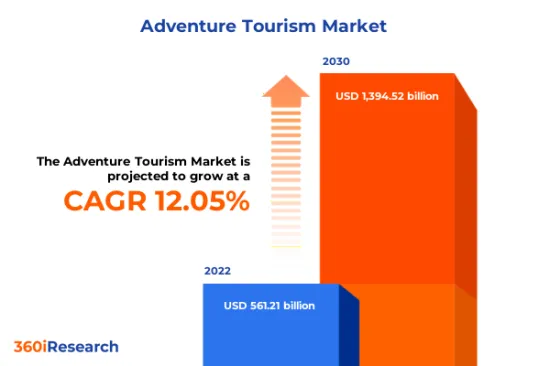
預計2022年探險旅遊市場規模為5,612.1億美元,預估2023年將達6,098.9億美元,2030年將達13.9452億美元,複合年成長率為12.05%。
全球探險旅遊市場
| 主要市場統計 | |
|---|---|
| 基準年[2022] | 5612.1億美元 |
| 預測年份 [2023] | 6098.9億美元 |
| 預測年份 [2030] | 1,394,520 百萬美元 |
| 複合年成長率(%) | 12.05% |
探險旅遊是探索和旅行到偏遠和異國風的目的地,並要求旅行者期待意想不到的事情。冒險旅遊越來越受到尋求不同於典型海灘度假的度假方式的旅客的歡迎。探險旅遊還包括在假期期間參與具有挑戰性的體驗,例如登山、遠足、滑翔傘、蹦極、漂流和攀岩。健身和戶外活動的趨勢,加上全球可支配收入的增加,正在推動探險旅遊市場的成長。然而,不可預測的天氣條件和與探險活動相關的高成本可能會嚴重阻礙探險旅遊市場的成長。此外,政府促進旅遊業的舉措和社交媒體影響力的出現預計將為市場提供成長機會。
區域洞察
在美洲,美國和加拿大是探險旅遊的領導者。從洛磯山脈到大峽谷,多樣化的景觀使這些國家成為冒險家的理想目的地。消費者趨勢青睞永續和負責任的旅行體驗,並強調當地文化和環保做法。對國家公園和保護區的投資以及獨特的當地體驗的開拓正在推動該地區的市場成長。歐洲、中東、非洲形勢多元。歐洲擁有熱門的冒險目的地,包括瑞士阿爾卑斯山的滑雪、地中海的水上運動以及各種健行路線。非洲提供狩獵、登山、乞力馬扎羅和沙漠探險等活動。中東透過沙漠探險、紅海潛水和山地健行等活動吸引冒險家。該地區提供各種冒險活動,可滿足各種興趣和偏好。在亞太地區,中國、日本和印度等國家服務龐大的國內市場和國際遊客。中國經濟的快速成長帶動了出境觀光的成長,中國遊客開始尋求海外探險體驗。日本融合了傳統文化和自然景觀,而印度則以其喜馬拉雅探險和野生動物之旅而聞名。該地區的探險旅遊正在蓬勃發展,人們對健康養生和探險活動相結合的渴望日益成長。
FPNV定位矩陣
FPNV定位矩陣對於評估探險旅遊市場至關重要。我們檢視與業務策略和產品滿意度相關的關鍵指標,以對供應商進行全面評估。這種深入的分析使用戶能夠根據自己的要求做出明智的決策。根據評估,供應商被分為四個成功程度不同的像限:前沿(F)、探路者(P)、利基(N)和重要(V)。
市場佔有率分析
市場佔有率分析是一個綜合工具,可以對冒險旅遊市場供應商的現狀進行深入而深入的研究。全面比較和分析供應商在整體收益、基本客群和其他關鍵指標方面的貢獻,以便更好地了解公司的績效及其在爭奪市場佔有率時面臨的挑戰。此外,該分析還提供了對該行業競爭特徵的寶貴見解,包括在研究基準年觀察到的累積、分散主導地位和合併特徵等因素。這種詳細程度的提高使供應商能夠做出更明智的決策並制定有效的策略,從而在市場上獲得競爭優勢。
該報告對以下幾個方面提供了寶貴的見解:
1-市場滲透率:提供有關主要企業所服務的市場的全面資訊。
2-市場開拓:我們深入研究利潤豐厚的新興市場,並分析它們在成熟細分市場中的滲透率。
3- 市場多元化:提供有關新產品發布、開拓地區、最新發展和投資的詳細資訊。
4-競爭力評估與資訊:對主要企業的市場佔有率、策略、產品、認證、監管狀況、專利狀況、製造能力等進行全面評估。
5- 產品開發與創新:提供對未來技術、研發活動和突破性產品開發的見解。
本報告解決了以下關鍵問題:
1-探險旅遊市場的市場規模和預測是多少?
2-在冒險旅遊市場的預測期內,有哪些產品、細分市場、應用和領域需要考慮投資?
3-探險旅遊市場的技術趨勢和法律規範是什麼?
4-探險旅遊市場主要供應商的市場佔有率是多少?
5-進入探險旅遊市場適合的型態和策略手段是什麼?
目錄
第1章 前言
第2章調查方法
第3章執行摘要
第4章市場概況
第5章市場洞察
- 市場動態
- 促進因素
- 旅遊業和冒險活動呈指數級成長
- 模擬器和虛擬環境可提供更好的消費者體驗
- 政府以官民合作關係形式採取的舉措,以促進旅遊業和改善安全保障
- 抑制因素
- 與不可預測的天氣條件和冒險旅行限制相關的風險;
- 機會
- 人工智慧與社群媒體平台的整合
- 新興國家可支配所得增加
- 行銷策略和領域專業知識
- 任務
- 冒險活動相關的高成本
- 促進因素
- 市場區隔分析
- 類型:喜歡軟探險旅遊,與家人共度美好時光
- 活動: 年輕人越來越傾向於進行空中活動。
- 分銷管道:優先考慮直接預訂,提供更客製化且更具成本效益的體驗
- 市場趨勢分析
- COVID-19 的累積影響
- 俄羅斯-烏克蘭衝突的累積影響
- 高通膨的累積效應
- 波特五力分析
- 價值鍊和關鍵路徑分析
- 法律規範
- 客戶客製化
第6章探險旅遊市場:依類型
- 難的
- 柔軟的
第7章 探險旅遊市場(依活動分類)
- 空中活動
- 陸上活動
- 水上活動
第8章探險旅遊市場:依通路分類
- 直接地
- 旅行社
第9章 美洲探險旅遊市場
- 阿根廷
- 巴西
- 加拿大
- 墨西哥
- 美國
第10章 亞太探險旅遊市場
- 澳洲
- 中國
- 印度
- 印尼
- 日本
- 馬來西亞
- 菲律賓
- 新加坡
- 韓國
- 台灣
- 泰國
- 越南
第11章 歐洲、中東和非洲探險旅遊市場
- 丹麥
- 埃及
- 芬蘭
- 法國
- 德國
- 以色列
- 義大利
- 荷蘭
- 奈及利亞
- 挪威
- 波蘭
- 卡達
- 俄羅斯
- 沙烏地阿拉伯
- 南非
- 西班牙
- 瑞典
- 瑞士
- 土耳其
- 阿拉伯聯合大公國
- 英國
第12章競爭形勢
- FPNV定位矩陣
- 市場佔有率分析:主要企業
- 主要企業競爭情境分析
- 合約、合作和夥伴關係
- 新產品發布和功能增強
- 投資、資金籌措
第13章競爭產品組合
- 主要公司簡介
- Abercrombie & Kent Group of Companies SA
- Austin Adventures, Inc. by Active Adventures
- Butterfield & Robinson Inc.
- Contiki
- Discovery Nomad
- Exodus Travels Limited
- Explore Worldwide Ltd
- G Adventures
- HolidayPirates Limited
- International Expeditions
- Intrepid Group Ltd.
- Intrepid Travel by Intrepid Group Pty Limited
- KE Adventure Travel
- Mountain Travel Sobek
- National Geographic Partners, LLC
- Natural Habitat Adventures
- REI Adventures
- Row Adventure
- TourRadar GmbH
- Travel Talk Adventures LTD.
- TUI Group
- Undiscovered Mountains
- WeRoad
- Zegrahm Expeditions
- 主要產品系列
第14章附錄
- 討論指南
- 關於許可證和定價
[199 Pages Report] The Adventure Tourism Market size was estimated at USD 561.21 billion in 2022 and expected to reach USD 609.89 billion in 2023, at a CAGR 12.05% to reach USD 1,394.52 billion by 2030.
Global Adventure Tourism Market
| KEY MARKET STATISTICS | |
|---|---|
| Base Year [2022] | USD 561.21 billion |
| Estimated Year [2023] | USD 609.89 billion |
| Forecast Year [2030] | USD 1,394.52 billion |
| CAGR (%) | 12.05% |
Adventure tourism involves exploring and traveling to remote and exotic destinations, where the traveler should expect the unexpected. Adventure tourism is gaining popularity as travelers seek unusual holidays, unlike typical beach vacations. Adventure tourism includes challenging experiences during the vacation, such as mountaineering expeditions, trekking, paragliding, bungee jumping, rafting, and rock climbing. The growing trend for fitness and outdoor activities, coupled with rising disposable incomes globally, has encouraged the growth of the adventure tourism market. However, unpredictable weather conditions and high costs associated with adventure activities can significantly hamper the growth of the adventure tourism market. Furthermore, the government initiatives to promote tourism and the emergence of social media influence are expected to offer growth opportunities for the market.
Regional Insights
In the Americas, the United States and Canada are prominent players in adventure tourism. The diverse landscapes, from the Rocky Mountains to the Grand Canyon, make these countries attractive destinations for adventure seekers. Consumer trends prefer sustainable and responsible travel experiences, emphasizing local culture and eco-friendly practices. Investment in national parks and protected areas, as well as the development of unique local experiences, are driving the market growth in the region. The adventure tourism market in Europe, the Middle East, and Africa showcases a diverse landscape. Europe boasts popular adventure destinations such as the Swiss Alps for skiing, the Mediterranean for water sports, and various trekking routes. Africa offers safaris, mountain climbing, Kilimanjaro, and desert expeditions. The Middle East attracts adventure seekers with activities such as desert safaris, diving in the Red Sea, and mountain trekking. This region presents various adventurous activities catering to different interests and preferences. In Asia Pacific, countries including China, Japan, and India cater to a large domestic market and international visitors. China's rapid economic growth has increased outbound tourism, with Chinese tourists seeking adventure experiences abroad. Japan offers a blend of traditional culture and natural landscapes, while India is known for its Himalayan adventures and wildlife tours. Adventure tourism in this region is growing rapidly, with an increasing desire for health and wellness retreats intertwined with adventure activities.
FPNV Positioning Matrix
The FPNV Positioning Matrix is pivotal in evaluating the Adventure Tourism Market. It offers a comprehensive assessment of vendors, examining key metrics related to Business Strategy and Product Satisfaction. This in-depth analysis empowers users to make well-informed decisions aligned with their requirements. Based on the evaluation, the vendors are then categorized into four distinct quadrants representing varying levels of success: Forefront (F), Pathfinder (P), Niche (N), or Vital (V).
Market Share Analysis
The Market Share Analysis is a comprehensive tool that provides an insightful and in-depth examination of the current state of vendors in the Adventure Tourism Market. By meticulously comparing and analyzing vendor contributions in terms of overall revenue, customer base, and other key metrics, we can offer companies a greater understanding of their performance and the challenges they face when competing for market share. Additionally, this analysis provides valuable insights into the competitive nature of the sector, including factors such as accumulation, fragmentation dominance, and amalgamation traits observed over the base year period studied. With this expanded level of detail, vendors can make more informed decisions and devise effective strategies to gain a competitive edge in the market.
Key Company Profiles
The report delves into recent significant developments in the Adventure Tourism Market, highlighting leading vendors and their innovative profiles. These include Abercrombie & Kent Group of Companies S.A., Austin Adventures, Inc. by Active Adventures, Butterfield & Robinson Inc., Contiki, Discovery Nomad, Exodus Travels Limited, Explore Worldwide Ltd, G Adventures, HolidayPirates Limited, International Expeditions, Intrepid Group Ltd., Intrepid Travel by Intrepid Group Pty Limited, KE Adventure Travel, Mountain Travel Sobek, National Geographic Partners, LLC, Natural Habitat Adventures, REI Adventures, Row Adventure, TourRadar GmbH, Travel Talk Adventures LTD., TUI Group, Undiscovered Mountains, WeRoad, and Zegrahm Expeditions.
Market Segmentation & Coverage
This research report categorizes the Adventure Tourism Market to forecast the revenues and analyze trends in each of the following sub-markets:
- Type
- Hard
- Soft
- Activity
- Air-based Activity
- Land-based Activity
- Water-based Activity
- Distribution Channel
- Direct
- Travel Agent
- Region
- Americas
- Argentina
- Brazil
- Canada
- Mexico
- United States
- California
- Florida
- Illinois
- New York
- Ohio
- Pennsylvania
- Texas
- Asia-Pacific
- Australia
- China
- India
- Indonesia
- Japan
- Malaysia
- Philippines
- Singapore
- South Korea
- Taiwan
- Thailand
- Vietnam
- Europe, Middle East & Africa
- Denmark
- Egypt
- Finland
- France
- Germany
- Israel
- Italy
- Netherlands
- Nigeria
- Norway
- Poland
- Qatar
- Russia
- Saudi Arabia
- South Africa
- Spain
- Sweden
- Switzerland
- Turkey
- United Arab Emirates
- United Kingdom
- Americas
The report offers valuable insights on the following aspects:
1. Market Penetration: It presents comprehensive information on the market provided by key players.
2. Market Development: It delves deep into lucrative emerging markets and analyzes the penetration across mature market segments.
3. Market Diversification: It provides detailed information on new product launches, untapped geographic regions, recent developments, and investments.
4. Competitive Assessment & Intelligence: It conducts an exhaustive assessment of market shares, strategies, products, certifications, regulatory approvals, patent landscape, and manufacturing capabilities of the leading players.
5. Product Development & Innovation: It offers intelligent insights on future technologies, R&D activities, and breakthrough product developments.
The report addresses key questions such as:
1. What is the market size and forecast of the Adventure Tourism Market?
2. Which products, segments, applications, and areas should one consider investing in over the forecast period in the Adventure Tourism Market?
3. What are the technology trends and regulatory frameworks in the Adventure Tourism Market?
4. What is the market share of the leading vendors in the Adventure Tourism Market?
5. Which modes and strategic moves are suitable for entering the Adventure Tourism Market?
Table of Contents
1. Preface
- 1.1. Objectives of the Study
- 1.2. Market Segmentation & Coverage
- 1.3. Years Considered for the Study
- 1.4. Currency & Pricing
- 1.5. Language
- 1.6. Limitations
- 1.7. Assumptions
- 1.8. Stakeholders
2. Research Methodology
- 2.1. Define: Research Objective
- 2.2. Determine: Research Design
- 2.3. Prepare: Research Instrument
- 2.4. Collect: Data Source
- 2.5. Analyze: Data Interpretation
- 2.6. Formulate: Data Verification
- 2.7. Publish: Research Report
- 2.8. Repeat: Report Update
3. Executive Summary
4. Market Overview
- 4.1. Introduction
- 4.2. Adventure Tourism Market, by Region
5. Market Insights
- 5.1. Market Dynamics
- 5.1.1. Drivers
- 5.1.1.1. Exponentially growing tourism industry and adventure activities
- 5.1.1.2. Simulators and virtual environments for better consumer experience
- 5.1.1.3. Government initiatives in the form of private and public partnership to promote tourism and improved safety & security
- 5.1.2. Restraints
- 5.1.2.1. Risk involved in unpredictable weather condition and adventure travelling restrictions
- 5.1.3. Opportunities
- 5.1.3.1. Integration of artificial intelligence and social media platforms
- 5.1.3.2. Rising disposable income in emerging economies
- 5.1.3.3. Marketing strategies and sector professionalism
- 5.1.4. Challenges
- 5.1.4.1. High cost associated with adventure activities
- 5.1.1. Drivers
- 5.2. Market Segmentation Analysis
- 5.2.1. Type: Preference towards soft adventure tourism for spending quality time with family
- 5.2.2. Activity: Increasing inclination toward air-based activities among younger population
- 5.2.3. Distribution Channel: Higher preferences for direct bookings, allowing a more tailored and cost-effective experience
- 5.3. Market Trend Analysis
- 5.4. Cumulative Impact of COVID-19
- 5.5. Cumulative Impact of Russia-Ukraine Conflict
- 5.6. Cumulative Impact of High Inflation
- 5.7. Porter's Five Forces Analysis
- 5.7.1. Threat of New Entrants
- 5.7.2. Threat of Substitutes
- 5.7.3. Bargaining Power of Customers
- 5.7.4. Bargaining Power of Suppliers
- 5.7.5. Industry Rivalry
- 5.8. Value Chain & Critical Path Analysis
- 5.9. Regulatory Framework
- 5.10. Client Customization
6. Adventure Tourism Market, by Type
- 6.1. Introduction
- 6.2. Hard
- 6.3. Soft
7. Adventure Tourism Market, by Activity
- 7.1. Introduction
- 7.2. Air-based Activity
- 7.3. Land-based Activity
- 7.4. Water-based Activity
8. Adventure Tourism Market, by Distribution Channel
- 8.1. Introduction
- 8.2. Direct
- 8.3. Travel Agent
9. Americas Adventure Tourism Market
- 9.1. Introduction
- 9.2. Argentina
- 9.3. Brazil
- 9.4. Canada
- 9.5. Mexico
- 9.6. United States
10. Asia-Pacific Adventure Tourism Market
- 10.1. Introduction
- 10.2. Australia
- 10.3. China
- 10.4. India
- 10.5. Indonesia
- 10.6. Japan
- 10.7. Malaysia
- 10.8. Philippines
- 10.9. Singapore
- 10.10. South Korea
- 10.11. Taiwan
- 10.12. Thailand
- 10.13. Vietnam
11. Europe, Middle East & Africa Adventure Tourism Market
- 11.1. Introduction
- 11.2. Denmark
- 11.3. Egypt
- 11.4. Finland
- 11.5. France
- 11.6. Germany
- 11.7. Israel
- 11.8. Italy
- 11.9. Netherlands
- 11.10. Nigeria
- 11.11. Norway
- 11.12. Poland
- 11.13. Qatar
- 11.14. Russia
- 11.15. Saudi Arabia
- 11.16. South Africa
- 11.17. Spain
- 11.18. Sweden
- 11.19. Switzerland
- 11.20. Turkey
- 11.21. United Arab Emirates
- 11.22. United Kingdom
12. Competitive Landscape
- 12.1. FPNV Positioning Matrix
- 12.2. Market Share Analysis, By Key Player
- 12.3. Competitive Scenario Analysis, By Key Player
- 12.3.1. Agreement, Collaboration, & Partnership
- 12.3.1.1. TourRadar Adds 2 Partners for Organized Adventure Tours
- 12.3.2. New Product Launch & Enhancement
- 12.3.2.1. Kerala Tourism to Launch 'Helitaxi' Project to Boost Adventure Tourism
- 12.3.3. Investment & Funding
- 12.3.3.1. Italian startup WeRoad Raises EUR 18 Million to Scale Millennial Adventure Travel
- 12.3.1. Agreement, Collaboration, & Partnership
13. Competitive Portfolio
- 13.1. Key Company Profiles
- 13.1.1. Abercrombie & Kent Group of Companies S.A.
- 13.1.2. Austin Adventures, Inc. by Active Adventures
- 13.1.3. Butterfield & Robinson Inc.
- 13.1.4. Contiki
- 13.1.5. Discovery Nomad
- 13.1.6. Exodus Travels Limited
- 13.1.7. Explore Worldwide Ltd
- 13.1.8. G Adventures
- 13.1.9. HolidayPirates Limited
- 13.1.10. International Expeditions
- 13.1.11. Intrepid Group Ltd.
- 13.1.12. Intrepid Travel by Intrepid Group Pty Limited
- 13.1.13. KE Adventure Travel
- 13.1.14. Mountain Travel Sobek
- 13.1.15. National Geographic Partners, LLC
- 13.1.16. Natural Habitat Adventures
- 13.1.17. REI Adventures
- 13.1.18. Row Adventure
- 13.1.19. TourRadar GmbH
- 13.1.20. Travel Talk Adventures LTD.
- 13.1.21. TUI Group
- 13.1.22. Undiscovered Mountains
- 13.1.23. WeRoad
- 13.1.24. Zegrahm Expeditions
- 13.2. Key Product Portfolio
14. Appendix
- 14.1. Discussion Guide
- 14.2. License & Pricing
LIST OF FIGURES
- FIGURE 1. ADVENTURE TOURISM MARKET RESEARCH PROCESS
- FIGURE 2. ADVENTURE TOURISM MARKET SIZE, 2022 VS 2030
- FIGURE 3. ADVENTURE TOURISM MARKET SIZE, 2018-2030 (USD MILLION)
- FIGURE 4. ADVENTURE TOURISM MARKET SIZE, BY REGION, 2022 VS 2030 (%)
- FIGURE 5. ADVENTURE TOURISM MARKET SIZE, BY REGION, 2022 VS 2023 VS 2030 (USD MILLION)
- FIGURE 6. ADVENTURE TOURISM MARKET DYNAMICS
- FIGURE 7. ADVENTURE TOURISM MARKET SIZE, BY TYPE, 2022 VS 2030 (%)
- FIGURE 8. ADVENTURE TOURISM MARKET SIZE, BY TYPE, 2022 VS 2023 VS 2030 (USD MILLION)
- FIGURE 9. ADVENTURE TOURISM MARKET SIZE, BY ACTIVITY, 2022 VS 2030 (%)
- FIGURE 10. ADVENTURE TOURISM MARKET SIZE, BY ACTIVITY, 2022 VS 2023 VS 2030 (USD MILLION)
- FIGURE 11. ADVENTURE TOURISM MARKET SIZE, BY DISTRIBUTION CHANNEL, 2022 VS 2030 (%)
- FIGURE 12. ADVENTURE TOURISM MARKET SIZE, BY DISTRIBUTION CHANNEL, 2022 VS 2023 VS 2030 (USD MILLION)
- FIGURE 13. AMERICAS ADVENTURE TOURISM MARKET SIZE, BY COUNTRY, 2022 VS 2030 (%)
- FIGURE 14. AMERICAS ADVENTURE TOURISM MARKET SIZE, BY COUNTRY, 2022 VS 2023 VS 2030 (USD MILLION)
- FIGURE 15. UNITED STATES ADVENTURE TOURISM MARKET SIZE, BY STATE, 2022 VS 2030 (%)
- FIGURE 16. UNITED STATES ADVENTURE TOURISM MARKET SIZE, BY STATE, 2022 VS 2023 VS 2030 (USD MILLION)
- FIGURE 17. ASIA-PACIFIC ADVENTURE TOURISM MARKET SIZE, BY COUNTRY, 2022 VS 2030 (%)
- FIGURE 18. ASIA-PACIFIC ADVENTURE TOURISM MARKET SIZE, BY COUNTRY, 2022 VS 2023 VS 2030 (USD MILLION)
- FIGURE 19. EUROPE, MIDDLE EAST & AFRICA ADVENTURE TOURISM MARKET SIZE, BY COUNTRY, 2022 VS 2030 (%)
- FIGURE 20. EUROPE, MIDDLE EAST & AFRICA ADVENTURE TOURISM MARKET SIZE, BY COUNTRY, 2022 VS 2023 VS 2030 (USD MILLION)
- FIGURE 21. ADVENTURE TOURISM MARKET, FPNV POSITIONING MATRIX, 2022
- FIGURE 22. ADVENTURE TOURISM MARKET SHARE, BY KEY PLAYER, 2022
LIST OF TABLES
- TABLE 1. ADVENTURE TOURISM MARKET SEGMENTATION & COVERAGE
- TABLE 2. UNITED STATES DOLLAR EXCHANGE RATE, 2018-2022
- TABLE 3. ADVENTURE TOURISM MARKET SIZE, 2018-2030 (USD MILLION)
- TABLE 4. GLOBAL ADVENTURE TOURISM MARKET SIZE, BY REGION, 2018-2030 (USD MILLION)
- TABLE 5. ADVENTURE TOURISM MARKET SIZE, BY TYPE, 2018-2030 (USD MILLION)
- TABLE 6. ADVENTURE TOURISM MARKET SIZE, BY HARD, BY REGION, 2018-2030 (USD MILLION)
- TABLE 7. ADVENTURE TOURISM MARKET SIZE, BY SOFT, BY REGION, 2018-2030 (USD MILLION)
- TABLE 8. ADVENTURE TOURISM MARKET SIZE, BY ACTIVITY, 2018-2030 (USD MILLION)
- TABLE 9. ADVENTURE TOURISM MARKET SIZE, BY AIR-BASED ACTIVITY, BY REGION, 2018-2030 (USD MILLION)
- TABLE 10. ADVENTURE TOURISM MARKET SIZE, BY LAND-BASED ACTIVITY, BY REGION, 2018-2030 (USD MILLION)
- TABLE 11. ADVENTURE TOURISM MARKET SIZE, BY WATER-BASED ACTIVITY, BY REGION, 2018-2030 (USD MILLION)
- TABLE 12. ADVENTURE TOURISM MARKET SIZE, BY DISTRIBUTION CHANNEL, 2018-2030 (USD MILLION)
- TABLE 13. ADVENTURE TOURISM MARKET SIZE, BY DIRECT, BY REGION, 2018-2030 (USD MILLION)
- TABLE 14. ADVENTURE TOURISM MARKET SIZE, BY TRAVEL AGENT, BY REGION, 2018-2030 (USD MILLION)
- TABLE 15. AMERICAS ADVENTURE TOURISM MARKET SIZE, BY TYPE, 2018-2030 (USD MILLION)
- TABLE 16. AMERICAS ADVENTURE TOURISM MARKET SIZE, BY ACTIVITY, 2018-2030 (USD MILLION)
- TABLE 17. AMERICAS ADVENTURE TOURISM MARKET SIZE, BY DISTRIBUTION CHANNEL, 2018-2030 (USD MILLION)
- TABLE 18. AMERICAS ADVENTURE TOURISM MARKET SIZE, BY COUNTRY, 2018-2030 (USD MILLION)
- TABLE 19. ARGENTINA ADVENTURE TOURISM MARKET SIZE, BY TYPE, 2018-2030 (USD MILLION)
- TABLE 20. ARGENTINA ADVENTURE TOURISM MARKET SIZE, BY ACTIVITY, 2018-2030 (USD MILLION)
- TABLE 21. ARGENTINA ADVENTURE TOURISM MARKET SIZE, BY DISTRIBUTION CHANNEL, 2018-2030 (USD MILLION)
- TABLE 22. BRAZIL ADVENTURE TOURISM MARKET SIZE, BY TYPE, 2018-2030 (USD MILLION)
- TABLE 23. BRAZIL ADVENTURE TOURISM MARKET SIZE, BY ACTIVITY, 2018-2030 (USD MILLION)
- TABLE 24. BRAZIL ADVENTURE TOURISM MARKET SIZE, BY DISTRIBUTION CHANNEL, 2018-2030 (USD MILLION)
- TABLE 25. CANADA ADVENTURE TOURISM MARKET SIZE, BY TYPE, 2018-2030 (USD MILLION)
- TABLE 26. CANADA ADVENTURE TOURISM MARKET SIZE, BY ACTIVITY, 2018-2030 (USD MILLION)
- TABLE 27. CANADA ADVENTURE TOURISM MARKET SIZE, BY DISTRIBUTION CHANNEL, 2018-2030 (USD MILLION)
- TABLE 28. MEXICO ADVENTURE TOURISM MARKET SIZE, BY TYPE, 2018-2030 (USD MILLION)
- TABLE 29. MEXICO ADVENTURE TOURISM MARKET SIZE, BY ACTIVITY, 2018-2030 (USD MILLION)
- TABLE 30. MEXICO ADVENTURE TOURISM MARKET SIZE, BY DISTRIBUTION CHANNEL, 2018-2030 (USD MILLION)
- TABLE 31. UNITED STATES ADVENTURE TOURISM MARKET SIZE, BY TYPE, 2018-2030 (USD MILLION)
- TABLE 32. UNITED STATES ADVENTURE TOURISM MARKET SIZE, BY ACTIVITY, 2018-2030 (USD MILLION)
- TABLE 33. UNITED STATES ADVENTURE TOURISM MARKET SIZE, BY DISTRIBUTION CHANNEL, 2018-2030 (USD MILLION)
- TABLE 34. UNITED STATES ADVENTURE TOURISM MARKET SIZE, BY STATE, 2018-2030 (USD MILLION)
- TABLE 35. ASIA-PACIFIC ADVENTURE TOURISM MARKET SIZE, BY TYPE, 2018-2030 (USD MILLION)
- TABLE 36. ASIA-PACIFIC ADVENTURE TOURISM MARKET SIZE, BY ACTIVITY, 2018-2030 (USD MILLION)
- TABLE 37. ASIA-PACIFIC ADVENTURE TOURISM MARKET SIZE, BY DISTRIBUTION CHANNEL, 2018-2030 (USD MILLION)
- TABLE 38. ASIA-PACIFIC ADVENTURE TOURISM MARKET SIZE, BY COUNTRY, 2018-2030 (USD MILLION)
- TABLE 39. AUSTRALIA ADVENTURE TOURISM MARKET SIZE, BY TYPE, 2018-2030 (USD MILLION)
- TABLE 40. AUSTRALIA ADVENTURE TOURISM MARKET SIZE, BY ACTIVITY, 2018-2030 (USD MILLION)
- TABLE 41. AUSTRALIA ADVENTURE TOURISM MARKET SIZE, BY DISTRIBUTION CHANNEL, 2018-2030 (USD MILLION)
- TABLE 42. CHINA ADVENTURE TOURISM MARKET SIZE, BY TYPE, 2018-2030 (USD MILLION)
- TABLE 43. CHINA ADVENTURE TOURISM MARKET SIZE, BY ACTIVITY, 2018-2030 (USD MILLION)
- TABLE 44. CHINA ADVENTURE TOURISM MARKET SIZE, BY DISTRIBUTION CHANNEL, 2018-2030 (USD MILLION)
- TABLE 45. INDIA ADVENTURE TOURISM MARKET SIZE, BY TYPE, 2018-2030 (USD MILLION)
- TABLE 46. INDIA ADVENTURE TOURISM MARKET SIZE, BY ACTIVITY, 2018-2030 (USD MILLION)
- TABLE 47. INDIA ADVENTURE TOURISM MARKET SIZE, BY DISTRIBUTION CHANNEL, 2018-2030 (USD MILLION)
- TABLE 48. INDONESIA ADVENTURE TOURISM MARKET SIZE, BY TYPE, 2018-2030 (USD MILLION)
- TABLE 49. INDONESIA ADVENTURE TOURISM MARKET SIZE, BY ACTIVITY, 2018-2030 (USD MILLION)
- TABLE 50. INDONESIA ADVENTURE TOURISM MARKET SIZE, BY DISTRIBUTION CHANNEL, 2018-2030 (USD MILLION)
- TABLE 51. JAPAN ADVENTURE TOURISM MARKET SIZE, BY TYPE, 2018-2030 (USD MILLION)
- TABLE 52. JAPAN ADVENTURE TOURISM MARKET SIZE, BY ACTIVITY, 2018-2030 (USD MILLION)
- TABLE 53. JAPAN ADVENTURE TOURISM MARKET SIZE, BY DISTRIBUTION CHANNEL, 2018-2030 (USD MILLION)
- TABLE 54. MALAYSIA ADVENTURE TOURISM MARKET SIZE, BY TYPE, 2018-2030 (USD MILLION)
- TABLE 55. MALAYSIA ADVENTURE TOURISM MARKET SIZE, BY ACTIVITY, 2018-2030 (USD MILLION)
- TABLE 56. MALAYSIA ADVENTURE TOURISM MARKET SIZE, BY DISTRIBUTION CHANNEL, 2018-2030 (USD MILLION)
- TABLE 57. PHILIPPINES ADVENTURE TOURISM MARKET SIZE, BY TYPE, 2018-2030 (USD MILLION)
- TABLE 58. PHILIPPINES ADVENTURE TOURISM MARKET SIZE, BY ACTIVITY, 2018-2030 (USD MILLION)
- TABLE 59. PHILIPPINES ADVENTURE TOURISM MARKET SIZE, BY DISTRIBUTION CHANNEL, 2018-2030 (USD MILLION)
- TABLE 60. SINGAPORE ADVENTURE TOURISM MARKET SIZE, BY TYPE, 2018-2030 (USD MILLION)
- TABLE 61. SINGAPORE ADVENTURE TOURISM MARKET SIZE, BY ACTIVITY, 2018-2030 (USD MILLION)
- TABLE 62. SINGAPORE ADVENTURE TOURISM MARKET SIZE, BY DISTRIBUTION CHANNEL, 2018-2030 (USD MILLION)
- TABLE 63. SOUTH KOREA ADVENTURE TOURISM MARKET SIZE, BY TYPE, 2018-2030 (USD MILLION)
- TABLE 64. SOUTH KOREA ADVENTURE TOURISM MARKET SIZE, BY ACTIVITY, 2018-2030 (USD MILLION)
- TABLE 65. SOUTH KOREA ADVENTURE TOURISM MARKET SIZE, BY DISTRIBUTION CHANNEL, 2018-2030 (USD MILLION)
- TABLE 66. TAIWAN ADVENTURE TOURISM MARKET SIZE, BY TYPE, 2018-2030 (USD MILLION)
- TABLE 67. TAIWAN ADVENTURE TOURISM MARKET SIZE, BY ACTIVITY, 2018-2030 (USD MILLION)
- TABLE 68. TAIWAN ADVENTURE TOURISM MARKET SIZE, BY DISTRIBUTION CHANNEL, 2018-2030 (USD MILLION)
- TABLE 69. THAILAND ADVENTURE TOURISM MARKET SIZE, BY TYPE, 2018-2030 (USD MILLION)
- TABLE 70. THAILAND ADVENTURE TOURISM MARKET SIZE, BY ACTIVITY, 2018-2030 (USD MILLION)
- TABLE 71. THAILAND ADVENTURE TOURISM MARKET SIZE, BY DISTRIBUTION CHANNEL, 2018-2030 (USD MILLION)
- TABLE 72. VIETNAM ADVENTURE TOURISM MARKET SIZE, BY TYPE, 2018-2030 (USD MILLION)
- TABLE 73. VIETNAM ADVENTURE TOURISM MARKET SIZE, BY ACTIVITY, 2018-2030 (USD MILLION)
- TABLE 74. VIETNAM ADVENTURE TOURISM MARKET SIZE, BY DISTRIBUTION CHANNEL, 2018-2030 (USD MILLION)
- TABLE 75. EUROPE, MIDDLE EAST & AFRICA ADVENTURE TOURISM MARKET SIZE, BY TYPE, 2018-2030 (USD MILLION)
- TABLE 76. EUROPE, MIDDLE EAST & AFRICA ADVENTURE TOURISM MARKET SIZE, BY ACTIVITY, 2018-2030 (USD MILLION)
- TABLE 77. EUROPE, MIDDLE EAST & AFRICA ADVENTURE TOURISM MARKET SIZE, BY DISTRIBUTION CHANNEL, 2018-2030 (USD MILLION)
- TABLE 78. EUROPE, MIDDLE EAST & AFRICA ADVENTURE TOURISM MARKET SIZE, BY COUNTRY, 2018-2030 (USD MILLION)
- TABLE 79. DENMARK ADVENTURE TOURISM MARKET SIZE, BY TYPE, 2018-2030 (USD MILLION)
- TABLE 80. DENMARK ADVENTURE TOURISM MARKET SIZE, BY ACTIVITY, 2018-2030 (USD MILLION)
- TABLE 81. DENMARK ADVENTURE TOURISM MARKET SIZE, BY DISTRIBUTION CHANNEL, 2018-2030 (USD MILLION)
- TABLE 82. EGYPT ADVENTURE TOURISM MARKET SIZE, BY TYPE, 2018-2030 (USD MILLION)
- TABLE 83. EGYPT ADVENTURE TOURISM MARKET SIZE, BY ACTIVITY, 2018-2030 (USD MILLION)
- TABLE 84. EGYPT ADVENTURE TOURISM MARKET SIZE, BY DISTRIBUTION CHANNEL, 2018-2030 (USD MILLION)
- TABLE 85. FINLAND ADVENTURE TOURISM MARKET SIZE, BY TYPE, 2018-2030 (USD MILLION)
- TABLE 86. FINLAND ADVENTURE TOURISM MARKET SIZE, BY ACTIVITY, 2018-2030 (USD MILLION)
- TABLE 87. FINLAND ADVENTURE TOURISM MARKET SIZE, BY DISTRIBUTION CHANNEL, 2018-2030 (USD MILLION)
- TABLE 88. FRANCE ADVENTURE TOURISM MARKET SIZE, BY TYPE, 2018-2030 (USD MILLION)
- TABLE 89. FRANCE ADVENTURE TOURISM MARKET SIZE, BY ACTIVITY, 2018-2030 (USD MILLION)
- TABLE 90. FRANCE ADVENTURE TOURISM MARKET SIZE, BY DISTRIBUTION CHANNEL, 2018-2030 (USD MILLION)
- TABLE 91. GERMANY ADVENTURE TOURISM MARKET SIZE, BY TYPE, 2018-2030 (USD MILLION)
- TABLE 92. GERMANY ADVENTURE TOURISM MARKET SIZE, BY ACTIVITY, 2018-2030 (USD MILLION)
- TABLE 93. GERMANY ADVENTURE TOURISM MARKET SIZE, BY DISTRIBUTION CHANNEL, 2018-2030 (USD MILLION)
- TABLE 94. ISRAEL ADVENTURE TOURISM MARKET SIZE, BY TYPE, 2018-2030 (USD MILLION)
- TABLE 95. ISRAEL ADVENTURE TOURISM MARKET SIZE, BY ACTIVITY, 2018-2030 (USD MILLION)
- TABLE 96. ISRAEL ADVENTURE TOURISM MARKET SIZE, BY DISTRIBUTION CHANNEL, 2018-2030 (USD MILLION)
- TABLE 97. ITALY ADVENTURE TOURISM MARKET SIZE, BY TYPE, 2018-2030 (USD MILLION)
- TABLE 98. ITALY ADVENTURE TOURISM MARKET SIZE, BY ACTIVITY, 2018-2030 (USD MILLION)
- TABLE 99. ITALY ADVENTURE TOURISM MARKET SIZE, BY DISTRIBUTION CHANNEL, 2018-2030 (USD MILLION)
- TABLE 100. NETHERLANDS ADVENTURE TOURISM MARKET SIZE, BY TYPE, 2018-2030 (USD MILLION)
- TABLE 101. NETHERLANDS ADVENTURE TOURISM MARKET SIZE, BY ACTIVITY, 2018-2030 (USD MILLION)
- TABLE 102. NETHERLANDS ADVENTURE TOURISM MARKET SIZE, BY DISTRIBUTION CHANNEL, 2018-2030 (USD MILLION)
- TABLE 103. NIGERIA ADVENTURE TOURISM MARKET SIZE, BY TYPE, 2018-2030 (USD MILLION)
- TABLE 104. NIGERIA ADVENTURE TOURISM MARKET SIZE, BY ACTIVITY, 2018-2030 (USD MILLION)
- TABLE 105. NIGERIA ADVENTURE TOURISM MARKET SIZE, BY DISTRIBUTION CHANNEL, 2018-2030 (USD MILLION)
- TABLE 106. NORWAY ADVENTURE TOURISM MARKET SIZE, BY TYPE, 2018-2030 (USD MILLION)
- TABLE 107. NORWAY ADVENTURE TOURISM MARKET SIZE, BY ACTIVITY, 2018-2030 (USD MILLION)
- TABLE 108. NORWAY ADVENTURE TOURISM MARKET SIZE, BY DISTRIBUTION CHANNEL, 2018-2030 (USD MILLION)
- TABLE 109. POLAND ADVENTURE TOURISM MARKET SIZE, BY TYPE, 2018-2030 (USD MILLION)
- TABLE 110. POLAND ADVENTURE TOURISM MARKET SIZE, BY ACTIVITY, 2018-2030 (USD MILLION)
- TABLE 111. POLAND ADVENTURE TOURISM MARKET SIZE, BY DISTRIBUTION CHANNEL, 2018-2030 (USD MILLION)
- TABLE 112. QATAR ADVENTURE TOURISM MARKET SIZE, BY TYPE, 2018-2030 (USD MILLION)
- TABLE 113. QATAR ADVENTURE TOURISM MARKET SIZE, BY ACTIVITY, 2018-2030 (USD MILLION)
- TABLE 114. QATAR ADVENTURE TOURISM MARKET SIZE, BY DISTRIBUTION CHANNEL, 2018-2030 (USD MILLION)
- TABLE 115. RUSSIA ADVENTURE TOURISM MARKET SIZE, BY TYPE, 2018-2030 (USD MILLION)
- TABLE 116. RUSSIA ADVENTURE TOURISM MARKET SIZE, BY ACTIVITY, 2018-2030 (USD MILLION)
- TABLE 117. RUSSIA ADVENTURE TOURISM MARKET SIZE, BY DISTRIBUTION CHANNEL, 2018-2030 (USD MILLION)
- TABLE 118. SAUDI ARABIA ADVENTURE TOURISM MARKET SIZE, BY TYPE, 2018-2030 (USD MILLION)
- TABLE 119. SAUDI ARABIA ADVENTURE TOURISM MARKET SIZE, BY ACTIVITY, 2018-2030 (USD MILLION)
- TABLE 120. SAUDI ARABIA ADVENTURE TOURISM MARKET SIZE, BY DISTRIBUTION CHANNEL, 2018-2030 (USD MILLION)
- TABLE 121. SOUTH AFRICA ADVENTURE TOURISM MARKET SIZE, BY TYPE, 2018-2030 (USD MILLION)
- TABLE 122. SOUTH AFRICA ADVENTURE TOURISM MARKET SIZE, BY ACTIVITY, 2018-2030 (USD MILLION)
- TABLE 123. SOUTH AFRICA ADVENTURE TOURISM MARKET SIZE, BY DISTRIBUTION CHANNEL, 2018-2030 (USD MILLION)
- TABLE 124. SPAIN ADVENTURE TOURISM MARKET SIZE, BY TYPE, 2018-2030 (USD MILLION)
- TABLE 125. SPAIN ADVENTURE TOURISM MARKET SIZE, BY ACTIVITY, 2018-2030 (USD MILLION)
- TABLE 126. SPAIN ADVENTURE TOURISM MARKET SIZE, BY DISTRIBUTION CHANNEL, 2018-2030 (USD MILLION)
- TABLE 127. SWEDEN ADVENTURE TOURISM MARKET SIZE, BY TYPE, 2018-2030 (USD MILLION)
- TABLE 128. SWEDEN ADVENTURE TOURISM MARKET SIZE, BY ACTIVITY, 2018-2030 (USD MILLION)
- TABLE 129. SWEDEN ADVENTURE TOURISM MARKET SIZE, BY DISTRIBUTION CHANNEL, 2018-2030 (USD MILLION)
- TABLE 130. SWITZERLAND ADVENTURE TOURISM MARKET SIZE, BY TYPE, 2018-2030 (USD MILLION)
- TABLE 131. SWITZERLAND ADVENTURE TOURISM MARKET SIZE, BY ACTIVITY, 2018-2030 (USD MILLION)
- TABLE 132. SWITZERLAND ADVENTURE TOURISM MARKET SIZE, BY DISTRIBUTION CHANNEL, 2018-2030 (USD MILLION)
- TABLE 133. TURKEY ADVENTURE TOURISM MARKET SIZE, BY TYPE, 2018-2030 (USD MILLION)
- TABLE 134. TURKEY ADVENTURE TOURISM MARKET SIZE, BY ACTIVITY, 2018-2030 (USD MILLION)
- TABLE 135. TURKEY ADVENTURE TOURISM MARKET SIZE, BY DISTRIBUTION CHANNEL, 2018-2030 (USD MILLION)
- TABLE 136. UNITED ARAB EMIRATES ADVENTURE TOURISM MARKET SIZE, BY TYPE, 2018-2030 (USD MILLION)
- TABLE 137. UNITED ARAB EMIRATES ADVENTURE TOURISM MARKET SIZE, BY ACTIVITY, 2018-2030 (USD MILLION)
- TABLE 138. UNITED ARAB EMIRATES ADVENTURE TOURISM MARKET SIZE, BY DISTRIBUTION CHANNEL, 2018-2030 (USD MILLION)
- TABLE 139. UNITED KINGDOM ADVENTURE TOURISM MARKET SIZE, BY TYPE, 2018-2030 (USD MILLION)
- TABLE 140. UNITED KINGDOM ADVENTURE TOURISM MARKET SIZE, BY ACTIVITY, 2018-2030 (USD MILLION)
- TABLE 141. UNITED KINGDOM ADVENTURE TOURISM MARKET SIZE, BY DISTRIBUTION CHANNEL, 2018-2030 (USD MILLION)
- TABLE 142. ADVENTURE TOURISM MARKET, FPNV POSITIONING MATRIX, 2022
- TABLE 143. ADVENTURE TOURISM MARKET SHARE, BY KEY PLAYER, 2022
- TABLE 144. ADVENTURE TOURISM MARKET LICENSE & PRICING


