


 |
市場調查報告書
商品編碼
1415445
知識圖市場:按產品、按類型、按模型類型、按資料來源、按應用、按產業 - 2024-2030 年全球預測Knowledge Graph Market by Offering (Services, Solutions), Type (Context-rich Knowledge Graphs, External-sensing Knowledge Graphs, NLP Knowledge Graphs), Model Type, Data Source, Application, Vertical - Global Forecast 2024-2030 |
||||||
※ 本網頁內容可能與最新版本有所差異。詳細情況請與我們聯繫。
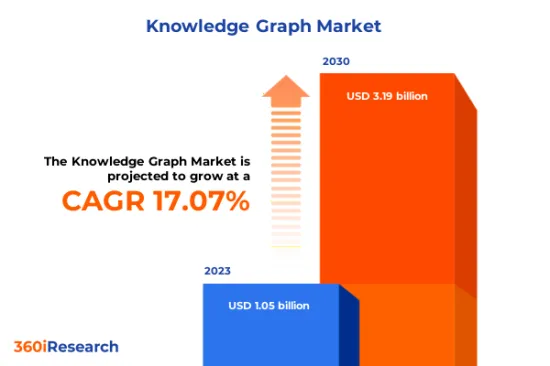
預計2023年知識圖譜市場規模為10.5億美元,預計2024年將達到12.4億美元,2030年將達到31.9億美元,複合年成長率為17.07%。
知識圖譜全球市場
| 主要市場統計 | |
|---|---|
| 基準年[2023] | 10.5億美元 |
| 預測年份 [2024] | 12.4億美元 |
| 預測年份 [2030] | 31.9億美元 |
| 複合年成長率(%) | 17.07% |
知識圖是一種結構化的知識模型,它結合了實體、關係和屬性來建構語意網路。它是一種以機器易於計算和理解的方式組織和連接資訊的方式。知識圖在以實現高效資料搜尋、推理和分析的方式表示和組織知識方面發揮關鍵作用。影響市場成長的因素包括對先進分析工具的需求不斷增加以及資料生成的快速增加。此外,不斷成長的業務需求(例如提高客戶滿意度、無縫溝通和知識共用)也正在推動市場成長。然而,對知識圖的好處缺乏了解、對技術熟練專家的需求以及隱私問題阻礙了市場的採用。強大的資料管理、整合和分析策略的出現提供了巨大的潛在機會。
區域洞察
由於技術進步和消費者購買力,美洲在知識圖譜市場中佔有重要地位。公司正在進行研究和開發舉措,新技術專利正在激增。在EMEA地區,歐洲是知識圖譜市場的主要開拓基地。多項歐盟 (EU) 指令鼓勵使用知識圖譜技術來實現資料隱私合規性。另一方面,中東和非洲的知識圖譜市場仍不發達,但由於數位轉型措施和快速發展的高科技新興企業文化,特別是在這些國家,顯示出廣泛的成長潛力。亞太地區正快速崛起,成為知識圖譜市場的強大參與者。各國正利用科技來加強電子商務、醫療保健和通訊業的資料管理。此外,政府對促進創新和推動數位轉型的大力支持正在推動該地區知識圖譜市場的成長。
FPNV定位矩陣
FPNV定位矩陣對於評估知識圖譜市場至關重要。我們檢視與業務策略和產品滿意度相關的關鍵指標,以對供應商進行全面評估。這種深入的分析使用戶能夠根據自己的要求做出明智的決策。根據評估,供應商被分為四個成功程度不同的像限:前沿(F)、探路者(P)、利基(N)和重要(V)。
市場佔有率分析
市場佔有率分析是一個綜合工具,可以對知識圖譜市場中供應商的現狀進行深入而詳細的研究。全面比較和分析供應商在整體收益、基本客群和其他關鍵指標方面的貢獻,以便更好地了解公司的績效及其在爭奪市場佔有率時面臨的挑戰。此外,該分析還提供了對該行業競爭特徵的寶貴考察,包括在研究基準年觀察到的累積、分散主導地位和合併特徵等因素。這種詳細程度的提高使供應商能夠做出更明智的決策並制定有效的策略,從而在市場上獲得競爭優勢。
該報告對以下幾個方面提供了寶貴的見解:
1-市場滲透率:提供有關主要企業所服務的市場的全面資訊。
2-市場開拓:我們深入研究利潤豐厚的新興市場,並分析它們在成熟細分市場中的滲透率。
3- 市場多元化:提供有關新產品發布、開拓地區、最新發展和投資的詳細資訊。
4-競爭力評估與資訊:對主要企業的市場佔有率、策略、產品、認證、監管狀況、專利狀況、製造能力等進行全面評估。
5- 產品開發與創新:提供對未來技術、研發活動和突破性產品開發的見解。
本報告解決了以下關鍵問題:
1-知識圖譜市場的市場規模與預測是多少?
2-知識圖譜市場預測期間需要考慮投資的產品、細分市場、應用程式和領域有哪些?
3-知識圖譜市場的技術趨勢和法律規範是什麼?
4-知識圖譜市場主要廠商的市場佔有率是多少?
5-進入知識圖譜市場合適的型態或策略手段是什麼?
目錄
第1章 前言
第2章調查方法
第3章執行摘要
第4章市場概況
第5章市場洞察
- 市場動態
- 促進因素
- 對高效資料整合和有效資料管理的需求不斷成長
- 擴大知識圖譜在醫療保健領域的應用
- 知識圖譜在電子商務領域的使用正在迅速增加
- 抑制因素
- 熟練專業人員的可用性有限
- 機會
- 對先進分析工具的需求增加
- 繼續研究擴大知識圖的用途
- 任務
- 知識圖譜相關的資料隱私與安全問題
- 促進因素
- 市場區隔分析
- 提供:知識圖解決方案解決多層業務挑戰的潛在用途
- 類型:NLP知識圖譜利用自然語言處理的力量來解釋人類語言資料。
- 應用:知識圖譜在企業知識管理應用的採用率較高
- 垂直領域:醫療保健領域對知識圖譜的龐大需求
- 市場趨勢分析
- 高通膨的累積效應
- 波特五力分析
- 價值鍊和關鍵路徑分析
- 法律規範
第6章知識圖譜市場:透過提供
- 服務
- 管理服務
- 專業服務
- 解決方案
第7章知識圖譜市場:依類型
- 上下文豐富的知識圖譜
- 外部感知知識圖譜
- NLP知識圖譜
第8章依模型類型分類的知識圖譜市場
- 概念圖
- RDF圖
- 語意圖
第 9 章 知識圖譜市場資料來源
- 半結構化資料
- 結構化資料
- 非結構化資料
第10章知識圖譜市場:依應用分類
- 企業知識管理
- 問題解答
- 建議系統
- 語意搜尋
第11章知識圖譜市場:依產業分類
- BFSI
- 衛生保健
- 資訊科技與資訊科技服務
- 媒體和娛樂
- 零售與電子商務
- 運輸和物流
- 旅行和招待
第12章美洲知識圖譜市場
- 阿根廷
- 巴西
- 加拿大
- 墨西哥
- 美國
第13章亞太地區知識圖譜市場
- 澳洲
- 中國
- 印度
- 印尼
- 日本
- 馬來西亞
- 菲律賓
- 新加坡
- 韓國
- 台灣
- 泰國
- 越南
第14章歐洲、中東和非洲知識圖譜市場
- 丹麥
- 埃及
- 芬蘭
- 法國
- 德國
- 以色列
- 義大利
- 荷蘭
- 奈及利亞
- 挪威
- 波蘭
- 卡達
- 俄羅斯
- 沙烏地阿拉伯
- 南非
- 西班牙
- 瑞典
- 瑞士
- 土耳其
- 阿拉伯聯合大公國
- 英國
第15章競爭形勢
- FPNV定位矩陣
- 市場佔有率分析:主要企業
- 主要企業競爭情境分析
- 合約、合作和夥伴關係
- 新產品發布和功能增強
第16章競爭組合
- 主要公司簡介
- AllegroGraph by Franz Inc.
- Amazon Web Services, Inc.
- ArangoDB
- Cambridge Semantics, Inc.
- Datavid Limited
- Diffbot Technologies Corp.
- Fluree
- Franz Inc.
- Google LLC by Alphabet Inc.
- International Business Machines Corporation
- Microsoft Corporation
- Mitsubishi Electric Corporation
- Neo4j, Inc.
- Ontotext
- Oracle Corporation
- SciBite Limited
- Semantic Web Company
- Stardog Union
- TIBCO by Cloud Software Group, Inc.
- TigerGraph, Inc.
- XenonStack Pvt. Ltd.
- Yext, Inc.
- 主要產品系列
第17章附錄
- 討論指南
- 關於許可證和定價
[182 Pages Report] The Knowledge Graph Market size was estimated at USD 1.05 billion in 2023 and expected to reach USD 1.24 billion in 2024, at a CAGR 17.07% to reach USD 3.19 billion by 2030.
Global Knowledge Graph Market
| KEY MARKET STATISTICS | |
|---|---|
| Base Year [2023] | USD 1.05 billion |
| Estimated Year [2024] | USD 1.24 billion |
| Forecast Year [2030] | USD 3.19 billion |
| CAGR (%) | 17.07% |
A knowledge graph is a structured model of knowledge that incorporates entities, relationships, and attributes to create a semantic network. It is a way to organize and connect information in a manner easily computable and understandable by machines. Knowledge graphs play a crucial role in representing and organizing knowledge in a way that allows for efficient data retrieval, reasoning, and analysis. Factors influencing the market's growth entail increased demand for advanced analytics tools and soaring data generation. The rise is further driven by the growing need for businesses to offer improved customer satisfaction, seamless communication, and knowledge sharing. However, a lack of understanding about the benefits of knowledge graphs, the necessity for technically skilled professionals, and privacy concerns further hamper the market adoption. The emergence of powerful data management, integration, and analytics strategies offers great potential opportunities.
Regional Insights
The Americas have a significant landscape in the knowledge graph market owing to the region evinces substantial advancements in technology and strong consumer purchasing power. Firms have been engaging in research and development initiatives, confirmed by a surge in new patents in emerging technologies. In the EMEA region, Europe is the hub for major developments in the knowledge graph market. Several European Union directives encourage the use of knowledge graph technology for compliance with data privacy. Meanwhile, the Middle East and Africa, while still nascent in the knowledge graph market, show promising growth potential owing to the digital transformation initiatives and burgeoning tech startup culture, particularly in countries. The APAC region is rapidly emerging as a formidable player in the knowledge graph market, fueled by expansive technological advancements and swift digitalization across major economies. Countries are capitalizing on technology to strengthen data management in e-commerce, healthcare, and telecommunications industries. Moreover, robust support from governments to foster innovation and drive digital transformation bolstered this region's knowledge graph market growth.
FPNV Positioning Matrix
The FPNV Positioning Matrix is pivotal in evaluating the Knowledge Graph Market. It offers a comprehensive assessment of vendors, examining key metrics related to Business Strategy and Product Satisfaction. This in-depth analysis empowers users to make well-informed decisions aligned with their requirements. Based on the evaluation, the vendors are then categorized into four distinct quadrants representing varying levels of success: Forefront (F), Pathfinder (P), Niche (N), or Vital (V).
Market Share Analysis
The Market Share Analysis is a comprehensive tool that provides an insightful and in-depth examination of the current state of vendors in the Knowledge Graph Market. By meticulously comparing and analyzing vendor contributions in terms of overall revenue, customer base, and other key metrics, we can offer companies a greater understanding of their performance and the challenges they face when competing for market share. Additionally, this analysis provides valuable insights into the competitive nature of the sector, including factors such as accumulation, fragmentation dominance, and amalgamation traits observed over the base year period studied. With this expanded level of detail, vendors can make more informed decisions and devise effective strategies to gain a competitive edge in the market.
Key Company Profiles
The report delves into recent significant developments in the Knowledge Graph Market, highlighting leading vendors and their innovative profiles. These include AllegroGraph by Franz Inc., Amazon Web Services, Inc., ArangoDB, Cambridge Semantics, Inc., Datavid Limited, Diffbot Technologies Corp., Fluree, Franz Inc., Google LLC by Alphabet Inc., International Business Machines Corporation, Microsoft Corporation, Mitsubishi Electric Corporation, Neo4j, Inc., Ontotext, Oracle Corporation, SciBite Limited, Semantic Web Company, Stardog Union, TIBCO by Cloud Software Group, Inc., TigerGraph, Inc., XenonStack Pvt. Ltd., and Yext, Inc..
Market Segmentation & Coverage
This research report categorizes the Knowledge Graph Market to forecast the revenues and analyze trends in each of the following sub-markets:
- Offering
- Services
- Managed Services
- Professional Services
- Solutions
- Services
- Type
- Context-rich Knowledge Graphs
- External-sensing Knowledge Graphs
- NLP Knowledge Graphs
- Model Type
- Conceptual Graph
- RDF Graph
- Semantic Graph
- Data Source
- Semi-structured Data
- Structured Data
- Unstructured Data
- Application
- Enterprise Knowledge Management
- Question Answering
- Recommendation Systems
- Semantic Search
- Vertical
- BFSI
- Healthcare
- IT & ITES
- Media & Entertainment
- Retail & E-commerce
- Transportation & Logistics
- Travel & Hospitality
- Region
- Americas
- Argentina
- Brazil
- Canada
- Mexico
- United States
- California
- Florida
- Illinois
- New York
- Ohio
- Pennsylvania
- Texas
- Asia-Pacific
- Australia
- China
- India
- Indonesia
- Japan
- Malaysia
- Philippines
- Singapore
- South Korea
- Taiwan
- Thailand
- Vietnam
- Europe, Middle East & Africa
- Denmark
- Egypt
- Finland
- France
- Germany
- Israel
- Italy
- Netherlands
- Nigeria
- Norway
- Poland
- Qatar
- Russia
- Saudi Arabia
- South Africa
- Spain
- Sweden
- Switzerland
- Turkey
- United Arab Emirates
- United Kingdom
- Americas
The report offers valuable insights on the following aspects:
1. Market Penetration: It presents comprehensive information on the market provided by key players.
2. Market Development: It delves deep into lucrative emerging markets and analyzes the penetration across mature market segments.
3. Market Diversification: It provides detailed information on new product launches, untapped geographic regions, recent developments, and investments.
4. Competitive Assessment & Intelligence: It conducts an exhaustive assessment of market shares, strategies, products, certifications, regulatory approvals, patent landscape, and manufacturing capabilities of the leading players.
5. Product Development & Innovation: It offers intelligent insights on future technologies, R&D activities, and breakthrough product developments.
The report addresses key questions such as:
1. What is the market size and forecast of the Knowledge Graph Market?
2. Which products, segments, applications, and areas should one consider investing in over the forecast period in the Knowledge Graph Market?
3. What are the technology trends and regulatory frameworks in the Knowledge Graph Market?
4. What is the market share of the leading vendors in the Knowledge Graph Market?
5. Which modes and strategic moves are suitable for entering the Knowledge Graph Market?
Table of Contents
1. Preface
- 1.1. Objectives of the Study
- 1.2. Market Segmentation & Coverage
- 1.3. Years Considered for the Study
- 1.4. Currency & Pricing
- 1.5. Language
- 1.6. Limitations
- 1.7. Assumptions
- 1.8. Stakeholders
2. Research Methodology
- 2.1. Define: Research Objective
- 2.2. Determine: Research Design
- 2.3. Prepare: Research Instrument
- 2.4. Collect: Data Source
- 2.5. Analyze: Data Interpretation
- 2.6. Formulate: Data Verification
- 2.7. Publish: Research Report
- 2.8. Repeat: Report Update
3. Executive Summary
4. Market Overview
- 4.1. Introduction
- 4.2. Knowledge Graph Market, by Region
5. Market Insights
- 5.1. Market Dynamics
- 5.1.1. Drivers
- 5.1.1.1. Growing demand for efficient data integration and effective data management
- 5.1.1.2. Expanding applications of knowledge graph in healthcare
- 5.1.1.3. Proliferating use of knowledge graphs in eCommerce sector
- 5.1.2. Restraints
- 5.1.2.1. Limited availability of skilled professionals
- 5.1.3. Opportunities
- 5.1.3.1. Increased demand for advanced analytics tools
- 5.1.3.2. Ongoing research to expand use of knowledge graph
- 5.1.4. Challenges
- 5.1.4.1. Data privacy and security concerns associated with knowledge graph
- 5.1.1. Drivers
- 5.2. Market Segmentation Analysis
- 5.2.1. Offering: Potential use of knowledge graph solutions to address multi-layered business challenges
- 5.2.2. Type: NLP knowledge graphs leverage the prowess of Natural Language Processing to interpret human language data
- 5.2.3. Application: High adoption of knowledge graph in enterprise knowledge management applications
- 5.2.4. Vertical: Significant demand for knowledge graph in the healthcare sector
- 5.3. Market Trend Analysis
- 5.4. Cumulative Impact of High Inflation
- 5.5. Porter's Five Forces Analysis
- 5.5.1. Threat of New Entrants
- 5.5.2. Threat of Substitutes
- 5.5.3. Bargaining Power of Customers
- 5.5.4. Bargaining Power of Suppliers
- 5.5.5. Industry Rivalry
- 5.6. Value Chain & Critical Path Analysis
- 5.7. Regulatory Framework
6. Knowledge Graph Market, by Offering
- 6.1. Introduction
- 6.2. Services
- 6.3.1. Managed Services
- 6.3.2. Professional Services
- 6.3. Solutions
7. Knowledge Graph Market, by Type
- 7.1. Introduction
- 7.2. Context-rich Knowledge Graphs
- 7.3. External-sensing Knowledge Graphs
- 7.4. NLP Knowledge Graphs
8. Knowledge Graph Market, by Model Type
- 8.1. Introduction
- 8.2. Conceptual Graph
- 8.3. RDF Graph
- 8.4. Semantic Graph
9. Knowledge Graph Market, by Data Source
- 9.1. Introduction
- 9.2. Semi-structured Data
- 9.3. Structured Data
- 9.4. Unstructured Data
10. Knowledge Graph Market, by Application
- 10.1. Introduction
- 10.2. Enterprise Knowledge Management
- 10.3. Question Answering
- 10.4. Recommendation Systems
- 10.5. Semantic Search
11. Knowledge Graph Market, by Vertical
- 11.1. Introduction
- 11.2. BFSI
- 11.3. Healthcare
- 11.4. IT & ITES
- 11.5. Media & Entertainment
- 11.6. Retail & E-commerce
- 11.7. Transportation & Logistics
- 11.8. Travel & Hospitality
12. Americas Knowledge Graph Market
- 12.1. Introduction
- 12.2. Argentina
- 12.3. Brazil
- 12.4. Canada
- 12.5. Mexico
- 12.6. United States
13. Asia-Pacific Knowledge Graph Market
- 13.1. Introduction
- 13.2. Australia
- 13.3. China
- 13.4. India
- 13.5. Indonesia
- 13.6. Japan
- 13.7. Malaysia
- 13.8. Philippines
- 13.9. Singapore
- 13.10. South Korea
- 13.11. Taiwan
- 13.12. Thailand
- 13.13. Vietnam
14. Europe, Middle East & Africa Knowledge Graph Market
- 14.1. Introduction
- 14.2. Denmark
- 14.3. Egypt
- 14.4. Finland
- 14.5. France
- 14.6. Germany
- 14.7. Israel
- 14.8. Italy
- 14.9. Netherlands
- 14.10. Nigeria
- 14.11. Norway
- 14.12. Poland
- 14.13. Qatar
- 14.14. Russia
- 14.15. Saudi Arabia
- 14.16. South Africa
- 14.17. Spain
- 14.18. Sweden
- 14.19. Switzerland
- 14.20. Turkey
- 14.21. United Arab Emirates
- 14.22. United Kingdom
15. Competitive Landscape
- 15.1. FPNV Positioning Matrix
- 15.2. Market Share Analysis, By Key Player
- 15.3. Competitive Scenario Analysis, By Key Player
- 15.3.1. Agreement, Collaboration, & Partnership
- 15.3.1.1. Ontotext and Ontopic Join Forces to Revolutionize Data Virtualization
- 15.3.2. New Product Launch & Enhancement
- 15.3.2.1. Foursquare Launches its Geospatial Knowledge Graph
- 15.3.2.2. Kobai Launches Saturn Knowledge Graph to Query Data at Lakehouse Scale
- 15.3.1. Agreement, Collaboration, & Partnership
16. Competitive Portfolio
- 16.1. Key Company Profiles
- 16.1.1. AllegroGraph by Franz Inc.
- 16.1.2. Amazon Web Services, Inc.
- 16.1.3. ArangoDB
- 16.1.4. Cambridge Semantics, Inc.
- 16.1.5. Datavid Limited
- 16.1.6. Diffbot Technologies Corp.
- 16.1.7. Fluree
- 16.1.8. Franz Inc.
- 16.1.9. Google LLC by Alphabet Inc.
- 16.1.10. International Business Machines Corporation
- 16.1.11. Microsoft Corporation
- 16.1.12. Mitsubishi Electric Corporation
- 16.1.13. Neo4j, Inc.
- 16.1.14. Ontotext
- 16.1.15. Oracle Corporation
- 16.1.16. SciBite Limited
- 16.1.17. Semantic Web Company
- 16.1.18. Stardog Union
- 16.1.19. TIBCO by Cloud Software Group, Inc.
- 16.1.20. TigerGraph, Inc.
- 16.1.21. XenonStack Pvt. Ltd.
- 16.1.22. Yext, Inc.
- 16.2. Key Product Portfolio
17. Appendix
- 17.1. Discussion Guide
- 17.2. License & Pricing
LIST OF FIGURES
- FIGURE 1. KNOWLEDGE GRAPH MARKET RESEARCH PROCESS
- FIGURE 2. KNOWLEDGE GRAPH MARKET SIZE, 2023 VS 2030
- FIGURE 3. KNOWLEDGE GRAPH MARKET SIZE, 2018-2030 (USD MILLION)
- FIGURE 4. KNOWLEDGE GRAPH MARKET SIZE, BY REGION, 2023 VS 2030 (%)
- FIGURE 5. KNOWLEDGE GRAPH MARKET SIZE, BY REGION, 2023 VS 2024 VS 2030 (USD MILLION)
- FIGURE 6. KNOWLEDGE GRAPH MARKET DYNAMICS
- FIGURE 7. KNOWLEDGE GRAPH MARKET SIZE, BY OFFERING, 2023 VS 2030 (%)
- FIGURE 8. KNOWLEDGE GRAPH MARKET SIZE, BY OFFERING, 2023 VS 2024 VS 2030 (USD MILLION)
- FIGURE 9. KNOWLEDGE GRAPH MARKET SIZE, BY TYPE, 2023 VS 2030 (%)
- FIGURE 10. KNOWLEDGE GRAPH MARKET SIZE, BY TYPE, 2023 VS 2024 VS 2030 (USD MILLION)
- FIGURE 11. KNOWLEDGE GRAPH MARKET SIZE, BY MODEL TYPE, 2023 VS 2030 (%)
- FIGURE 12. KNOWLEDGE GRAPH MARKET SIZE, BY MODEL TYPE, 2023 VS 2024 VS 2030 (USD MILLION)
- FIGURE 13. KNOWLEDGE GRAPH MARKET SIZE, BY DATA SOURCE, 2023 VS 2030 (%)
- FIGURE 14. KNOWLEDGE GRAPH MARKET SIZE, BY DATA SOURCE, 2023 VS 2024 VS 2030 (USD MILLION)
- FIGURE 15. KNOWLEDGE GRAPH MARKET SIZE, BY APPLICATION, 2023 VS 2030 (%)
- FIGURE 16. KNOWLEDGE GRAPH MARKET SIZE, BY APPLICATION, 2023 VS 2024 VS 2030 (USD MILLION)
- FIGURE 17. KNOWLEDGE GRAPH MARKET SIZE, BY VERTICAL, 2023 VS 2030 (%)
- FIGURE 18. KNOWLEDGE GRAPH MARKET SIZE, BY VERTICAL, 2023 VS 2024 VS 2030 (USD MILLION)
- FIGURE 19. AMERICAS KNOWLEDGE GRAPH MARKET SIZE, BY COUNTRY, 2023 VS 2030 (%)
- FIGURE 20. AMERICAS KNOWLEDGE GRAPH MARKET SIZE, BY COUNTRY, 2023 VS 2024 VS 2030 (USD MILLION)
- FIGURE 21. UNITED STATES KNOWLEDGE GRAPH MARKET SIZE, BY STATE, 2023 VS 2030 (%)
- FIGURE 22. UNITED STATES KNOWLEDGE GRAPH MARKET SIZE, BY STATE, 2023 VS 2024 VS 2030 (USD MILLION)
- FIGURE 23. ASIA-PACIFIC KNOWLEDGE GRAPH MARKET SIZE, BY COUNTRY, 2023 VS 2030 (%)
- FIGURE 24. ASIA-PACIFIC KNOWLEDGE GRAPH MARKET SIZE, BY COUNTRY, 2023 VS 2024 VS 2030 (USD MILLION)
- FIGURE 25. EUROPE, MIDDLE EAST & AFRICA KNOWLEDGE GRAPH MARKET SIZE, BY COUNTRY, 2023 VS 2030 (%)
- FIGURE 26. EUROPE, MIDDLE EAST & AFRICA KNOWLEDGE GRAPH MARKET SIZE, BY COUNTRY, 2023 VS 2024 VS 2030 (USD MILLION)
- FIGURE 27. KNOWLEDGE GRAPH MARKET, FPNV POSITIONING MATRIX, 2023
- FIGURE 28. KNOWLEDGE GRAPH MARKET SHARE, BY KEY PLAYER, 2023
LIST OF TABLES
- TABLE 1. KNOWLEDGE GRAPH MARKET SEGMENTATION & COVERAGE
- TABLE 2. UNITED STATES DOLLAR EXCHANGE RATE, 2018-2023
- TABLE 3. KNOWLEDGE GRAPH MARKET SIZE, 2018-2030 (USD MILLION)
- TABLE 4. GLOBAL KNOWLEDGE GRAPH MARKET SIZE, BY REGION, 2018-2030 (USD MILLION)
- TABLE 5. KNOWLEDGE GRAPH MARKET SIZE, BY OFFERING, 2018-2030 (USD MILLION)
- TABLE 6. KNOWLEDGE GRAPH MARKET SIZE, BY SERVICES, BY REGION, 2018-2030 (USD MILLION)
- TABLE 7. KNOWLEDGE GRAPH MARKET SIZE, BY SERVICES, 2018-2030 (USD MILLION)
- TABLE 8. KNOWLEDGE GRAPH MARKET SIZE, BY MANAGED SERVICES, BY REGION, 2018-2030 (USD MILLION)
- TABLE 9. KNOWLEDGE GRAPH MARKET SIZE, BY PROFESSIONAL SERVICES, BY REGION, 2018-2030 (USD MILLION)
- TABLE 10. KNOWLEDGE GRAPH MARKET SIZE, BY SOLUTIONS, BY REGION, 2018-2030 (USD MILLION)
- TABLE 11. KNOWLEDGE GRAPH MARKET SIZE, BY TYPE, 2018-2030 (USD MILLION)
- TABLE 12. KNOWLEDGE GRAPH MARKET SIZE, BY CONTEXT-RICH KNOWLEDGE GRAPHS, BY REGION, 2018-2030 (USD MILLION)
- TABLE 13. KNOWLEDGE GRAPH MARKET SIZE, BY EXTERNAL-SENSING KNOWLEDGE GRAPHS, BY REGION, 2018-2030 (USD MILLION)
- TABLE 14. KNOWLEDGE GRAPH MARKET SIZE, BY NLP KNOWLEDGE GRAPHS, BY REGION, 2018-2030 (USD MILLION)
- TABLE 15. KNOWLEDGE GRAPH MARKET SIZE, BY MODEL TYPE, 2018-2030 (USD MILLION)
- TABLE 16. KNOWLEDGE GRAPH MARKET SIZE, BY CONCEPTUAL GRAPH, BY REGION, 2018-2030 (USD MILLION)
- TABLE 17. KNOWLEDGE GRAPH MARKET SIZE, BY RDF GRAPH, BY REGION, 2018-2030 (USD MILLION)
- TABLE 18. KNOWLEDGE GRAPH MARKET SIZE, BY SEMANTIC GRAPH, BY REGION, 2018-2030 (USD MILLION)
- TABLE 19. KNOWLEDGE GRAPH MARKET SIZE, BY DATA SOURCE, 2018-2030 (USD MILLION)
- TABLE 20. KNOWLEDGE GRAPH MARKET SIZE, BY SEMI-STRUCTURED DATA, BY REGION, 2018-2030 (USD MILLION)
- TABLE 21. KNOWLEDGE GRAPH MARKET SIZE, BY STRUCTURED DATA, BY REGION, 2018-2030 (USD MILLION)
- TABLE 22. KNOWLEDGE GRAPH MARKET SIZE, BY UNSTRUCTURED DATA, BY REGION, 2018-2030 (USD MILLION)
- TABLE 23. KNOWLEDGE GRAPH MARKET SIZE, BY APPLICATION, 2018-2030 (USD MILLION)
- TABLE 24. KNOWLEDGE GRAPH MARKET SIZE, BY ENTERPRISE KNOWLEDGE MANAGEMENT, BY REGION, 2018-2030 (USD MILLION)
- TABLE 25. KNOWLEDGE GRAPH MARKET SIZE, BY QUESTION ANSWERING, BY REGION, 2018-2030 (USD MILLION)
- TABLE 26. KNOWLEDGE GRAPH MARKET SIZE, BY RECOMMENDATION SYSTEMS, BY REGION, 2018-2030 (USD MILLION)
- TABLE 27. KNOWLEDGE GRAPH MARKET SIZE, BY SEMANTIC SEARCH, BY REGION, 2018-2030 (USD MILLION)
- TABLE 28. KNOWLEDGE GRAPH MARKET SIZE, BY VERTICAL, 2018-2030 (USD MILLION)
- TABLE 29. KNOWLEDGE GRAPH MARKET SIZE, BY BFSI, BY REGION, 2018-2030 (USD MILLION)
- TABLE 30. KNOWLEDGE GRAPH MARKET SIZE, BY HEALTHCARE, BY REGION, 2018-2030 (USD MILLION)
- TABLE 31. KNOWLEDGE GRAPH MARKET SIZE, BY IT & ITES, BY REGION, 2018-2030 (USD MILLION)
- TABLE 32. KNOWLEDGE GRAPH MARKET SIZE, BY MEDIA & ENTERTAINMENT, BY REGION, 2018-2030 (USD MILLION)
- TABLE 33. KNOWLEDGE GRAPH MARKET SIZE, BY RETAIL & E-COMMERCE, BY REGION, 2018-2030 (USD MILLION)
- TABLE 34. KNOWLEDGE GRAPH MARKET SIZE, BY TRANSPORTATION & LOGISTICS, BY REGION, 2018-2030 (USD MILLION)
- TABLE 35. KNOWLEDGE GRAPH MARKET SIZE, BY TRAVEL & HOSPITALITY, BY REGION, 2018-2030 (USD MILLION)
- TABLE 36. AMERICAS KNOWLEDGE GRAPH MARKET SIZE, BY OFFERING, 2018-2030 (USD MILLION)
- TABLE 37. AMERICAS KNOWLEDGE GRAPH MARKET SIZE, BY SERVICES, 2018-2030 (USD MILLION)
- TABLE 38. AMERICAS KNOWLEDGE GRAPH MARKET SIZE, BY TYPE, 2018-2030 (USD MILLION)
- TABLE 39. AMERICAS KNOWLEDGE GRAPH MARKET SIZE, BY MODEL TYPE, 2018-2030 (USD MILLION)
- TABLE 40. AMERICAS KNOWLEDGE GRAPH MARKET SIZE, BY DATA SOURCE, 2018-2030 (USD MILLION)
- TABLE 41. AMERICAS KNOWLEDGE GRAPH MARKET SIZE, BY APPLICATION, 2018-2030 (USD MILLION)
- TABLE 42. AMERICAS KNOWLEDGE GRAPH MARKET SIZE, BY VERTICAL, 2018-2030 (USD MILLION)
- TABLE 43. AMERICAS KNOWLEDGE GRAPH MARKET SIZE, BY COUNTRY, 2018-2030 (USD MILLION)
- TABLE 44. ARGENTINA KNOWLEDGE GRAPH MARKET SIZE, BY OFFERING, 2018-2030 (USD MILLION)
- TABLE 45. ARGENTINA KNOWLEDGE GRAPH MARKET SIZE, BY SERVICES, 2018-2030 (USD MILLION)
- TABLE 46. ARGENTINA KNOWLEDGE GRAPH MARKET SIZE, BY TYPE, 2018-2030 (USD MILLION)
- TABLE 47. ARGENTINA KNOWLEDGE GRAPH MARKET SIZE, BY MODEL TYPE, 2018-2030 (USD MILLION)
- TABLE 48. ARGENTINA KNOWLEDGE GRAPH MARKET SIZE, BY DATA SOURCE, 2018-2030 (USD MILLION)
- TABLE 49. ARGENTINA KNOWLEDGE GRAPH MARKET SIZE, BY APPLICATION, 2018-2030 (USD MILLION)
- TABLE 50. ARGENTINA KNOWLEDGE GRAPH MARKET SIZE, BY VERTICAL, 2018-2030 (USD MILLION)
- TABLE 51. BRAZIL KNOWLEDGE GRAPH MARKET SIZE, BY OFFERING, 2018-2030 (USD MILLION)
- TABLE 52. BRAZIL KNOWLEDGE GRAPH MARKET SIZE, BY SERVICES, 2018-2030 (USD MILLION)
- TABLE 53. BRAZIL KNOWLEDGE GRAPH MARKET SIZE, BY TYPE, 2018-2030 (USD MILLION)
- TABLE 54. BRAZIL KNOWLEDGE GRAPH MARKET SIZE, BY MODEL TYPE, 2018-2030 (USD MILLION)
- TABLE 55. BRAZIL KNOWLEDGE GRAPH MARKET SIZE, BY DATA SOURCE, 2018-2030 (USD MILLION)
- TABLE 56. BRAZIL KNOWLEDGE GRAPH MARKET SIZE, BY APPLICATION, 2018-2030 (USD MILLION)
- TABLE 57. BRAZIL KNOWLEDGE GRAPH MARKET SIZE, BY VERTICAL, 2018-2030 (USD MILLION)
- TABLE 58. CANADA KNOWLEDGE GRAPH MARKET SIZE, BY OFFERING, 2018-2030 (USD MILLION)
- TABLE 59. CANADA KNOWLEDGE GRAPH MARKET SIZE, BY SERVICES, 2018-2030 (USD MILLION)
- TABLE 60. CANADA KNOWLEDGE GRAPH MARKET SIZE, BY TYPE, 2018-2030 (USD MILLION)
- TABLE 61. CANADA KNOWLEDGE GRAPH MARKET SIZE, BY MODEL TYPE, 2018-2030 (USD MILLION)
- TABLE 62. CANADA KNOWLEDGE GRAPH MARKET SIZE, BY DATA SOURCE, 2018-2030 (USD MILLION)
- TABLE 63. CANADA KNOWLEDGE GRAPH MARKET SIZE, BY APPLICATION, 2018-2030 (USD MILLION)
- TABLE 64. CANADA KNOWLEDGE GRAPH MARKET SIZE, BY VERTICAL, 2018-2030 (USD MILLION)
- TABLE 65. MEXICO KNOWLEDGE GRAPH MARKET SIZE, BY OFFERING, 2018-2030 (USD MILLION)
- TABLE 66. MEXICO KNOWLEDGE GRAPH MARKET SIZE, BY SERVICES, 2018-2030 (USD MILLION)
- TABLE 67. MEXICO KNOWLEDGE GRAPH MARKET SIZE, BY TYPE, 2018-2030 (USD MILLION)
- TABLE 68. MEXICO KNOWLEDGE GRAPH MARKET SIZE, BY MODEL TYPE, 2018-2030 (USD MILLION)
- TABLE 69. MEXICO KNOWLEDGE GRAPH MARKET SIZE, BY DATA SOURCE, 2018-2030 (USD MILLION)
- TABLE 70. MEXICO KNOWLEDGE GRAPH MARKET SIZE, BY APPLICATION, 2018-2030 (USD MILLION)
- TABLE 71. MEXICO KNOWLEDGE GRAPH MARKET SIZE, BY VERTICAL, 2018-2030 (USD MILLION)
- TABLE 72. UNITED STATES KNOWLEDGE GRAPH MARKET SIZE, BY OFFERING, 2018-2030 (USD MILLION)
- TABLE 73. UNITED STATES KNOWLEDGE GRAPH MARKET SIZE, BY SERVICES, 2018-2030 (USD MILLION)
- TABLE 74. UNITED STATES KNOWLEDGE GRAPH MARKET SIZE, BY TYPE, 2018-2030 (USD MILLION)
- TABLE 75. UNITED STATES KNOWLEDGE GRAPH MARKET SIZE, BY MODEL TYPE, 2018-2030 (USD MILLION)
- TABLE 76. UNITED STATES KNOWLEDGE GRAPH MARKET SIZE, BY DATA SOURCE, 2018-2030 (USD MILLION)
- TABLE 77. UNITED STATES KNOWLEDGE GRAPH MARKET SIZE, BY APPLICATION, 2018-2030 (USD MILLION)
- TABLE 78. UNITED STATES KNOWLEDGE GRAPH MARKET SIZE, BY VERTICAL, 2018-2030 (USD MILLION)
- TABLE 79. UNITED STATES KNOWLEDGE GRAPH MARKET SIZE, BY STATE, 2018-2030 (USD MILLION)
- TABLE 80. ASIA-PACIFIC KNOWLEDGE GRAPH MARKET SIZE, BY OFFERING, 2018-2030 (USD MILLION)
- TABLE 81. ASIA-PACIFIC KNOWLEDGE GRAPH MARKET SIZE, BY SERVICES, 2018-2030 (USD MILLION)
- TABLE 82. ASIA-PACIFIC KNOWLEDGE GRAPH MARKET SIZE, BY TYPE, 2018-2030 (USD MILLION)
- TABLE 83. ASIA-PACIFIC KNOWLEDGE GRAPH MARKET SIZE, BY MODEL TYPE, 2018-2030 (USD MILLION)
- TABLE 84. ASIA-PACIFIC KNOWLEDGE GRAPH MARKET SIZE, BY DATA SOURCE, 2018-2030 (USD MILLION)
- TABLE 85. ASIA-PACIFIC KNOWLEDGE GRAPH MARKET SIZE, BY APPLICATION, 2018-2030 (USD MILLION)
- TABLE 86. ASIA-PACIFIC KNOWLEDGE GRAPH MARKET SIZE, BY VERTICAL, 2018-2030 (USD MILLION)
- TABLE 87. ASIA-PACIFIC KNOWLEDGE GRAPH MARKET SIZE, BY COUNTRY, 2018-2030 (USD MILLION)
- TABLE 88. AUSTRALIA KNOWLEDGE GRAPH MARKET SIZE, BY OFFERING, 2018-2030 (USD MILLION)
- TABLE 89. AUSTRALIA KNOWLEDGE GRAPH MARKET SIZE, BY SERVICES, 2018-2030 (USD MILLION)
- TABLE 90. AUSTRALIA KNOWLEDGE GRAPH MARKET SIZE, BY TYPE, 2018-2030 (USD MILLION)
- TABLE 91. AUSTRALIA KNOWLEDGE GRAPH MARKET SIZE, BY MODEL TYPE, 2018-2030 (USD MILLION)
- TABLE 92. AUSTRALIA KNOWLEDGE GRAPH MARKET SIZE, BY DATA SOURCE, 2018-2030 (USD MILLION)
- TABLE 93. AUSTRALIA KNOWLEDGE GRAPH MARKET SIZE, BY APPLICATION, 2018-2030 (USD MILLION)
- TABLE 94. AUSTRALIA KNOWLEDGE GRAPH MARKET SIZE, BY VERTICAL, 2018-2030 (USD MILLION)
- TABLE 95. CHINA KNOWLEDGE GRAPH MARKET SIZE, BY OFFERING, 2018-2030 (USD MILLION)
- TABLE 96. CHINA KNOWLEDGE GRAPH MARKET SIZE, BY SERVICES, 2018-2030 (USD MILLION)
- TABLE 97. CHINA KNOWLEDGE GRAPH MARKET SIZE, BY TYPE, 2018-2030 (USD MILLION)
- TABLE 98. CHINA KNOWLEDGE GRAPH MARKET SIZE, BY MODEL TYPE, 2018-2030 (USD MILLION)
- TABLE 99. CHINA KNOWLEDGE GRAPH MARKET SIZE, BY DATA SOURCE, 2018-2030 (USD MILLION)
- TABLE 100. CHINA KNOWLEDGE GRAPH MARKET SIZE, BY APPLICATION, 2018-2030 (USD MILLION)
- TABLE 101. CHINA KNOWLEDGE GRAPH MARKET SIZE, BY VERTICAL, 2018-2030 (USD MILLION)
- TABLE 102. INDIA KNOWLEDGE GRAPH MARKET SIZE, BY OFFERING, 2018-2030 (USD MILLION)
- TABLE 103. INDIA KNOWLEDGE GRAPH MARKET SIZE, BY SERVICES, 2018-2030 (USD MILLION)
- TABLE 104. INDIA KNOWLEDGE GRAPH MARKET SIZE, BY TYPE, 2018-2030 (USD MILLION)
- TABLE 105. INDIA KNOWLEDGE GRAPH MARKET SIZE, BY MODEL TYPE, 2018-2030 (USD MILLION)
- TABLE 106. INDIA KNOWLEDGE GRAPH MARKET SIZE, BY DATA SOURCE, 2018-2030 (USD MILLION)
- TABLE 107. INDIA KNOWLEDGE GRAPH MARKET SIZE, BY APPLICATION, 2018-2030 (USD MILLION)
- TABLE 108. INDIA KNOWLEDGE GRAPH MARKET SIZE, BY VERTICAL, 2018-2030 (USD MILLION)
- TABLE 109. INDONESIA KNOWLEDGE GRAPH MARKET SIZE, BY OFFERING, 2018-2030 (USD MILLION)
- TABLE 110. INDONESIA KNOWLEDGE GRAPH MARKET SIZE, BY SERVICES, 2018-2030 (USD MILLION)
- TABLE 111. INDONESIA KNOWLEDGE GRAPH MARKET SIZE, BY TYPE, 2018-2030 (USD MILLION)
- TABLE 112. INDONESIA KNOWLEDGE GRAPH MARKET SIZE, BY MODEL TYPE, 2018-2030 (USD MILLION)
- TABLE 113. INDONESIA KNOWLEDGE GRAPH MARKET SIZE, BY DATA SOURCE, 2018-2030 (USD MILLION)
- TABLE 114. INDONESIA KNOWLEDGE GRAPH MARKET SIZE, BY APPLICATION, 2018-2030 (USD MILLION)
- TABLE 115. INDONESIA KNOWLEDGE GRAPH MARKET SIZE, BY VERTICAL, 2018-2030 (USD MILLION)
- TABLE 116. JAPAN KNOWLEDGE GRAPH MARKET SIZE, BY OFFERING, 2018-2030 (USD MILLION)
- TABLE 117. JAPAN KNOWLEDGE GRAPH MARKET SIZE, BY SERVICES, 2018-2030 (USD MILLION)
- TABLE 118. JAPAN KNOWLEDGE GRAPH MARKET SIZE, BY TYPE, 2018-2030 (USD MILLION)
- TABLE 119. JAPAN KNOWLEDGE GRAPH MARKET SIZE, BY MODEL TYPE, 2018-2030 (USD MILLION)
- TABLE 120. JAPAN KNOWLEDGE GRAPH MARKET SIZE, BY DATA SOURCE, 2018-2030 (USD MILLION)
- TABLE 121. JAPAN KNOWLEDGE GRAPH MARKET SIZE, BY APPLICATION, 2018-2030 (USD MILLION)
- TABLE 122. JAPAN KNOWLEDGE GRAPH MARKET SIZE, BY VERTICAL, 2018-2030 (USD MILLION)
- TABLE 123. MALAYSIA KNOWLEDGE GRAPH MARKET SIZE, BY OFFERING, 2018-2030 (USD MILLION)
- TABLE 124. MALAYSIA KNOWLEDGE GRAPH MARKET SIZE, BY SERVICES, 2018-2030 (USD MILLION)
- TABLE 125. MALAYSIA KNOWLEDGE GRAPH MARKET SIZE, BY TYPE, 2018-2030 (USD MILLION)
- TABLE 126. MALAYSIA KNOWLEDGE GRAPH MARKET SIZE, BY MODEL TYPE, 2018-2030 (USD MILLION)
- TABLE 127. MALAYSIA KNOWLEDGE GRAPH MARKET SIZE, BY DATA SOURCE, 2018-2030 (USD MILLION)
- TABLE 128. MALAYSIA KNOWLEDGE GRAPH MARKET SIZE, BY APPLICATION, 2018-2030 (USD MILLION)
- TABLE 129. MALAYSIA KNOWLEDGE GRAPH MARKET SIZE, BY VERTICAL, 2018-2030 (USD MILLION)
- TABLE 130. PHILIPPINES KNOWLEDGE GRAPH MARKET SIZE, BY OFFERING, 2018-2030 (USD MILLION)
- TABLE 131. PHILIPPINES KNOWLEDGE GRAPH MARKET SIZE, BY SERVICES, 2018-2030 (USD MILLION)
- TABLE 132. PHILIPPINES KNOWLEDGE GRAPH MARKET SIZE, BY TYPE, 2018-2030 (USD MILLION)
- TABLE 133. PHILIPPINES KNOWLEDGE GRAPH MARKET SIZE, BY MODEL TYPE, 2018-2030 (USD MILLION)
- TABLE 134. PHILIPPINES KNOWLEDGE GRAPH MARKET SIZE, BY DATA SOURCE, 2018-2030 (USD MILLION)
- TABLE 135. PHILIPPINES KNOWLEDGE GRAPH MARKET SIZE, BY APPLICATION, 2018-2030 (USD MILLION)
- TABLE 136. PHILIPPINES KNOWLEDGE GRAPH MARKET SIZE, BY VERTICAL, 2018-2030 (USD MILLION)
- TABLE 137. SINGAPORE KNOWLEDGE GRAPH MARKET SIZE, BY OFFERING, 2018-2030 (USD MILLION)
- TABLE 138. SINGAPORE KNOWLEDGE GRAPH MARKET SIZE, BY SERVICES, 2018-2030 (USD MILLION)
- TABLE 139. SINGAPORE KNOWLEDGE GRAPH MARKET SIZE, BY TYPE, 2018-2030 (USD MILLION)
- TABLE 140. SINGAPORE KNOWLEDGE GRAPH MARKET SIZE, BY MODEL TYPE, 2018-2030 (USD MILLION)
- TABLE 141. SINGAPORE KNOWLEDGE GRAPH MARKET SIZE, BY DATA SOURCE, 2018-2030 (USD MILLION)
- TABLE 142. SINGAPORE KNOWLEDGE GRAPH MARKET SIZE, BY APPLICATION, 2018-2030 (USD MILLION)
- TABLE 143. SINGAPORE KNOWLEDGE GRAPH MARKET SIZE, BY VERTICAL, 2018-2030 (USD MILLION)
- TABLE 144. SOUTH KOREA KNOWLEDGE GRAPH MARKET SIZE, BY OFFERING, 2018-2030 (USD MILLION)
- TABLE 145. SOUTH KOREA KNOWLEDGE GRAPH MARKET SIZE, BY SERVICES, 2018-2030 (USD MILLION)
- TABLE 146. SOUTH KOREA KNOWLEDGE GRAPH MARKET SIZE, BY TYPE, 2018-2030 (USD MILLION)
- TABLE 147. SOUTH KOREA KNOWLEDGE GRAPH MARKET SIZE, BY MODEL TYPE, 2018-2030 (USD MILLION)
- TABLE 148. SOUTH KOREA KNOWLEDGE GRAPH MARKET SIZE, BY DATA SOURCE, 2018-2030 (USD MILLION)
- TABLE 149. SOUTH KOREA KNOWLEDGE GRAPH MARKET SIZE, BY APPLICATION, 2018-2030 (USD MILLION)
- TABLE 150. SOUTH KOREA KNOWLEDGE GRAPH MARKET SIZE, BY VERTICAL, 2018-2030 (USD MILLION)
- TABLE 151. TAIWAN KNOWLEDGE GRAPH MARKET SIZE, BY OFFERING, 2018-2030 (USD MILLION)
- TABLE 152. TAIWAN KNOWLEDGE GRAPH MARKET SIZE, BY SERVICES, 2018-2030 (USD MILLION)
- TABLE 153. TAIWAN KNOWLEDGE GRAPH MARKET SIZE, BY TYPE, 2018-2030 (USD MILLION)
- TABLE 154. TAIWAN KNOWLEDGE GRAPH MARKET SIZE, BY MODEL TYPE, 2018-2030 (USD MILLION)
- TABLE 155. TAIWAN KNOWLEDGE GRAPH MARKET SIZE, BY DATA SOURCE, 2018-2030 (USD MILLION)
- TABLE 156. TAIWAN KNOWLEDGE GRAPH MARKET SIZE, BY APPLICATION, 2018-2030 (USD MILLION)
- TABLE 157. TAIWAN KNOWLEDGE GRAPH MARKET SIZE, BY VERTICAL, 2018-2030 (USD MILLION)
- TABLE 158. THAILAND KNOWLEDGE GRAPH MARKET SIZE, BY OFFERING, 2018-2030 (USD MILLION)
- TABLE 159. THAILAND KNOWLEDGE GRAPH MARKET SIZE, BY SERVICES, 2018-2030 (USD MILLION)
- TABLE 160. THAILAND KNOWLEDGE GRAPH MARKET SIZE, BY TYPE, 2018-2030 (USD MILLION)
- TABLE 161. THAILAND KNOWLEDGE GRAPH MARKET SIZE, BY MODEL TYPE, 2018-2030 (USD MILLION)
- TABLE 162. THAILAND KNOWLEDGE GRAPH MARKET SIZE, BY DATA SOURCE, 2018-2030 (USD MILLION)
- TABLE 163. THAILAND KNOWLEDGE GRAPH MARKET SIZE, BY APPLICATION, 2018-2030 (USD MILLION)
- TABLE 164. THAILAND KNOWLEDGE GRAPH MARKET SIZE, BY VERTICAL, 2018-2030 (USD MILLION)
- TABLE 165. VIETNAM KNOWLEDGE GRAPH MARKET SIZE, BY OFFERING, 2018-2030 (USD MILLION)
- TABLE 166. VIETNAM KNOWLEDGE GRAPH MARKET SIZE, BY SERVICES, 2018-2030 (USD MILLION)
- TABLE 167. VIETNAM KNOWLEDGE GRAPH MARKET SIZE, BY TYPE, 2018-2030 (USD MILLION)
- TABLE 168. VIETNAM KNOWLEDGE GRAPH MARKET SIZE, BY MODEL TYPE, 2018-2030 (USD MILLION)
- TABLE 169. VIETNAM KNOWLEDGE GRAPH MARKET SIZE, BY DATA SOURCE, 2018-2030 (USD MILLION)
- TABLE 170. VIETNAM KNOWLEDGE GRAPH MARKET SIZE, BY APPLICATION, 2018-2030 (USD MILLION)
- TABLE 171. VIETNAM KNOWLEDGE GRAPH MARKET SIZE, BY VERTICAL, 2018-2030 (USD MILLION)
- TABLE 172. EUROPE, MIDDLE EAST & AFRICA KNOWLEDGE GRAPH MARKET SIZE, BY OFFERING, 2018-2030 (USD MILLION)
- TABLE 173. EUROPE, MIDDLE EAST & AFRICA KNOWLEDGE GRAPH MARKET SIZE, BY SERVICES, 2018-2030 (USD MILLION)
- TABLE 174. EUROPE, MIDDLE EAST & AFRICA KNOWLEDGE GRAPH MARKET SIZE, BY TYPE, 2018-2030 (USD MILLION)
- TABLE 175. EUROPE, MIDDLE EAST & AFRICA KNOWLEDGE GRAPH MARKET SIZE, BY MODEL TYPE, 2018-2030 (USD MILLION)
- TABLE 176. EUROPE, MIDDLE EAST & AFRICA KNOWLEDGE GRAPH MARKET SIZE, BY DATA SOURCE, 2018-2030 (USD MILLION)
- TABLE 177. EUROPE, MIDDLE EAST & AFRICA KNOWLEDGE GRAPH MARKET SIZE, BY APPLICATION, 2018-2030 (USD MILLION)
- TABLE 178. EUROPE, MIDDLE EAST & AFRICA KNOWLEDGE GRAPH MARKET SIZE, BY VERTICAL, 2018-2030 (USD MILLION)
- TABLE 179. EUROPE, MIDDLE EAST & AFRICA KNOWLEDGE GRAPH MARKET SIZE, BY COUNTRY, 2018-2030 (USD MILLION)
- TABLE 180. DENMARK KNOWLEDGE GRAPH MARKET SIZE, BY OFFERING, 2018-2030 (USD MILLION)
- TABLE 181. DENMARK KNOWLEDGE GRAPH MARKET SIZE, BY SERVICES, 2018-2030 (USD MILLION)
- TABLE 182. DENMARK KNOWLEDGE GRAPH MARKET SIZE, BY TYPE, 2018-2030 (USD MILLION)
- TABLE 183. DENMARK KNOWLEDGE GRAPH MARKET SIZE, BY MODEL TYPE, 2018-2030 (USD MILLION)
- TABLE 184. DENMARK KNOWLEDGE GRAPH MARKET SIZE, BY DATA SOURCE, 2018-2030 (USD MILLION)
- TABLE 185. DENMARK KNOWLEDGE GRAPH MARKET SIZE, BY APPLICATION, 2018-2030 (USD MILLION)
- TABLE 186. DENMARK KNOWLEDGE GRAPH MARKET SIZE, BY VERTICAL, 2018-2030 (USD MILLION)
- TABLE 187. EGYPT KNOWLEDGE GRAPH MARKET SIZE, BY OFFERING, 2018-2030 (USD MILLION)
- TABLE 188. EGYPT KNOWLEDGE GRAPH MARKET SIZE, BY SERVICES, 2018-2030 (USD MILLION)
- TABLE 189. EGYPT KNOWLEDGE GRAPH MARKET SIZE, BY TYPE, 2018-2030 (USD MILLION)
- TABLE 190. EGYPT KNOWLEDGE GRAPH MARKET SIZE, BY MODEL TYPE, 2018-2030 (USD MILLION)
- TABLE 191. EGYPT KNOWLEDGE GRAPH MARKET SIZE, BY DATA SOURCE, 2018-2030 (USD MILLION)
- TABLE 192. EGYPT KNOWLEDGE GRAPH MARKET SIZE, BY APPLICATION, 2018-2030 (USD MILLION)
- TABLE 193. EGYPT KNOWLEDGE GRAPH MARKET SIZE, BY VERTICAL, 2018-2030 (USD MILLION)
- TABLE 194. FINLAND KNOWLEDGE GRAPH MARKET SIZE, BY OFFERING, 2018-2030 (USD MILLION)
- TABLE 195. FINLAND KNOWLEDGE GRAPH MARKET SIZE, BY SERVICES, 2018-2030 (USD MILLION)
- TABLE 196. FINLAND KNOWLEDGE GRAPH MARKET SIZE, BY TYPE, 2018-2030 (USD MILLION)
- TABLE 197. FINLAND KNOWLEDGE GRAPH MARKET SIZE, BY MODEL TYPE, 2018-2030 (USD MILLION)
- TABLE 198. FINLAND KNOWLEDGE GRAPH MARKET SIZE, BY DATA SOURCE, 2018-2030 (USD MILLION)
- TABLE 199. FINLAND KNOWLEDGE GRAPH MARKET SIZE, BY APPLICATION, 2018-2030 (USD MILLION)
- TABLE 200. FINLAND KNOWLEDGE GRAPH MARKET SIZE, BY VERTICAL, 2018-2030 (USD MILLION)
- TABLE 201. FRANCE KNOWLEDGE GRAPH MARKET SIZE, BY OFFERING, 2018-2030 (USD MILLION)
- TABLE 202. FRANCE KNOWLEDGE GRAPH MARKET SIZE, BY SERVICES, 2018-2030 (USD MILLION)
- TABLE 203. FRANCE KNOWLEDGE GRAPH MARKET SIZE, BY TYPE, 2018-2030 (USD MILLION)
- TABLE 204. FRANCE KNOWLEDGE GRAPH MARKET SIZE, BY MODEL TYPE, 2018-2030 (USD MILLION)
- TABLE 205. FRANCE KNOWLEDGE GRAPH MARKET SIZE, BY DATA SOURCE, 2018-2030 (USD MILLION)
- TABLE 206. FRANCE KNOWLEDGE GRAPH MARKET SIZE, BY APPLICATION, 2018-2030 (USD MILLION)
- TABLE 207. FRANCE KNOWLEDGE GRAPH MARKET SIZE, BY VERTICAL, 2018-2030 (USD MILLION)
- TABLE 208. GERMANY KNOWLEDGE GRAPH MARKET SIZE, BY OFFERING, 2018-2030 (USD MILLION)
- TABLE 209. GERMANY KNOWLEDGE GRAPH MARKET SIZE, BY SERVICES, 2018-2030 (USD MILLION)
- TABLE 210. GERMANY KNOWLEDGE GRAPH MARKET SIZE, BY TYPE, 2018-2030 (USD MILLION)
- TABLE 211. GERMANY KNOWLEDGE GRAPH MARKET SIZE, BY MODEL TYPE, 2018-2030 (USD MILLION)
- TABLE 212. GERMANY KNOWLEDGE GRAPH MARKET SIZE, BY DATA SOURCE, 2018-2030 (USD MILLION)
- TABLE 213. GERMANY KNOWLEDGE GRAPH MARKET SIZE, BY APPLICATION, 2018-2030 (USD MILLION)
- TABLE 214. GERMANY KNOWLEDGE GRAPH MARKET SIZE, BY VERTICAL, 2018-2030 (USD MILLION)
- TABLE 215. ISRAEL KNOWLEDGE GRAPH MARKET SIZE, BY OFFERING, 2018-2030 (USD MILLION)
- TABLE 216. ISRAEL KNOWLEDGE GRAPH MARKET SIZE, BY SERVICES, 2018-2030 (USD MILLION)
- TABLE 217. ISRAEL KNOWLEDGE GRAPH MARKET SIZE, BY TYPE, 2018-2030 (USD MILLION)
- TABLE 218. ISRAEL KNOWLEDGE GRAPH MARKET SIZE, BY MODEL TYPE, 2018-2030 (USD MILLION)
- TABLE 219. ISRAEL KNOWLEDGE GRAPH MARKET SIZE, BY DATA SOURCE, 2018-2030 (USD MILLION)
- TABLE 220. ISRAEL KNOWLEDGE GRAPH MARKET SIZE, BY APPLICATION, 2018-2030 (USD MILLION)
- TABLE 221. ISRAEL KNOWLEDGE GRAPH MARKET SIZE, BY VERTICAL, 2018-2030 (USD MILLION)
- TABLE 222. ITALY KNOWLEDGE GRAPH MARKET SIZE, BY OFFERING, 2018-2030 (USD MILLION)
- TABLE 223. ITALY KNOWLEDGE GRAPH MARKET SIZE, BY SERVICES, 2018-2030 (USD MILLION)
- TABLE 224. ITALY KNOWLEDGE GRAPH MARKET SIZE, BY TYPE, 2018-2030 (USD MILLION)
- TABLE 225. ITALY KNOWLEDGE GRAPH MARKET SIZE, BY MODEL TYPE, 2018-2030 (USD MILLION)
- TABLE 226. ITALY KNOWLEDGE GRAPH MARKET SIZE, BY DATA SOURCE, 2018-2030 (USD MILLION)
- TABLE 227. ITALY KNOWLEDGE GRAPH MARKET SIZE, BY APPLICATION, 2018-2030 (USD MILLION)
- TABLE 228. ITALY KNOWLEDGE GRAPH MARKET SIZE, BY VERTICAL, 2018-2030 (USD MILLION)
- TABLE 229. NETHERLANDS KNOWLEDGE GRAPH MARKET SIZE, BY OFFERING, 2018-2030 (USD MILLION)
- TABLE 230. NETHERLANDS KNOWLEDGE GRAPH MARKET SIZE, BY SERVICES, 2018-2030 (USD MILLION)
- TABLE 231. NETHERLANDS KNOWLEDGE GRAPH MARKET SIZE, BY TYPE, 2018-2030 (USD MILLION)
- TABLE 232. NETHERLANDS KNOWLEDGE GRAPH MARKET SIZE, BY MODEL TYPE, 2018-2030 (USD MILLION)
- TABLE 233. NETHERLANDS KNOWLEDGE GRAPH MARKET SIZE, BY DATA SOURCE, 2018-2030 (USD MILLION)
- TABLE 234. NETHERLANDS KNOWLEDGE GRAPH MARKET SIZE, BY APPLICATION, 2018-2030 (USD MILLION)
- TABLE 235. NETHERLANDS KNOWLEDGE GRAPH MARKET SIZE, BY VERTICAL, 2018-2030 (USD MILLION)
- TABLE 236. NIGERIA KNOWLEDGE GRAPH MARKET SIZE, BY OFFERING, 2018-2030 (USD MILLION)
- TABLE 237. NIGERIA KNOWLEDGE GRAPH MARKET SIZE, BY SERVICES, 2018-2030 (USD MILLION)
- TABLE 238. NIGERIA KNOWLEDGE GRAPH MARKET SIZE, BY TYPE, 2018-2030 (USD MILLION)
- TABLE 239. NIGERIA KNOWLEDGE GRAPH MARKET SIZE, BY MODEL TYPE, 2018-2030 (USD MILLION)
- TABLE 240. NIGERIA KNOWLEDGE GRAPH MARKET SIZE, BY DATA SOURCE, 2018-2030 (USD MILLION)
- TABLE 241. NIGERIA KNOWLEDGE GRAPH MARKET SIZE, BY APPLICATION, 2018-2030 (USD MILLION)
- TABLE 242. NIGERIA KNOWLEDGE GRAPH MARKET SIZE, BY VERTICAL, 2018-2030 (USD MILLION)
- TABLE 243. NORWAY KNOWLEDGE GRAPH MARKET SIZE, BY OFFERING, 2018-2030 (USD MILLION)
- TABLE 244. NORWAY KNOWLEDGE GRAPH MARKET SIZE, BY SERVICES, 2018-2030 (USD MILLION)
- TABLE 245. NORWAY KNOWLEDGE GRAPH MARKET SIZE, BY TYPE, 2018-2030 (USD MILLION)
- TABLE 246. NORWAY KNOWLEDGE GRAPH MARKET SIZE, BY MODEL TYPE, 2018-2030 (USD MILLION)
- TABLE 247. NORWAY KNOWLEDGE GRAPH MARKET SIZE, BY DATA SOURCE, 2018-2030 (USD MILLION)
- TABLE 248. NORWAY KNOWLEDGE GRAPH MARKET SIZE, BY APPLICATION, 2018-2030 (USD MILLION)
- TABLE 249. NORWAY KNOWLEDGE GRAPH MARKET SIZE, BY VERTICAL, 2018-2030 (USD MILLION)
- TABLE 250. POLAND KNOWLEDGE GRAPH MARKET SIZE, BY OFFERING, 2018-2030 (USD MILLION)
- TABLE 251. POLAND KNOWLEDGE GRAPH MARKET SIZE, BY SERVICES, 2018-2030 (USD MILLION)
- TABLE 252. POLAND KNOWLEDGE GRAPH MARKET SIZE, BY TYPE, 2018-2030 (USD MILLION)
- TABLE 253. POLAND KNOWLEDGE GRAPH MARKET SIZE, BY MODEL TYPE, 2018-2030 (USD MILLION)
- TABLE 254. POLAND KNOWLEDGE GRAPH MARKET SIZE, BY DATA SOURCE, 2018-2030 (USD MILLION)
- TABLE 255. POLAND KNOWLEDGE GRAPH MARKET SIZE, BY APPLICATION, 2018-2030 (USD MILLION)
- TABLE 256. POLAND KNOWLEDGE GRAPH MARKET SIZE, BY VERTICAL, 2018-2030 (USD MILLION)
- TABLE 257. QATAR KNOWLEDGE GRAPH MARKET SIZE, BY OFFERING, 2018-2030 (USD MILLION)
- TABLE 258. QATAR KNOWLEDGE GRAPH MARKET SIZE, BY SERVICES, 2018-2030 (USD MILLION)
- TABLE 259. QATAR KNOWLEDGE GRAPH MARKET SIZE, BY TYPE, 2018-2030 (USD MILLION)
- TABLE 260. QATAR KNOWLEDGE GRAPH MARKET SIZE, BY MODEL TYPE, 2018-2030 (USD MILLION)
- TABLE 261. QATAR KNOWLEDGE GRAPH MARKET SIZE, BY DATA SOURCE, 2018-2030 (USD MILLION)
- TABLE 262. QATAR KNOWLEDGE GRAPH MARKET SIZE, BY APPLICATION, 2018-2030 (USD MILLION)
- TABLE 263. QATAR KNOWLEDGE GRAPH MARKET SIZE, BY VERTICAL, 2018-2030 (USD MILLION)
- TABLE 264. RUSSIA KNOWLEDGE GRAPH MARKET SIZE, BY OFFERING, 2018-2030 (USD MILLION)
- TABLE 265. RUSSIA KNOWLEDGE GRAPH MARKET SIZE, BY SERVICES, 2018-2030 (USD MILLION)
- TABLE 266. RUSSIA KNOWLEDGE GRAPH MARKET SIZE, BY TYPE, 2018-2030 (USD MILLION)
- TABLE 267. RUSSIA KNOWLEDGE GRAPH MARKET SIZE, BY MODEL TYPE, 2018-2030 (USD MILLION)
- TABLE 268. RUSSIA KNOWLEDGE GRAPH MARKET SIZE, BY DATA SOURCE, 2018-2030 (USD MILLION)
- TABLE 269. RUSSIA KNOWLEDGE GRAPH MARKET SIZE, BY APPLICATION, 2018-2030 (USD MILLION)
- TABLE 270. RUSSIA KNOWLEDGE GRAPH MARKET SIZE, BY VERTICAL, 2018-2030 (USD MILLION)
- TABLE 271. SAUDI ARABIA KNOWLEDGE GRAPH MARKET SIZE, BY OFFERING, 2018-2030 (USD MILLION)
- TABLE 272. SAUDI ARABIA KNOWLEDGE GRAPH MARKET SIZE, BY SERVICES, 2018-2030 (USD MILLION)
- TABLE 273. SAUDI ARABIA KNOWLEDGE GRAPH MARKET SIZE, BY TYPE, 2018-2030 (USD MILLION)
- TABLE 274. SAUDI ARABIA KNOWLEDGE GRAPH MARKET SIZE, BY MODEL TYPE, 2018-2030 (USD MILLION)
- TABLE 275. SAUDI ARABIA KNOWLEDGE GRAPH MARKET SIZE, BY DATA SOURCE, 2018-2030 (USD MILLION)
- TABLE 276. SAUDI ARABIA KNOWLEDGE GRAPH MARKET SIZE, BY APPLICATION, 2018-2030 (USD MILLION)
- TABLE 277. SAUDI ARABIA KNOWLEDGE GRAPH MARKET SIZE, BY VERTICAL, 2018-2030 (USD MILLION)
- TABLE 278. SOUTH AFRICA KNOWLEDGE GRAPH MARKET SIZE, BY OFFERING, 2018-2030 (USD MILLION)
- TABLE 279. SOUTH AFRICA KNOWLEDGE GRAPH MARKET SIZE, BY SERVICES, 2018-2030 (USD MILLION)
- TABLE 280. SOUTH AFRICA KNOWLEDGE GRAPH MARKET SIZE, BY TYPE, 2018-2030 (USD MILLION)
- TABLE 281. SOUTH AFRICA KNOWLEDGE GRAPH MARKET SIZE, BY MODEL TYPE, 2018-2030 (USD MILLION)
- TABLE 282. SOUTH AFRICA KNOWLEDGE GRAPH MARKET SIZE, BY DATA SOURCE, 2018-2030 (USD MILLION)
- TABLE 283. SOUTH AFRICA KNOWLEDGE GRAPH MARKET SIZE, BY APPLICATION, 2018-2030 (USD MILLION)
- TABLE 284. SOUTH AFRICA KNOWLEDGE GRAPH MARKET SIZE, BY VERTICAL, 2018-2030 (USD MILLION)
- TABLE 285. SPAIN KNOWLEDGE GRAPH MARKET SIZE, BY OFFERING, 2018-2030 (USD MILLION)
- TABLE 286. SPAIN KNOWLEDGE GRAPH MARKET SIZE, BY SERVICES, 2018-2030 (USD MILLION)
- TABLE 287. SPAIN KNOWLEDGE GRAPH MARKET SIZE, BY TYPE, 2018-2030 (USD MILLION)
- TABLE 288. SPAIN KNOWLEDGE GRAPH MARKET SIZE, BY MODEL TYPE, 2018-2030 (USD MILLION)
- TABLE 289. SPAIN KNOWLEDGE GRAPH MARKET SIZE, BY DATA SOURCE, 2018-2030 (USD MILLION)
- TABLE 290. SPAIN KNOWLEDGE GRAPH MARKET SIZE, BY APPLICATION, 2018-2030 (USD MILLION)
- TABLE 291. SPAIN KNOWLEDGE GRAPH MARKET SIZE, BY VERTICAL, 2018-2030 (USD MILLION)
- TABLE 292. SWEDEN KNOWLEDGE GRAPH MARKET SIZE, BY OFFERING, 2018-2030 (USD MILLION)
- TABLE 293. SWEDEN KNOWLEDGE GRAPH MARKET SIZE, BY SERVICES, 2018-2030 (USD MILLION)
- TABLE 294. SWEDEN KNOWLEDGE GRAPH MARKET SIZE, BY TYPE, 2018-2030 (USD MILLION)
- TABLE 295. SWEDEN KNOWLEDGE GRAPH MARKET SIZE, BY MODEL TYPE, 2018-2030 (USD MILLION)
- TABLE 296. SWEDEN KNOWLEDGE GRAPH MARKET SIZE, BY DATA SOURCE, 2018-2030 (USD MILLION)
- TABLE 297. SWEDEN KNOWLEDGE GRAPH MARKET SIZE, BY APPLICATION, 2018-2030 (USD MILLION)
- TABLE 298. SWEDEN KNOWLEDGE GRAPH MARKET SIZE, BY VERTICAL, 2018-2030 (USD MILLION)
- TABLE 299. SWITZERLAND KNOWLEDGE GRAPH MARKET SIZE, BY OFFERING, 2018-2030 (USD MILLION)
- TABLE 300. SWITZERLAND KNOWLEDGE GRAPH MARKET SIZE, BY SERVICES, 2018-2030 (USD MILLION)
- TABLE 301. SWITZERLAND KNOWLEDGE GRAPH MARKET SIZE, BY TYPE, 2018-2030 (USD MILLION)
- TABLE 302. SWITZERLAND KNOWLEDGE GRAPH MARKET SIZE, BY MODEL TYPE, 2018-2030 (USD MILLION)
- TABLE 303. SWITZERLAND KNOWLEDGE GRAPH MARKET SIZE, BY DATA SOURCE, 2018-2030 (USD MILLION)
- TABLE 304. SWITZERLAND KNOWLEDGE GRAPH MARKET SIZE, BY APPLICATION, 2018-2030 (USD MILLION)
- TABLE 305. SWITZERLAND KNOWLEDGE GRAPH MARKET SIZE, BY VERTICAL, 2018-2030 (USD MILLION)
- TABLE 306. TURKEY KNOWLEDGE GRAPH MARKET SIZE, BY OFFERING, 2018-2030 (USD MILLION)
- TABLE 307. TURKEY KNOWLEDGE GRAPH MARKET SIZE, BY SERVICES, 2018-2030 (USD MILLION)
- TABLE 308. TURKEY KNOWLEDGE GRAPH MARKET SIZE, BY TYPE, 2018-2030 (USD MILLION)
- TABLE 309. TURKEY KNOWLEDGE GRAPH MARKET SIZE, BY MODEL TYPE, 2018-2030 (USD MILLION)
- TABLE 310. TURKEY KNOWLEDGE GRAPH MARKET SIZE, BY DATA SOURCE, 2018-2030 (USD MILLION)
- TABLE 311. TURKEY KNOWLEDGE GRAPH MARKET SIZE, BY APPLICATION, 2018-2030 (USD MILLION)
- TABLE 312. TURKEY KNOWLEDGE GRAPH MARKET SIZE, BY VERTICAL, 2018-2030 (USD MILLION)
- TABLE 313. UNITED ARAB EMIRATES KNOWLEDGE GRAPH MARKET SIZE, BY OFFERING, 2018-2030 (USD MILLION)
- TABLE 314. UNITED ARAB EMIRATES KNOWLEDGE GRAPH MARKET SIZE, BY SERVICES, 2018-2030 (USD MILLION)
- TABLE 315. UNITED ARAB EMIRATES KNOWLEDGE GRAPH MARKET SIZE, BY TYPE, 2018-2030 (USD MILLION)
- TABLE 316. UNITED ARAB EMIRATES KNOWLEDGE GRAPH MARKET SIZE, BY MODEL TYPE, 2018-2030 (USD MILLION)
- TABLE 317. UNITED ARAB EMIRATES KNOWLEDGE GRAPH MARKET SIZE, BY DATA SOURCE, 2018-2030 (USD MILLION)
- TABLE 318. UNITED ARAB EMIRATES KNOWLEDGE GRAPH MARKET SIZE, BY APPLICATION, 2018-2030 (USD MILLION)
- TABLE 319. UNITED ARAB EMIRATES KNOWLEDGE GRAPH MARKET SIZE, BY VERTICAL, 2018-2030 (USD MILLION)
- TABLE 320. UNITED KINGDOM KNOWLEDGE GRAPH MARKET SIZE, BY OFFERING, 2018-2030 (USD MILLION)
- TABLE 321. UNITED KINGDOM KNOWLEDGE GRAPH MARKET SIZE, BY SERVICES, 2018-2030 (USD MILLION)
- TABLE 322. UNITED KINGDOM KNOWLEDGE GRAPH MARKET SIZE, BY TYPE, 2018-2030 (USD MILLION)
- TABLE 323. UNITED KINGDOM KNOWLEDGE GRAPH MARKET SIZE, BY MODEL TYPE, 2018-2030 (USD MILLION)
- TABLE 324. UNITED KINGDOM KNOWLEDGE GRAPH MARKET SIZE, BY DATA SOURCE, 2018-2030 (USD MILLION)
- TABLE 325. UNITED KINGDOM KNOWLEDGE GRAPH MARKET SIZE, BY APPLICATION, 2018-2030 (USD MILLION)
- TABLE 326. UNITED KINGDOM KNOWLEDGE GRAPH MARKET SIZE, BY VERTICAL, 2018-2030 (USD MILLION)
- TABLE 327. KNOWLEDGE GRAPH MARKET, FPNV POSITIONING MATRIX, 2023
- TABLE 328. KNOWLEDGE GRAPH MARKET SHARE, BY KEY PLAYER, 2023
- TABLE 329. KNOWLEDGE GRAPH MARKET LICENSE & PRICING
 語意知識圖譜2024年全球市場報告
 搜尋引擎全球市場規模、佔有率、成長分析(按類型、最終用戶)- 產業預測,2024-2031 年
 下一代搜尋引擎:市場佔有率分析、產業趨勢與統計、2024年至2029年成長預測
 全球下一代搜尋引擎市場 2023-2030
 2024-2028 年全球企業搜尋市場
 全球知識圖譜市場 - 2023-2030
 2024 年網路搜尋入口網站全球市場報告
 下一代搜尋引擎市場:2023-2028 年全球產業趨勢、佔有率、規模、成長、機會與預測
 知識圖市場規模、按任務類型、按資料來源、按組織規模、應用程式、類型、最終用途、預測 2023 - 2032 年
 全球知識圖譜市場:按產品、按資料來源、按行業、按模型類型、按應用、按類型、按地區 - 預測到 2028 年