


 |
市場調查報告書
商品編碼
1381188
攜帶式藍牙音箱市場:按類型、應用、分佈分類 - 2023-2030 年全球預測Portable Bluetooth Speaker Market by Type (Car Speaker, Outdoor Bluetooth Speaker, Pocket Speaker), Application (Commercial, Personal), Distribution - Global Forecast 2023-2030 |
||||||
※ 本網頁內容可能與最新版本有所差異。詳細情況請與我們聯繫。
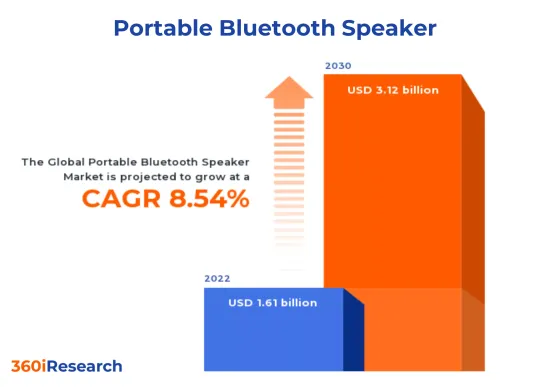
攜帶式藍牙揚聲器市場預計將從 2022 年的 16.1 億美元增加到 2030 年的 31.2 億美元,預測期內年複合成長率為 8.54%。
攜帶式藍牙揚聲器的全球市場
| 主要市場統計 | |
|---|---|
| 市場金額:基準年 [2022] | 16.1億美元 |
| 預計市場金額[2023] | 17.4億美元 |
| 預計市場金額[2030] | 31.2億美元 |
| 年複合成長率(%) | 8.54% |
FPNV定位矩陣
FPNV定位矩陣是評估攜帶式藍牙音箱市場的重要工具。透過分析與業務策略和產品滿意度相關的關鍵指標來全面評估供應商。這使得使用者能夠根據自己的具體資訊做出明智的決策。進階分析將供應商分為四個像限,每個象限都有不同程度的成功:前沿 (F)、探路者 (P)、利基 (N) 和重要 (V)。這個富有洞察力的框架使決策者能夠充滿信心地駕馭市場。
市場佔有率分析
市場佔有率分析為供應商的市場形勢提供了寶貴的見解。評估對整體收益、客戶群和其他關鍵指標的影響可以全面了解公司的業績及其面臨的競爭環境。該分析還揭示了研究期間的競爭水平,例如市場佔有率成長、碎片化、主導地位和行業整合。
該報告對以下幾個方面提供了寶貴的見解:
1.市場滲透:提供有關市場動態和主要企業產品的全面資訊。
2. 市場開拓:詳細分析新興和成熟細分市場的滲透情況,以突顯利潤豐厚的商機。
3. 市場多元化:有關新產品發布、開拓地區、最新發展和投資的詳細資訊。
4.競爭評估與資訊:對主要企業的市場佔有率、策略、產品、認證、法規狀況、專利狀況、製造能力等進行綜合評估。
5. 產品開發與創新:對未來技術、研發活動和突破性產品開發的智慧洞察。
本報告解決了以下關鍵問題:
1. 攜帶式藍牙音箱市場規模及預測是多少?
2. 攜帶式藍牙音箱市場中哪些產品、細分市場、應用和領域具有最高的投資潛力?
3.攜帶式藍牙音箱市場的競爭策略視窗有哪些?
4.攜帶式藍牙音箱市場的最新技術趨勢和法律規範是什麼?
5.攜帶式藍牙音箱市場主要廠商的市場佔有率是多少?
6.進入攜帶式藍牙音箱市場的合適型態和策略手段是什麼?
目錄
第1章 前言
第2章 調查方法
第3章 執行摘要
第4章 市場概況
第5章 市場洞察
- 市場動態
- 促進因素
- 音樂和播客在世界各地越來越受歡迎
- 對便利無線藍牙音箱的需求
- 休閒的增加和支援 Wi-Fi 的藍牙揚聲器的採用
- 抑制因素
- 攜帶式藍牙音箱價格昂貴
- 機會
- 攜帶式藍牙揚聲器技術的進步
- 攜帶式藍牙音箱在電商平台上的供貨情況
- 任務
- 資料安全問題與技術問題
- 促進因素
- 市場區隔分析
- 市場趨勢分析
- 高通膨的累積效應
- 波特五力分析
- 價值鍊和關鍵路徑分析
- 法律規範
第6章 攜帶式藍牙音箱市場:按類型
- 汽車揚聲器
- 戶外藍牙音箱
- 袖珍音箱
第7章 攜帶式藍牙音箱市場:依應用分類
- 商業的
- 個人的
第8章 攜帶式藍牙音箱市場分佈
- 離線
- 線上的
第9章 美洲攜帶式藍牙音箱市場
- 阿根廷
- 巴西
- 加拿大
- 墨西哥
- 美國
第10章 亞太地區攜帶式藍牙音箱市場
- 澳洲
- 中國
- 印度
- 印尼
- 日本
- 馬來西亞
- 菲律賓
- 新加坡
- 韓國
- 台灣
- 泰國
- 越南
第11章歐洲/中東/非洲攜帶式藍牙音箱市場
- 丹麥
- 埃及
- 芬蘭
- 法國
- 德國
- 以色列
- 義大利
- 荷蘭
- 奈及利亞
- 挪威
- 波蘭
- 卡達
- 俄羅斯
- 沙烏地阿拉伯
- 南非
- 西班牙
- 瑞典
- 瑞士
- 土耳其
- 阿拉伯聯合大公國
- 英國
第12章競爭形勢
- FPNV定位矩陣
- 市場佔有率分析:主要企業
- 主要企業競爭情境分析
第13章競爭產品組合
- 主要公司簡介
- Able Systems Limited
- Beijing Spirit Technology Development Co., Ltd.(SPRT)
- Bixolon Co., Ltd.
- Brother International Corporation
- Canon Inc.
- CognitiveTPG by Blue Edge Technology
- Dell Technologies, Inc.
- Eastman Kodak Company
- Fujitsu Limited
- Guangzhou Winprt Technology Co., Ltd.
- Honeywell International Inc.
- HP Inc.
- Lexmark International, Inc.
- Polaroid International BV
- Ricoh Company, Ltd.
- Samsung Electronics Co. Ltd.
- SATO Holdings Corporation
- Seiko Epson Corporation
- Sharp Electronics Corporation
- Star Micronics Co. Ltd.
- Toshiba Corporation
- Xiamen YAEN Electronic Technology Co., Ltd.
- Xiaomi Corporation
- Zebra Technologies Corporation
- 主要產品系列
第14章附錄
- 討論指南
- 關於許可證和定價
The Portable Bluetooth Speaker Market is projected to reach USD 3.12 billion by 2030 from USD 1.61 billion in 2022, at a CAGR of 8.54% during the forecast period.
Global Portable Bluetooth Speaker Market
| KEY MARKET STATISTICS | |
|---|---|
| Base Year Value [2022] | USD 1.61 billion |
| Estimated Year Value [2023] | USD 1.74 billion |
| Forecast Year Value [2030] | USD 3.12 billion |
| CAGR (%) | 8.54% |
Market Segmentation & Coverage:
This research report analyzes various sub-markets, forecasts revenues, and examines emerging trends in each category to provide a comprehensive outlook on the Portable Bluetooth Speaker Market.
Based on Type, market is studied across Car Speaker, Outdoor Bluetooth Speaker, and Pocket Speaker. The Outdoor Bluetooth Speaker is projected to witness significant market share during forecast period.
Based on Application, market is studied across Commercial and Personal. The Commercial is projected to witness significant market share during forecast period.
Based on Distribution, market is studied across Offline and Online. The Offline is projected to witness significant market share during forecast period.
Based on Region, market is studied across Americas, Asia-Pacific, and Europe, Middle East & Africa. The Americas is further studied across Argentina, Brazil, Canada, Mexico, and United States. The United States is further studied across California, Florida, Illinois, New York, Ohio, Pennsylvania, and Texas. The Asia-Pacific is further studied across Australia, China, India, Indonesia, Japan, Malaysia, Philippines, Singapore, South Korea, Taiwan, Thailand, and Vietnam. The Europe, Middle East & Africa is further studied across Denmark, Egypt, Finland, France, Germany, Israel, Italy, Netherlands, Nigeria, Norway, Poland, Qatar, Russia, Saudi Arabia, South Africa, Spain, Sweden, Switzerland, Turkey, United Arab Emirates, and United Kingdom. The Asia-Pacific is projected to witness significant market share during forecast period.
Market Statistics:
The report provides market sizing and forecasts across 7 major currencies - USD, EUR, JPY, GBP, AUD, CAD, and CHF; multiple currency support helps organization leaders to make well-informed decisions. In this report, 2018 to 2021 are considered as historical years, 2022 is base year, 2023 is estimated year, and years from 2024 to 2030 are considered as forecast period.
FPNV Positioning Matrix:
The FPNV Positioning Matrix is an indispensable tool for assessing the Portable Bluetooth Speaker Market. It comprehensively evaluates vendors, analyzing key metrics related to Business Strategy and Product Satisfaction. This enables users to make informed decisions tailored to their specific needs. Through advanced analysis, vendors are categorized into four distinct quadrants, each representing a different level of success: Forefront (F), Pathfinder (P), Niche (N), or Vital (V). Be assured that this insightful framework empowers decision-makers to navigate the market with confidence.
Market Share Analysis:
The Market Share Analysis offers invaluable insights into the vendor landscape Portable Bluetooth Speaker Market. By evaluating their impact on overall revenue, customer base, and other key metrics, we provide companies with a comprehensive understanding of their performance and the competitive environment they confront. This analysis also uncovers the level of competition in terms of market share acquisition, fragmentation, dominance, and industry consolidation during the study period.
Key Company Profiles:
The report delves into recent significant developments in the Portable Bluetooth Speaker Market, highlighting leading vendors and their innovative profiles. These include Able Systems Limited, Beijing Spirit Technology Development Co., Ltd.(SPRT), Bixolon Co., Ltd., Brother International Corporation, Canon Inc., CognitiveTPG by Blue Edge Technology, Dell Technologies, Inc., Eastman Kodak Company, Fujitsu Limited, Guangzhou Winprt Technology Co., Ltd., Honeywell International Inc., HP Inc., Lexmark International, Inc., Polaroid International B.V., Ricoh Company, Ltd., Samsung Electronics Co. Ltd., SATO Holdings Corporation, Seiko Epson Corporation, Sharp Electronics Corporation, Star Micronics Co. Ltd., Toshiba Corporation, Xiamen YAEN Electronic Technology Co., Ltd., Xiaomi Corporation, and Zebra Technologies Corporation.
The report offers valuable insights on the following aspects:
1. Market Penetration: It provides comprehensive information about key players' market dynamics and offerings.
2. Market Development: In-depth analysis of emerging markets and penetration across mature market segments, highlighting lucrative opportunities.
3. Market Diversification: Detailed information about new product launches, untapped geographies, recent developments, and investments.
4. Competitive Assessment & Intelligence: Exhaustive assessment of market shares, strategies, products, certifications, regulatory approvals, patent landscape, and manufacturing capabilities of leading players.
5. Product Development & Innovation: Intelligent insights on future technologies, R&D activities, and breakthrough product developments.
The report addresses key questions such as:
1. What is the market size and forecast for the Portable Bluetooth Speaker Market?
2. Which products, segments, applications, and areas hold the highest investment potential in the Portable Bluetooth Speaker Market?
3. What is the competitive strategic window for identifying opportunities in the Portable Bluetooth Speaker Market?
4. What are the latest technology trends and regulatory frameworks in the Portable Bluetooth Speaker Market?
5. What is the market share of the leading vendors in the Portable Bluetooth Speaker Market?
6. Which modes and strategic moves are suitable for entering the Portable Bluetooth Speaker Market?
Table of Contents
1. Preface
- 1.1. Objectives of the Study
- 1.2. Market Segmentation & Coverage
- 1.3. Years Considered for the Study
- 1.4. Currency & Pricing
- 1.5. Language
- 1.6. Limitations
- 1.7. Assumptions
- 1.8. Stakeholders
2. Research Methodology
- 2.1. Define: Research Objective
- 2.2. Determine: Research Design
- 2.3. Prepare: Research Instrument
- 2.4. Collect: Data Source
- 2.5. Analyze: Data Interpretation
- 2.6. Formulate: Data Verification
- 2.7. Publish: Research Report
- 2.8. Repeat: Report Update
3. Executive Summary
4. Market Overview
- 4.1. Introduction
- 4.2. Portable Bluetooth Speaker Market, by Region
5. Market Insights
- 5.1. Market Dynamics
- 5.1.1. Drivers
- 5.1.1.1. Growing popularity of music and podcasts worldwide
- 5.1.1.2. Demand for convenient and wireless bluetooth speakers
- 5.1.1.3. Rise in recreational activities and adoption of wifi enabled bluetooth speakers
- 5.1.2. Restraints
- 5.1.2.1. High cost of portable bluetooth speakers
- 5.1.3. Opportunities
- 5.1.3.1. Technological advancements in portable bluetooth speakers
- 5.1.3.2. Availability of portable bluetooth speakers on eCommerce platforms
- 5.1.4. Challenges
- 5.1.4.1. Data security concerns and technical issues
- 5.1.1. Drivers
- 5.2. Market Segmentation Analysis
- 5.3. Market Trend Analysis
- 5.4. Cumulative Impact of High Inflation
- 5.5. Porter's Five Forces Analysis
- 5.5.1. Threat of New Entrants
- 5.5.2. Threat of Substitutes
- 5.5.3. Bargaining Power of Customers
- 5.5.4. Bargaining Power of Suppliers
- 5.5.5. Industry Rivalry
- 5.6. Value Chain & Critical Path Analysis
- 5.7. Regulatory Framework
6. Portable Bluetooth Speaker Market, by Type
- 6.1. Introduction
- 6.2. Car Speaker
- 6.3. Outdoor Bluetooth Speaker
- 6.4. Pocket Speaker
7. Portable Bluetooth Speaker Market, by Application
- 7.1. Introduction
- 7.2. Commercial
- 7.3. Personal
8. Portable Bluetooth Speaker Market, by Distribution
- 8.1. Introduction
- 8.2. Offline
- 8.3. Online
9. Americas Portable Bluetooth Speaker Market
- 9.1. Introduction
- 9.2. Argentina
- 9.3. Brazil
- 9.4. Canada
- 9.5. Mexico
- 9.6. United States
10. Asia-Pacific Portable Bluetooth Speaker Market
- 10.1. Introduction
- 10.2. Australia
- 10.3. China
- 10.4. India
- 10.5. Indonesia
- 10.6. Japan
- 10.7. Malaysia
- 10.8. Philippines
- 10.9. Singapore
- 10.10. South Korea
- 10.11. Taiwan
- 10.12. Thailand
- 10.13. Vietnam
11. Europe, Middle East & Africa Portable Bluetooth Speaker Market
- 11.1. Introduction
- 11.2. Denmark
- 11.3. Egypt
- 11.4. Finland
- 11.5. France
- 11.6. Germany
- 11.7. Israel
- 11.8. Italy
- 11.9. Netherlands
- 11.10. Nigeria
- 11.11. Norway
- 11.12. Poland
- 11.13. Qatar
- 11.14. Russia
- 11.15. Saudi Arabia
- 11.16. South Africa
- 11.17. Spain
- 11.18. Sweden
- 11.19. Switzerland
- 11.20. Turkey
- 11.21. United Arab Emirates
- 11.22. United Kingdom
12. Competitive Landscape
- 12.1. FPNV Positioning Matrix
- 12.2. Market Share Analysis, By Key Player
- 12.3. Competitive Scenario Analysis, By Key Player
13. Competitive Portfolio
- 13.1. Key Company Profiles
- 13.1.1. Able Systems Limited
- 13.1.2. Beijing Spirit Technology Development Co., Ltd.(SPRT)
- 13.1.3. Bixolon Co., Ltd.
- 13.1.4. Brother International Corporation
- 13.1.5. Canon Inc.
- 13.1.6. CognitiveTPG by Blue Edge Technology
- 13.1.7. Dell Technologies, Inc.
- 13.1.8. Eastman Kodak Company
- 13.1.9. Fujitsu Limited
- 13.1.10. Guangzhou Winprt Technology Co., Ltd.
- 13.1.11. Honeywell International Inc.
- 13.1.12. HP Inc.
- 13.1.13. Lexmark International, Inc.
- 13.1.14. Polaroid International B.V.
- 13.1.15. Ricoh Company, Ltd.
- 13.1.16. Samsung Electronics Co. Ltd.
- 13.1.17. SATO Holdings Corporation
- 13.1.18. Seiko Epson Corporation
- 13.1.19. Sharp Electronics Corporation
- 13.1.20. Star Micronics Co. Ltd.
- 13.1.21. Toshiba Corporation
- 13.1.22. Xiamen YAEN Electronic Technology Co., Ltd.
- 13.1.23. Xiaomi Corporation
- 13.1.24. Zebra Technologies Corporation
- 13.2. Key Product Portfolio
14. Appendix
- 14.1. Discussion Guide
- 14.2. License & Pricing
LIST OF FIGURES
- FIGURE 1. PORTABLE BLUETOOTH SPEAKER MARKET RESEARCH PROCESS
- FIGURE 2. PORTABLE BLUETOOTH SPEAKER MARKET SIZE, 2022 VS 2030
- FIGURE 3. PORTABLE BLUETOOTH SPEAKER MARKET SIZE, 2018-2030 (USD MILLION)
- FIGURE 4. PORTABLE BLUETOOTH SPEAKER MARKET SIZE, BY REGION, 2022 VS 2030 (%)
- FIGURE 5. PORTABLE BLUETOOTH SPEAKER MARKET SIZE, BY REGION, 2022 VS 2023 VS 2030 (USD MILLION)
- FIGURE 6. PORTABLE BLUETOOTH SPEAKER MARKET DYNAMICS
- FIGURE 7. PORTABLE BLUETOOTH SPEAKER MARKET SIZE, BY TYPE, 2022 VS 2030 (%)
- FIGURE 8. PORTABLE BLUETOOTH SPEAKER MARKET SIZE, BY TYPE, 2022 VS 2023 VS 2030 (USD MILLION)
- FIGURE 9. PORTABLE BLUETOOTH SPEAKER MARKET SIZE, BY APPLICATION, 2022 VS 2030 (%)
- FIGURE 10. PORTABLE BLUETOOTH SPEAKER MARKET SIZE, BY APPLICATION, 2022 VS 2023 VS 2030 (USD MILLION)
- FIGURE 11. PORTABLE BLUETOOTH SPEAKER MARKET SIZE, BY DISTRIBUTION, 2022 VS 2030 (%)
- FIGURE 12. PORTABLE BLUETOOTH SPEAKER MARKET SIZE, BY DISTRIBUTION, 2022 VS 2023 VS 2030 (USD MILLION)
- FIGURE 13. AMERICAS PORTABLE BLUETOOTH SPEAKER MARKET SIZE, BY COUNTRY, 2022 VS 2030 (%)
- FIGURE 14. AMERICAS PORTABLE BLUETOOTH SPEAKER MARKET SIZE, BY COUNTRY, 2022 VS 2023 VS 2030 (USD MILLION)
- FIGURE 15. UNITED STATES PORTABLE BLUETOOTH SPEAKER MARKET SIZE, BY STATE, 2022 VS 2030 (%)
- FIGURE 16. UNITED STATES PORTABLE BLUETOOTH SPEAKER MARKET SIZE, BY STATE, 2022 VS 2023 VS 2030 (USD MILLION)
- FIGURE 17. ASIA-PACIFIC PORTABLE BLUETOOTH SPEAKER MARKET SIZE, BY COUNTRY, 2022 VS 2030 (%)
- FIGURE 18. ASIA-PACIFIC PORTABLE BLUETOOTH SPEAKER MARKET SIZE, BY COUNTRY, 2022 VS 2023 VS 2030 (USD MILLION)
- FIGURE 19. EUROPE, MIDDLE EAST & AFRICA PORTABLE BLUETOOTH SPEAKER MARKET SIZE, BY COUNTRY, 2022 VS 2030 (%)
- FIGURE 20. EUROPE, MIDDLE EAST & AFRICA PORTABLE BLUETOOTH SPEAKER MARKET SIZE, BY COUNTRY, 2022 VS 2023 VS 2030 (USD MILLION)
- FIGURE 21. PORTABLE BLUETOOTH SPEAKER MARKET, FPNV POSITIONING MATRIX, 2022
- FIGURE 22. PORTABLE BLUETOOTH SPEAKER MARKET SHARE, BY KEY PLAYER, 2022
LIST OF TABLES
- TABLE 1. PORTABLE BLUETOOTH SPEAKER MARKET SEGMENTATION & COVERAGE
- TABLE 2. UNITED STATES DOLLAR EXCHANGE RATE, 2018-2022
- TABLE 3. PORTABLE BLUETOOTH SPEAKER MARKET SIZE, 2018-2030 (USD MILLION)
- TABLE 4. GLOBAL PORTABLE BLUETOOTH SPEAKER MARKET SIZE, BY REGION, 2018-2030 (USD MILLION)
- TABLE 5. PORTABLE BLUETOOTH SPEAKER MARKET SIZE, BY TYPE, 2018-2030 (USD MILLION)
- TABLE 6. PORTABLE BLUETOOTH SPEAKER MARKET SIZE, BY CAR SPEAKER, BY REGION, 2018-2030 (USD MILLION)
- TABLE 7. PORTABLE BLUETOOTH SPEAKER MARKET SIZE, BY OUTDOOR BLUETOOTH SPEAKER, BY REGION, 2018-2030 (USD MILLION)
- TABLE 8. PORTABLE BLUETOOTH SPEAKER MARKET SIZE, BY POCKET SPEAKER, BY REGION, 2018-2030 (USD MILLION)
- TABLE 9. PORTABLE BLUETOOTH SPEAKER MARKET SIZE, BY APPLICATION, 2018-2030 (USD MILLION)
- TABLE 10. PORTABLE BLUETOOTH SPEAKER MARKET SIZE, BY COMMERCIAL, BY REGION, 2018-2030 (USD MILLION)
- TABLE 11. PORTABLE BLUETOOTH SPEAKER MARKET SIZE, BY PERSONAL, BY REGION, 2018-2030 (USD MILLION)
- TABLE 12. PORTABLE BLUETOOTH SPEAKER MARKET SIZE, BY DISTRIBUTION, 2018-2030 (USD MILLION)
- TABLE 13. PORTABLE BLUETOOTH SPEAKER MARKET SIZE, BY OFFLINE, BY REGION, 2018-2030 (USD MILLION)
- TABLE 14. PORTABLE BLUETOOTH SPEAKER MARKET SIZE, BY ONLINE, BY REGION, 2018-2030 (USD MILLION)
- TABLE 15. AMERICAS PORTABLE BLUETOOTH SPEAKER MARKET SIZE, BY TYPE, 2018-2030 (USD MILLION)
- TABLE 16. AMERICAS PORTABLE BLUETOOTH SPEAKER MARKET SIZE, BY APPLICATION, 2018-2030 (USD MILLION)
- TABLE 17. AMERICAS PORTABLE BLUETOOTH SPEAKER MARKET SIZE, BY DISTRIBUTION, 2018-2030 (USD MILLION)
- TABLE 18. AMERICAS PORTABLE BLUETOOTH SPEAKER MARKET SIZE, BY COUNTRY, 2018-2030 (USD MILLION)
- TABLE 19. ARGENTINA PORTABLE BLUETOOTH SPEAKER MARKET SIZE, BY TYPE, 2018-2030 (USD MILLION)
- TABLE 20. ARGENTINA PORTABLE BLUETOOTH SPEAKER MARKET SIZE, BY APPLICATION, 2018-2030 (USD MILLION)
- TABLE 21. ARGENTINA PORTABLE BLUETOOTH SPEAKER MARKET SIZE, BY DISTRIBUTION, 2018-2030 (USD MILLION)
- TABLE 22. BRAZIL PORTABLE BLUETOOTH SPEAKER MARKET SIZE, BY TYPE, 2018-2030 (USD MILLION)
- TABLE 23. BRAZIL PORTABLE BLUETOOTH SPEAKER MARKET SIZE, BY APPLICATION, 2018-2030 (USD MILLION)
- TABLE 24. BRAZIL PORTABLE BLUETOOTH SPEAKER MARKET SIZE, BY DISTRIBUTION, 2018-2030 (USD MILLION)
- TABLE 25. CANADA PORTABLE BLUETOOTH SPEAKER MARKET SIZE, BY TYPE, 2018-2030 (USD MILLION)
- TABLE 26. CANADA PORTABLE BLUETOOTH SPEAKER MARKET SIZE, BY APPLICATION, 2018-2030 (USD MILLION)
- TABLE 27. CANADA PORTABLE BLUETOOTH SPEAKER MARKET SIZE, BY DISTRIBUTION, 2018-2030 (USD MILLION)
- TABLE 28. MEXICO PORTABLE BLUETOOTH SPEAKER MARKET SIZE, BY TYPE, 2018-2030 (USD MILLION)
- TABLE 29. MEXICO PORTABLE BLUETOOTH SPEAKER MARKET SIZE, BY APPLICATION, 2018-2030 (USD MILLION)
- TABLE 30. MEXICO PORTABLE BLUETOOTH SPEAKER MARKET SIZE, BY DISTRIBUTION, 2018-2030 (USD MILLION)
- TABLE 31. UNITED STATES PORTABLE BLUETOOTH SPEAKER MARKET SIZE, BY TYPE, 2018-2030 (USD MILLION)
- TABLE 32. UNITED STATES PORTABLE BLUETOOTH SPEAKER MARKET SIZE, BY APPLICATION, 2018-2030 (USD MILLION)
- TABLE 33. UNITED STATES PORTABLE BLUETOOTH SPEAKER MARKET SIZE, BY DISTRIBUTION, 2018-2030 (USD MILLION)
- TABLE 34. UNITED STATES PORTABLE BLUETOOTH SPEAKER MARKET SIZE, BY STATE, 2018-2030 (USD MILLION)
- TABLE 35. ASIA-PACIFIC PORTABLE BLUETOOTH SPEAKER MARKET SIZE, BY TYPE, 2018-2030 (USD MILLION)
- TABLE 36. ASIA-PACIFIC PORTABLE BLUETOOTH SPEAKER MARKET SIZE, BY APPLICATION, 2018-2030 (USD MILLION)
- TABLE 37. ASIA-PACIFIC PORTABLE BLUETOOTH SPEAKER MARKET SIZE, BY DISTRIBUTION, 2018-2030 (USD MILLION)
- TABLE 38. ASIA-PACIFIC PORTABLE BLUETOOTH SPEAKER MARKET SIZE, BY COUNTRY, 2018-2030 (USD MILLION)
- TABLE 39. AUSTRALIA PORTABLE BLUETOOTH SPEAKER MARKET SIZE, BY TYPE, 2018-2030 (USD MILLION)
- TABLE 40. AUSTRALIA PORTABLE BLUETOOTH SPEAKER MARKET SIZE, BY APPLICATION, 2018-2030 (USD MILLION)
- TABLE 41. AUSTRALIA PORTABLE BLUETOOTH SPEAKER MARKET SIZE, BY DISTRIBUTION, 2018-2030 (USD MILLION)
- TABLE 42. CHINA PORTABLE BLUETOOTH SPEAKER MARKET SIZE, BY TYPE, 2018-2030 (USD MILLION)
- TABLE 43. CHINA PORTABLE BLUETOOTH SPEAKER MARKET SIZE, BY APPLICATION, 2018-2030 (USD MILLION)
- TABLE 44. CHINA PORTABLE BLUETOOTH SPEAKER MARKET SIZE, BY DISTRIBUTION, 2018-2030 (USD MILLION)
- TABLE 45. INDIA PORTABLE BLUETOOTH SPEAKER MARKET SIZE, BY TYPE, 2018-2030 (USD MILLION)
- TABLE 46. INDIA PORTABLE BLUETOOTH SPEAKER MARKET SIZE, BY APPLICATION, 2018-2030 (USD MILLION)
- TABLE 47. INDIA PORTABLE BLUETOOTH SPEAKER MARKET SIZE, BY DISTRIBUTION, 2018-2030 (USD MILLION)
- TABLE 48. INDONESIA PORTABLE BLUETOOTH SPEAKER MARKET SIZE, BY TYPE, 2018-2030 (USD MILLION)
- TABLE 49. INDONESIA PORTABLE BLUETOOTH SPEAKER MARKET SIZE, BY APPLICATION, 2018-2030 (USD MILLION)
- TABLE 50. INDONESIA PORTABLE BLUETOOTH SPEAKER MARKET SIZE, BY DISTRIBUTION, 2018-2030 (USD MILLION)
- TABLE 51. JAPAN PORTABLE BLUETOOTH SPEAKER MARKET SIZE, BY TYPE, 2018-2030 (USD MILLION)
- TABLE 52. JAPAN PORTABLE BLUETOOTH SPEAKER MARKET SIZE, BY APPLICATION, 2018-2030 (USD MILLION)
- TABLE 53. JAPAN PORTABLE BLUETOOTH SPEAKER MARKET SIZE, BY DISTRIBUTION, 2018-2030 (USD MILLION)
- TABLE 54. MALAYSIA PORTABLE BLUETOOTH SPEAKER MARKET SIZE, BY TYPE, 2018-2030 (USD MILLION)
- TABLE 55. MALAYSIA PORTABLE BLUETOOTH SPEAKER MARKET SIZE, BY APPLICATION, 2018-2030 (USD MILLION)
- TABLE 56. MALAYSIA PORTABLE BLUETOOTH SPEAKER MARKET SIZE, BY DISTRIBUTION, 2018-2030 (USD MILLION)
- TABLE 57. PHILIPPINES PORTABLE BLUETOOTH SPEAKER MARKET SIZE, BY TYPE, 2018-2030 (USD MILLION)
- TABLE 58. PHILIPPINES PORTABLE BLUETOOTH SPEAKER MARKET SIZE, BY APPLICATION, 2018-2030 (USD MILLION)
- TABLE 59. PHILIPPINES PORTABLE BLUETOOTH SPEAKER MARKET SIZE, BY DISTRIBUTION, 2018-2030 (USD MILLION)
- TABLE 60. SINGAPORE PORTABLE BLUETOOTH SPEAKER MARKET SIZE, BY TYPE, 2018-2030 (USD MILLION)
- TABLE 61. SINGAPORE PORTABLE BLUETOOTH SPEAKER MARKET SIZE, BY APPLICATION, 2018-2030 (USD MILLION)
- TABLE 62. SINGAPORE PORTABLE BLUETOOTH SPEAKER MARKET SIZE, BY DISTRIBUTION, 2018-2030 (USD MILLION)
- TABLE 63. SOUTH KOREA PORTABLE BLUETOOTH SPEAKER MARKET SIZE, BY TYPE, 2018-2030 (USD MILLION)
- TABLE 64. SOUTH KOREA PORTABLE BLUETOOTH SPEAKER MARKET SIZE, BY APPLICATION, 2018-2030 (USD MILLION)
- TABLE 65. SOUTH KOREA PORTABLE BLUETOOTH SPEAKER MARKET SIZE, BY DISTRIBUTION, 2018-2030 (USD MILLION)
- TABLE 66. TAIWAN PORTABLE BLUETOOTH SPEAKER MARKET SIZE, BY TYPE, 2018-2030 (USD MILLION)
- TABLE 67. TAIWAN PORTABLE BLUETOOTH SPEAKER MARKET SIZE, BY APPLICATION, 2018-2030 (USD MILLION)
- TABLE 68. TAIWAN PORTABLE BLUETOOTH SPEAKER MARKET SIZE, BY DISTRIBUTION, 2018-2030 (USD MILLION)
- TABLE 69. THAILAND PORTABLE BLUETOOTH SPEAKER MARKET SIZE, BY TYPE, 2018-2030 (USD MILLION)
- TABLE 70. THAILAND PORTABLE BLUETOOTH SPEAKER MARKET SIZE, BY APPLICATION, 2018-2030 (USD MILLION)
- TABLE 71. THAILAND PORTABLE BLUETOOTH SPEAKER MARKET SIZE, BY DISTRIBUTION, 2018-2030 (USD MILLION)
- TABLE 72. VIETNAM PORTABLE BLUETOOTH SPEAKER MARKET SIZE, BY TYPE, 2018-2030 (USD MILLION)
- TABLE 73. VIETNAM PORTABLE BLUETOOTH SPEAKER MARKET SIZE, BY APPLICATION, 2018-2030 (USD MILLION)
- TABLE 74. VIETNAM PORTABLE BLUETOOTH SPEAKER MARKET SIZE, BY DISTRIBUTION, 2018-2030 (USD MILLION)
- TABLE 75. EUROPE, MIDDLE EAST & AFRICA PORTABLE BLUETOOTH SPEAKER MARKET SIZE, BY TYPE, 2018-2030 (USD MILLION)
- TABLE 76. EUROPE, MIDDLE EAST & AFRICA PORTABLE BLUETOOTH SPEAKER MARKET SIZE, BY APPLICATION, 2018-2030 (USD MILLION)
- TABLE 77. EUROPE, MIDDLE EAST & AFRICA PORTABLE BLUETOOTH SPEAKER MARKET SIZE, BY DISTRIBUTION, 2018-2030 (USD MILLION)
- TABLE 78. EUROPE, MIDDLE EAST & AFRICA PORTABLE BLUETOOTH SPEAKER MARKET SIZE, BY COUNTRY, 2018-2030 (USD MILLION)
- TABLE 79. DENMARK PORTABLE BLUETOOTH SPEAKER MARKET SIZE, BY TYPE, 2018-2030 (USD MILLION)
- TABLE 80. DENMARK PORTABLE BLUETOOTH SPEAKER MARKET SIZE, BY APPLICATION, 2018-2030 (USD MILLION)
- TABLE 81. DENMARK PORTABLE BLUETOOTH SPEAKER MARKET SIZE, BY DISTRIBUTION, 2018-2030 (USD MILLION)
- TABLE 82. EGYPT PORTABLE BLUETOOTH SPEAKER MARKET SIZE, BY TYPE, 2018-2030 (USD MILLION)
- TABLE 83. EGYPT PORTABLE BLUETOOTH SPEAKER MARKET SIZE, BY APPLICATION, 2018-2030 (USD MILLION)
- TABLE 84. EGYPT PORTABLE BLUETOOTH SPEAKER MARKET SIZE, BY DISTRIBUTION, 2018-2030 (USD MILLION)
- TABLE 85. FINLAND PORTABLE BLUETOOTH SPEAKER MARKET SIZE, BY TYPE, 2018-2030 (USD MILLION)
- TABLE 86. FINLAND PORTABLE BLUETOOTH SPEAKER MARKET SIZE, BY APPLICATION, 2018-2030 (USD MILLION)
- TABLE 87. FINLAND PORTABLE BLUETOOTH SPEAKER MARKET SIZE, BY DISTRIBUTION, 2018-2030 (USD MILLION)
- TABLE 88. FRANCE PORTABLE BLUETOOTH SPEAKER MARKET SIZE, BY TYPE, 2018-2030 (USD MILLION)
- TABLE 89. FRANCE PORTABLE BLUETOOTH SPEAKER MARKET SIZE, BY APPLICATION, 2018-2030 (USD MILLION)
- TABLE 90. FRANCE PORTABLE BLUETOOTH SPEAKER MARKET SIZE, BY DISTRIBUTION, 2018-2030 (USD MILLION)
- TABLE 91. GERMANY PORTABLE BLUETOOTH SPEAKER MARKET SIZE, BY TYPE, 2018-2030 (USD MILLION)
- TABLE 92. GERMANY PORTABLE BLUETOOTH SPEAKER MARKET SIZE, BY APPLICATION, 2018-2030 (USD MILLION)
- TABLE 93. GERMANY PORTABLE BLUETOOTH SPEAKER MARKET SIZE, BY DISTRIBUTION, 2018-2030 (USD MILLION)
- TABLE 94. ISRAEL PORTABLE BLUETOOTH SPEAKER MARKET SIZE, BY TYPE, 2018-2030 (USD MILLION)
- TABLE 95. ISRAEL PORTABLE BLUETOOTH SPEAKER MARKET SIZE, BY APPLICATION, 2018-2030 (USD MILLION)
- TABLE 96. ISRAEL PORTABLE BLUETOOTH SPEAKER MARKET SIZE, BY DISTRIBUTION, 2018-2030 (USD MILLION)
- TABLE 97. ITALY PORTABLE BLUETOOTH SPEAKER MARKET SIZE, BY TYPE, 2018-2030 (USD MILLION)
- TABLE 98. ITALY PORTABLE BLUETOOTH SPEAKER MARKET SIZE, BY APPLICATION, 2018-2030 (USD MILLION)
- TABLE 99. ITALY PORTABLE BLUETOOTH SPEAKER MARKET SIZE, BY DISTRIBUTION, 2018-2030 (USD MILLION)
- TABLE 100. NETHERLANDS PORTABLE BLUETOOTH SPEAKER MARKET SIZE, BY TYPE, 2018-2030 (USD MILLION)
- TABLE 101. NETHERLANDS PORTABLE BLUETOOTH SPEAKER MARKET SIZE, BY APPLICATION, 2018-2030 (USD MILLION)
- TABLE 102. NETHERLANDS PORTABLE BLUETOOTH SPEAKER MARKET SIZE, BY DISTRIBUTION, 2018-2030 (USD MILLION)
- TABLE 103. NIGERIA PORTABLE BLUETOOTH SPEAKER MARKET SIZE, BY TYPE, 2018-2030 (USD MILLION)
- TABLE 104. NIGERIA PORTABLE BLUETOOTH SPEAKER MARKET SIZE, BY APPLICATION, 2018-2030 (USD MILLION)
- TABLE 105. NIGERIA PORTABLE BLUETOOTH SPEAKER MARKET SIZE, BY DISTRIBUTION, 2018-2030 (USD MILLION)
- TABLE 106. NORWAY PORTABLE BLUETOOTH SPEAKER MARKET SIZE, BY TYPE, 2018-2030 (USD MILLION)
- TABLE 107. NORWAY PORTABLE BLUETOOTH SPEAKER MARKET SIZE, BY APPLICATION, 2018-2030 (USD MILLION)
- TABLE 108. NORWAY PORTABLE BLUETOOTH SPEAKER MARKET SIZE, BY DISTRIBUTION, 2018-2030 (USD MILLION)
- TABLE 109. POLAND PORTABLE BLUETOOTH SPEAKER MARKET SIZE, BY TYPE, 2018-2030 (USD MILLION)
- TABLE 110. POLAND PORTABLE BLUETOOTH SPEAKER MARKET SIZE, BY APPLICATION, 2018-2030 (USD MILLION)
- TABLE 111. POLAND PORTABLE BLUETOOTH SPEAKER MARKET SIZE, BY DISTRIBUTION, 2018-2030 (USD MILLION)
- TABLE 112. QATAR PORTABLE BLUETOOTH SPEAKER MARKET SIZE, BY TYPE, 2018-2030 (USD MILLION)
- TABLE 113. QATAR PORTABLE BLUETOOTH SPEAKER MARKET SIZE, BY APPLICATION, 2018-2030 (USD MILLION)
- TABLE 114. QATAR PORTABLE BLUETOOTH SPEAKER MARKET SIZE, BY DISTRIBUTION, 2018-2030 (USD MILLION)
- TABLE 115. RUSSIA PORTABLE BLUETOOTH SPEAKER MARKET SIZE, BY TYPE, 2018-2030 (USD MILLION)
- TABLE 116. RUSSIA PORTABLE BLUETOOTH SPEAKER MARKET SIZE, BY APPLICATION, 2018-2030 (USD MILLION)
- TABLE 117. RUSSIA PORTABLE BLUETOOTH SPEAKER MARKET SIZE, BY DISTRIBUTION, 2018-2030 (USD MILLION)
- TABLE 118. SAUDI ARABIA PORTABLE BLUETOOTH SPEAKER MARKET SIZE, BY TYPE, 2018-2030 (USD MILLION)
- TABLE 119. SAUDI ARABIA PORTABLE BLUETOOTH SPEAKER MARKET SIZE, BY APPLICATION, 2018-2030 (USD MILLION)
- TABLE 120. SAUDI ARABIA PORTABLE BLUETOOTH SPEAKER MARKET SIZE, BY DISTRIBUTION, 2018-2030 (USD MILLION)
- TABLE 121. SOUTH AFRICA PORTABLE BLUETOOTH SPEAKER MARKET SIZE, BY TYPE, 2018-2030 (USD MILLION)
- TABLE 122. SOUTH AFRICA PORTABLE BLUETOOTH SPEAKER MARKET SIZE, BY APPLICATION, 2018-2030 (USD MILLION)
- TABLE 123. SOUTH AFRICA PORTABLE BLUETOOTH SPEAKER MARKET SIZE, BY DISTRIBUTION, 2018-2030 (USD MILLION)
- TABLE 124. SPAIN PORTABLE BLUETOOTH SPEAKER MARKET SIZE, BY TYPE, 2018-2030 (USD MILLION)
- TABLE 125. SPAIN PORTABLE BLUETOOTH SPEAKER MARKET SIZE, BY APPLICATION, 2018-2030 (USD MILLION)
- TABLE 126. SPAIN PORTABLE BLUETOOTH SPEAKER MARKET SIZE, BY DISTRIBUTION, 2018-2030 (USD MILLION)
- TABLE 127. SWEDEN PORTABLE BLUETOOTH SPEAKER MARKET SIZE, BY TYPE, 2018-2030 (USD MILLION)
- TABLE 128. SWEDEN PORTABLE BLUETOOTH SPEAKER MARKET SIZE, BY APPLICATION, 2018-2030 (USD MILLION)
- TABLE 129. SWEDEN PORTABLE BLUETOOTH SPEAKER MARKET SIZE, BY DISTRIBUTION, 2018-2030 (USD MILLION)
- TABLE 130. SWITZERLAND PORTABLE BLUETOOTH SPEAKER MARKET SIZE, BY TYPE, 2018-2030 (USD MILLION)
- TABLE 131. SWITZERLAND PORTABLE BLUETOOTH SPEAKER MARKET SIZE, BY APPLICATION, 2018-2030 (USD MILLION)
- TABLE 132. SWITZERLAND PORTABLE BLUETOOTH SPEAKER MARKET SIZE, BY DISTRIBUTION, 2018-2030 (USD MILLION)
- TABLE 133. TURKEY PORTABLE BLUETOOTH SPEAKER MARKET SIZE, BY TYPE, 2018-2030 (USD MILLION)
- TABLE 134. TURKEY PORTABLE BLUETOOTH SPEAKER MARKET SIZE, BY APPLICATION, 2018-2030 (USD MILLION)
- TABLE 135. TURKEY PORTABLE BLUETOOTH SPEAKER MARKET SIZE, BY DISTRIBUTION, 2018-2030 (USD MILLION)
- TABLE 136. UNITED ARAB EMIRATES PORTABLE BLUETOOTH SPEAKER MARKET SIZE, BY TYPE, 2018-2030 (USD MILLION)
- TABLE 137. UNITED ARAB EMIRATES PORTABLE BLUETOOTH SPEAKER MARKET SIZE, BY APPLICATION, 2018-2030 (USD MILLION)
- TABLE 138. UNITED ARAB EMIRATES PORTABLE BLUETOOTH SPEAKER MARKET SIZE, BY DISTRIBUTION, 2018-2030 (USD MILLION)
- TABLE 139. UNITED KINGDOM PORTABLE BLUETOOTH SPEAKER MARKET SIZE, BY TYPE, 2018-2030 (USD MILLION)
- TABLE 140. UNITED KINGDOM PORTABLE BLUETOOTH SPEAKER MARKET SIZE, BY APPLICATION, 2018-2030 (USD MILLION)
- TABLE 141. UNITED KINGDOM PORTABLE BLUETOOTH SPEAKER MARKET SIZE, BY DISTRIBUTION, 2018-2030 (USD MILLION)
- TABLE 142. PORTABLE BLUETOOTH SPEAKER MARKET, FPNV POSITIONING MATRIX, 2022
- TABLE 143. PORTABLE BLUETOOTH SPEAKER MARKET SHARE, BY KEY PLAYER, 2022
- TABLE 144. PORTABLE BLUETOOTH SPEAKER MARKET LICENSE & PRICING
 2024-2032 年按攜帶性、類型、價格、配銷通路和地區分類的藍牙揚聲器市場報告
 防水藍牙音箱市場報告:2030 年趨勢、預測與競爭分析
 藍牙揚聲器:市場佔有率分析、產業趨勢與統計、2024-2029 年成長預測
 攜帶式藍牙揚聲器的全球市場規模、佔有率和行業趨勢分析報告:2023-2030 年依價格分佈、應用、配銷通路和地區分類的展望和預測
 藍牙揚聲器市場:按類型、技術和銷售管道分類 - 2023-2030 年全球預測
 攜帶式藍牙揚聲器市場規模、佔有率、趨勢分析報告:按應用、配銷通路、地區、細分市場趨勢,2023-2030
 藍牙揚聲器市場 - 2018-2028 年全球產業規模、佔有率、趨勢、機會和預測,按類型、技術、銷售管道、地區、競爭預測和機會細分,2018-2028 年
 攜帶式藍牙揚聲器的全球市場
 Bluetooth喇叭的全球市場 2023-2027
 2023-2030年全球藍牙音箱市場