


 |
市場調查報告書
商品編碼
1414743
建築地板材料市場:按印刷技術、材料和最終用戶分類:2023-2032 年全球機會分析和產業預測Construction Flooring Market By Printing Technology (Digital, Traditional), By Material (Wood, Stone, Ceramic, Laminate, Others), By End User (Residential, Non-Residential): Global Opportunity Analysis and Industry Forecast, 2023-2032 |
||||||
到 2032 年,建築地板材料預計將達到 1,892 億美元。
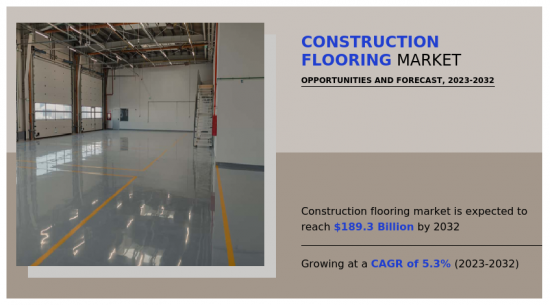
可以使用不同風格的地板材料來匹配住宅的內部和外裝,這增加了地板材料解決方案的可取性。
由於人口快速成長以及新商業中心的建設,到 2032 年,地板銷售額預計將達到 1,892 億美元,例如:
1 辦公室、工廠、倉庫、體育設施、酒店和醫療保健等新商業中心的建設正在推動緊湊高效的內裝系統的部署。修復業務繼續受益於強勁的住宅市場。此外,政府和私人公司在住宅裝修和維修方面的支出增加正在創造對室內地板材料產品的需求,預計這將推動市場成長。
此外,對永續的日益關注正在推動對相對環保的地板材料解決方案的需求。這促使主要參與者創新和開發環保地板材料,提供了利潤豐厚的成長機會。
在全球市場營運的主要企業採取了以下關鍵策略:
1 我們正在採取產品推出、業務擴張、產品開拓和收購等策略來加強我們的市場拓展並保持高度的市場競爭力。
建築地板材料市場按印刷類型、材料、最終用戶行業和地區進行細分。根據印刷類型,市場分為數位印刷和傳統印刷。依材料分為木材、石材、陶瓷、層壓板等。根據最終用戶行業,將其分為住宅和非住宅。
從區域來看,我們對北美、歐洲、亞太地區和拉丁美洲/中東/非洲的市場進行了分析。在全球市場營運的主要企業採取了以下關鍵策略:
1.產品推出及產品開拓,加強市場拓展,維持激烈的市場競爭。
目錄
第1章簡介
第 2 章執行摘要
第3章市場概況
- 市場定義和範圍
- 主要發現
- 影響因素
- 主要投資機會
- 波特五力分析
- 市場動態
- 促進因素
- 住宅裝修計劃增加
- 新興經濟體建設活動增加
- 地板材料在建築物生命週期中的重要性
- 抑制因素
- 越來越重視綠色環保材料的使用
- 外交政策的變動影響報酬率
- 機會
- 專注於基礎設施發展的官民合作關係(PPP)
- 促進因素
第4章建築地板材料市場:透過印刷技術
- 概述
- 數位的
- 傳統的
第5章建築地板材料市場:依材料分類
- 概述
- 木頭
- 石材
- 陶瓷製品
- 層壓板
- 其他
第6章建築地板材料市場:依最終使用者分類
- 概述
- 住宅
- 非住宅
第7章建築地板材料市場:依地區
- 概述
- 北美洲
- 美國
- 加拿大
- 墨西哥
- 歐洲
- 德國
- 法國
- 義大利
- 英國
- 其他
- 亞太地區
- 中國
- 日本
- 印度
- 韓國
- 其他
- 拉丁美洲
- 拉丁美洲
- 中東
- 非洲
第8章 競爭形勢
- 介紹
- 關鍵成功策略
- 10家主要企業產品圖譜
- 競爭對手儀表板
- 競爭熱圖
- 2020年主要企業定位
第9章 公司簡介
- J&J Industries, Inc.
- Shaw Industries Group, Inc.
- Armstrong
- mohawk
- Tarkett Group
- Beaulieu International Group NV
- Iron Woods
- Interface Inc.
- Toli Corporation
- Ecore International, Inc.
Construction flooring expected to Reach $ 189.2 Billion by 2032-Allied Market Research
The availability of different styles of flooring solutions to match any interior and exterior setting of a house extend the desirability of flooring solutions.
The fast growth of the population, combined with the construction of new business centers, such as
1) offices, factories, warehouses, sports complexes, hospitality, and healthcare, has prompted the deployment of compact and efficient decor systems. The restoration business continues to benefit from a strong housing market, which includes rise in home building, sales, and equity. Moreover, rise in expenditure by governments and private construction companies on remodeling and repairing of houses has created demand for indoor flooring products, and hence this factor is anticipated to drive the market growth.
Furthermore, the increased focus on sustainable development is driving the demand for flooring solutions that are relatively eco-friendly. This has encouraged key players to innovate and develop ecofriendly floorings, thereby providing lucrative growth opportunities.
The major players that operate in the global market have adopted key strategies such as
1) product launches, business expansion, product development, and acquisitions to strengthen their market outreach and sustain the stiff competition in the market.
The construction flooring market is segmented on the basis of printing type, material, end-user industry, and region. On the basis of printing type, the market is categorized into digital and traditional. On the basis of material, it is divided into wood, stone, ceramic, laminate, and others. On the basis of end-user industry, it is bifurcated into residential and non-residential.
Region-wise, the market is analyzed across North America, Europe, Asia-Pacific, and LAMEA. The major players that operate in the global market have adopted key strategies such as
1) product launch and product development to strengthen their market outreach and sustain the stiff competition in the market.
COMPETITION ANALYSIS
Key companies profiled in the construction flooring market report include J&J Industries, Inc., Shaw Industries Group, Inc., Armstrong, mohawk, Tarkett Group, Beaulieu International Group NV, Interface Inc., Iron Woods, Toli Corporation and Ecore International, Inc.
Key Benefits For Stakeholders
- This report provides a quantitative analysis of the market segments, current trends, estimations, and dynamics of the construction flooring market analysis from 2020 to 2032 to identify the prevailing construction flooring market opportunities.
- The market research is offered along with information related to key drivers, restraints, and opportunities.
- Porter's five forces analysis highlights the potency of buyers and suppliers to enable stakeholders make profit-oriented business decisions and strengthen their supplier-buyer network.
- In-depth analysis of the construction flooring market segmentation assists to determine the prevailing market opportunities.
- Major countries in each region are mapped according to their revenue contribution to the global market.
- Market player positioning facilitates benchmarking and provides a clear understanding of the present position of the market players.
- The report includes the analysis of the regional as well as global construction flooring market trends, key players, market segments, application areas, and market growth strategies.
Additional benefits you will get with this purchase are:
- Quarterly Update and* (only available with a corporate license, on listed price)
- 5 additional Company Profile of client Choice pre- or Post-purchase, as a free update.
- Free Upcoming Version on the Purchase of Five and Enterprise User License.
- 16 analyst hours of support* (post-purchase, if you find additional data requirements upon review of the report, you may receive support amounting to 16 analyst hours to solve questions, and post-sale queries)
- 15% Free Customization* (in case the scope or segment of the report does not match your requirements, 15% is equivalent to 3 working days of free work, applicable once)
- Free data Pack on the Five and Enterprise User License. (Excel version of the report)
- Free Updated report if the report is 6-12 months old or older.
- 24-hour priority response*
- Free Industry updates and white papers.
Possible Customization with this report (with additional cost and timeline, please talk to the sales executive to know more)
- Product Benchmarking / Product specification and applications
- Senario Analysis & Growth Trend Comparision
- Upcoming/New Entrant by Regions
- Consumer Preference and Product Specifications
- Market share analysis of players by products/segments
- New Product Development/ Product Matrix of Key Players
- Regulatory Guidelines
- Strategic Recommedations
- Additional company profiles with specific to client's interest
- Additional country or region analysis- market size and forecast
- Average Selling Price Analysis / Price Point Analysis
- Brands Share Analysis
- Criss-cross segment analysis- market size and forecast
- Expanded list for Company Profiles
- Historic market data
- Import Export Analysis/Data
- Key player details (including location, contact details, supplier/vendor network etc. in excel format)
- List of customers/consumers/raw material suppliers- value chain analysis
- Market share analysis of players at global/region/country level
- Per Capita Consumption Trends
- Product Consumption Analysis
- Reimbursement Scenario
- SWOT Analysis
- Volume Market Size and Forecast
Key Market Segments
By End User
- Residential
- Non-Residential
By Printing Technology
- Digital
- Traditional
By Material
- Wood
- Stone
- Ceramic
- Laminate
- Others
By Region
- North America
- U.S.
- Canada
- Mexico
- Europe
- Germany
- France
- Italy
- UK
- Rest of Europe
- Asia-Pacific
- China
- Japan
- India
- South Korea
- Rest of Asia-Pacific
- LAMEA
- Latin America
- Middle East
- Africa
Key Market Players:
- J&J Industries, Inc.
- Shaw Industries Group, Inc.
- mohawk
- Tarkett Group
- Beaulieu International Group NV
- Interface Inc.
- Iron Woods
- Ecore International, Inc.
- Armstrong
- Toli Corporation
TABLE OF CONTENTS
CHAPTER 1: INTRODUCTION
- 1.1. Report description
- 1.2. Key market segments
- 1.3. Key benefits to the stakeholders
- 1.4. Research methodology
- 1.4.1. Primary research
- 1.4.2. Secondary research
- 1.4.3. Analyst tools and models
CHAPTER 2: EXECUTIVE SUMMARY
- 2.1. CXO Perspective
CHAPTER 3: MARKET OVERVIEW
- 3.1. Market definition and scope
- 3.2. Key findings
- 3.2.1. Top impacting factors
- 3.2.2. Top investment pockets
- 3.3. Porter's five forces analysis
- 3.3.1. Low bargaining power of suppliers
- 3.3.2. Low threat of new entrants
- 3.3.3. Low threat of substitutes
- 3.3.4. Low intensity of rivalry
- 3.3.5. Low bargaining power of buyers
- 3.4. Market dynamics
- 3.4.1. Drivers
- 3.4.1.1. Rise in number of home remodeling projects
- 3.4.1.2. Rise in building construction activities in emerging economies
- 3.4.1.3. Importance of flooring in serviceability of a building
- 3.4.2. Restraints
- 3.4.2.1. Increased emphasis toward utilization of green and eco-friendly materials
- 3.4.2.2. Changes in foreign policies influence profit margins
- 3.4.3. Opportunities
- 3.4.3.1. Focus toward public-private partnerships (PPPs) for infrastructure development
- 3.4.1. Drivers
CHAPTER 4: CONSTRUCTION FLOORING MARKET, BY PRINTING TECHNOLOGY
- 4.1. Overview
- 4.1.1. Market size and forecast
- 4.2. Digital
- 4.2.1. Key market trends, growth factors and opportunities
- 4.2.2. Market size and forecast, by region
- 4.2.3. Market share analysis by country
- 4.3. Traditional
- 4.3.1. Key market trends, growth factors and opportunities
- 4.3.2. Market size and forecast, by region
- 4.3.3. Market share analysis by country
CHAPTER 5: CONSTRUCTION FLOORING MARKET, BY MATERIAL
- 5.1. Overview
- 5.1.1. Market size and forecast
- 5.2. Wood
- 5.2.1. Key market trends, growth factors and opportunities
- 5.2.2. Market size and forecast, by region
- 5.2.3. Market share analysis by country
- 5.3. Stone
- 5.3.1. Key market trends, growth factors and opportunities
- 5.3.2. Market size and forecast, by region
- 5.3.3. Market share analysis by country
- 5.4. Ceramic
- 5.4.1. Key market trends, growth factors and opportunities
- 5.4.2. Market size and forecast, by region
- 5.4.3. Market share analysis by country
- 5.5. Laminate
- 5.5.1. Key market trends, growth factors and opportunities
- 5.5.2. Market size and forecast, by region
- 5.5.3. Market share analysis by country
- 5.6. Others
- 5.6.1. Key market trends, growth factors and opportunities
- 5.6.2. Market size and forecast, by region
- 5.6.3. Market share analysis by country
CHAPTER 6: CONSTRUCTION FLOORING MARKET, BY END USER
- 6.1. Overview
- 6.1.1. Market size and forecast
- 6.2. Residential
- 6.2.1. Key market trends, growth factors and opportunities
- 6.2.2. Market size and forecast, by region
- 6.2.3. Market share analysis by country
- 6.3. Non-Residential
- 6.3.1. Key market trends, growth factors and opportunities
- 6.3.2. Market size and forecast, by region
- 6.3.3. Market share analysis by country
CHAPTER 7: CONSTRUCTION FLOORING MARKET, BY REGION
- 7.1. Overview
- 7.1.1. Market size and forecast By Region
- 7.2. North America
- 7.2.1. Key market trends, growth factors and opportunities
- 7.2.2. Market size and forecast, by Printing Technology
- 7.2.3. Market size and forecast, by Material
- 7.2.4. Market size and forecast, by End User
- 7.2.5. Market size and forecast, by country
- 7.2.5.1. U.S.
- 7.2.5.1.1. Market size and forecast, by Printing Technology
- 7.2.5.1.2. Market size and forecast, by Material
- 7.2.5.1.3. Market size and forecast, by End User
- 7.2.5.2. Canada
- 7.2.5.2.1. Market size and forecast, by Printing Technology
- 7.2.5.2.2. Market size and forecast, by Material
- 7.2.5.2.3. Market size and forecast, by End User
- 7.2.5.3. Mexico
- 7.2.5.3.1. Market size and forecast, by Printing Technology
- 7.2.5.3.2. Market size and forecast, by Material
- 7.2.5.3.3. Market size and forecast, by End User
- 7.3. Europe
- 7.3.1. Key market trends, growth factors and opportunities
- 7.3.2. Market size and forecast, by Printing Technology
- 7.3.3. Market size and forecast, by Material
- 7.3.4. Market size and forecast, by End User
- 7.3.5. Market size and forecast, by country
- 7.3.5.1. Germany
- 7.3.5.1.1. Market size and forecast, by Printing Technology
- 7.3.5.1.2. Market size and forecast, by Material
- 7.3.5.1.3. Market size and forecast, by End User
- 7.3.5.2. France
- 7.3.5.2.1. Market size and forecast, by Printing Technology
- 7.3.5.2.2. Market size and forecast, by Material
- 7.3.5.2.3. Market size and forecast, by End User
- 7.3.5.3. Italy
- 7.3.5.3.1. Market size and forecast, by Printing Technology
- 7.3.5.3.2. Market size and forecast, by Material
- 7.3.5.3.3. Market size and forecast, by End User
- 7.3.5.4. UK
- 7.3.5.4.1. Market size and forecast, by Printing Technology
- 7.3.5.4.2. Market size and forecast, by Material
- 7.3.5.4.3. Market size and forecast, by End User
- 7.3.5.5. Rest of Europe
- 7.3.5.5.1. Market size and forecast, by Printing Technology
- 7.3.5.5.2. Market size and forecast, by Material
- 7.3.5.5.3. Market size and forecast, by End User
- 7.4. Asia-Pacific
- 7.4.1. Key market trends, growth factors and opportunities
- 7.4.2. Market size and forecast, by Printing Technology
- 7.4.3. Market size and forecast, by Material
- 7.4.4. Market size and forecast, by End User
- 7.4.5. Market size and forecast, by country
- 7.4.5.1. China
- 7.4.5.1.1. Market size and forecast, by Printing Technology
- 7.4.5.1.2. Market size and forecast, by Material
- 7.4.5.1.3. Market size and forecast, by End User
- 7.4.5.2. Japan
- 7.4.5.2.1. Market size and forecast, by Printing Technology
- 7.4.5.2.2. Market size and forecast, by Material
- 7.4.5.2.3. Market size and forecast, by End User
- 7.4.5.3. India
- 7.4.5.3.1. Market size and forecast, by Printing Technology
- 7.4.5.3.2. Market size and forecast, by Material
- 7.4.5.3.3. Market size and forecast, by End User
- 7.4.5.4. South Korea
- 7.4.5.4.1. Market size and forecast, by Printing Technology
- 7.4.5.4.2. Market size and forecast, by Material
- 7.4.5.4.3. Market size and forecast, by End User
- 7.4.5.5. Rest of Asia-Pacific
- 7.4.5.5.1. Market size and forecast, by Printing Technology
- 7.4.5.5.2. Market size and forecast, by Material
- 7.4.5.5.3. Market size and forecast, by End User
- 7.5. LAMEA
- 7.5.1. Key market trends, growth factors and opportunities
- 7.5.2. Market size and forecast, by Printing Technology
- 7.5.3. Market size and forecast, by Material
- 7.5.4. Market size and forecast, by End User
- 7.5.5. Market size and forecast, by country
- 7.5.5.1. Latin America
- 7.5.5.1.1. Market size and forecast, by Printing Technology
- 7.5.5.1.2. Market size and forecast, by Material
- 7.5.5.1.3. Market size and forecast, by End User
- 7.5.5.2. Middle East
- 7.5.5.2.1. Market size and forecast, by Printing Technology
- 7.5.5.2.2. Market size and forecast, by Material
- 7.5.5.2.3. Market size and forecast, by End User
- 7.5.5.3. Africa
- 7.5.5.3.1. Market size and forecast, by Printing Technology
- 7.5.5.3.2. Market size and forecast, by Material
- 7.5.5.3.3. Market size and forecast, by End User
CHAPTER 8: COMPETITIVE LANDSCAPE
- 8.1. Introduction
- 8.2. Top winning strategies
- 8.3. Product mapping of top 10 player
- 8.4. Competitive dashboard
- 8.5. Competitive heatmap
- 8.6. Top player positioning, 2020
CHAPTER 9: COMPANY PROFILES
- 9.1. J&J Industries, Inc.
- 9.1.1. Company overview
- 9.1.2. Key executives
- 9.1.3. Company snapshot
- 9.1.4. Operating business segments
- 9.1.5. Product portfolio
- 9.2. Shaw Industries Group, Inc.
- 9.2.1. Company overview
- 9.2.2. Key executives
- 9.2.3. Company snapshot
- 9.2.4. Operating business segments
- 9.2.5. Product portfolio
- 9.3. Armstrong
- 9.3.1. Company overview
- 9.3.2. Key executives
- 9.3.3. Company snapshot
- 9.3.4. Operating business segments
- 9.3.5. Product portfolio
- 9.4. mohawk
- 9.4.1. Company overview
- 9.4.2. Key executives
- 9.4.3. Company snapshot
- 9.4.4. Operating business segments
- 9.4.5. Product portfolio
- 9.4.6. Business performance
- 9.4.7. Key strategic moves and developments
- 9.5. Tarkett Group
- 9.5.1. Company overview
- 9.5.2. Key executives
- 9.5.3. Company snapshot
- 9.5.4. Operating business segments
- 9.5.5. Product portfolio
- 9.5.6. Business performance
- 9.6. Beaulieu International Group NV
- 9.6.1. Company overview
- 9.6.2. Key executives
- 9.6.3. Company snapshot
- 9.6.4. Operating business segments
- 9.6.5. Product portfolio
- 9.7. Iron Woods
- 9.7.1. Company overview
- 9.7.2. Key executives
- 9.7.3. Company snapshot
- 9.7.4. Operating business segments
- 9.7.5. Product portfolio
- 9.8. Interface Inc.
- 9.8.1. Company overview
- 9.8.2. Key executives
- 9.8.3. Company snapshot
- 9.8.4. Operating business segments
- 9.8.5. Product portfolio
- 9.8.6. Business performance
- 9.9. Toli Corporation
- 9.9.1. Company overview
- 9.9.2. Key executives
- 9.9.3. Company snapshot
- 9.9.4. Operating business segments
- 9.9.5. Product portfolio
- 9.9.6. Business performance
- 9.10. Ecore International, Inc.
- 9.10.1. Company overview
- 9.10.2. Key executives
- 9.10.3. Company snapshot
- 9.10.4. Operating business segments
- 9.10.5. Product portfolio
- 9.10.6. Key strategic moves and developments
LIST OF TABLES
- TABLE 01. GLOBAL CONSTRUCTION FLOORING MARKET, BY PRINTING TECHNOLOGY, 2020-2032 ($MILLION)
- TABLE 02. CONSTRUCTION FLOORING MARKET FOR DIGITAL, BY REGION, 2020-2032 ($MILLION)
- TABLE 03. CONSTRUCTION FLOORING MARKET FOR TRADITIONAL, BY REGION, 2020-2032 ($MILLION)
- TABLE 04. GLOBAL CONSTRUCTION FLOORING MARKET, BY MATERIAL, 2020-2032 ($MILLION)
- TABLE 05. CONSTRUCTION FLOORING MARKET FOR WOOD, BY REGION, 2020-2032 ($MILLION)
- TABLE 06. CONSTRUCTION FLOORING MARKET FOR STONE, BY REGION, 2020-2032 ($MILLION)
- TABLE 07. CONSTRUCTION FLOORING MARKET FOR CERAMIC, BY REGION, 2020-2032 ($MILLION)
- TABLE 08. CONSTRUCTION FLOORING MARKET FOR LAMINATE, BY REGION, 2020-2032 ($MILLION)
- TABLE 09. CONSTRUCTION FLOORING MARKET FOR OTHERS, BY REGION, 2020-2032 ($MILLION)
- TABLE 10. GLOBAL CONSTRUCTION FLOORING MARKET, BY END USER, 2020-2032 ($MILLION)
- TABLE 11. CONSTRUCTION FLOORING MARKET FOR RESIDENTIAL, BY REGION, 2020-2032 ($MILLION)
- TABLE 12. CONSTRUCTION FLOORING MARKET FOR NON-RESIDENTIAL, BY REGION, 2020-2032 ($MILLION)
- TABLE 13. CONSTRUCTION FLOORING MARKET, BY REGION, 2020-2032 ($MILLION)
- TABLE 14. NORTH AMERICA CONSTRUCTION FLOORING MARKET, BY PRINTING TECHNOLOGY, 2020-2032 ($MILLION)
- TABLE 15. NORTH AMERICA CONSTRUCTION FLOORING MARKET, BY MATERIAL, 2020-2032 ($MILLION)
- TABLE 16. NORTH AMERICA CONSTRUCTION FLOORING MARKET, BY END USER, 2020-2032 ($MILLION)
- TABLE 17. NORTH AMERICA CONSTRUCTION FLOORING MARKET, BY COUNTRY, 2020-2032 ($MILLION)
- TABLE 18. U.S. CONSTRUCTION FLOORING MARKET, BY PRINTING TECHNOLOGY, 2020-2032 ($MILLION)
- TABLE 19. U.S. CONSTRUCTION FLOORING MARKET, BY MATERIAL, 2020-2032 ($MILLION)
- TABLE 20. U.S. CONSTRUCTION FLOORING MARKET, BY END USER, 2020-2032 ($MILLION)
- TABLE 21. CANADA CONSTRUCTION FLOORING MARKET, BY PRINTING TECHNOLOGY, 2020-2032 ($MILLION)
- TABLE 22. CANADA CONSTRUCTION FLOORING MARKET, BY MATERIAL, 2020-2032 ($MILLION)
- TABLE 23. CANADA CONSTRUCTION FLOORING MARKET, BY END USER, 2020-2032 ($MILLION)
- TABLE 24. MEXICO CONSTRUCTION FLOORING MARKET, BY PRINTING TECHNOLOGY, 2020-2032 ($MILLION)
- TABLE 25. MEXICO CONSTRUCTION FLOORING MARKET, BY MATERIAL, 2020-2032 ($MILLION)
- TABLE 26. MEXICO CONSTRUCTION FLOORING MARKET, BY END USER, 2020-2032 ($MILLION)
- TABLE 27. EUROPE CONSTRUCTION FLOORING MARKET, BY PRINTING TECHNOLOGY, 2020-2032 ($MILLION)
- TABLE 28. EUROPE CONSTRUCTION FLOORING MARKET, BY MATERIAL, 2020-2032 ($MILLION)
- TABLE 29. EUROPE CONSTRUCTION FLOORING MARKET, BY END USER, 2020-2032 ($MILLION)
- TABLE 30. EUROPE CONSTRUCTION FLOORING MARKET, BY COUNTRY, 2020-2032 ($MILLION)
- TABLE 31. GERMANY CONSTRUCTION FLOORING MARKET, BY PRINTING TECHNOLOGY, 2020-2032 ($MILLION)
- TABLE 32. GERMANY CONSTRUCTION FLOORING MARKET, BY MATERIAL, 2020-2032 ($MILLION)
- TABLE 33. GERMANY CONSTRUCTION FLOORING MARKET, BY END USER, 2020-2032 ($MILLION)
- TABLE 34. FRANCE CONSTRUCTION FLOORING MARKET, BY PRINTING TECHNOLOGY, 2020-2032 ($MILLION)
- TABLE 35. FRANCE CONSTRUCTION FLOORING MARKET, BY MATERIAL, 2020-2032 ($MILLION)
- TABLE 36. FRANCE CONSTRUCTION FLOORING MARKET, BY END USER, 2020-2032 ($MILLION)
- TABLE 37. ITALY CONSTRUCTION FLOORING MARKET, BY PRINTING TECHNOLOGY, 2020-2032 ($MILLION)
- TABLE 38. ITALY CONSTRUCTION FLOORING MARKET, BY MATERIAL, 2020-2032 ($MILLION)
- TABLE 39. ITALY CONSTRUCTION FLOORING MARKET, BY END USER, 2020-2032 ($MILLION)
- TABLE 40. UK CONSTRUCTION FLOORING MARKET, BY PRINTING TECHNOLOGY, 2020-2032 ($MILLION)
- TABLE 41. UK CONSTRUCTION FLOORING MARKET, BY MATERIAL, 2020-2032 ($MILLION)
- TABLE 42. UK CONSTRUCTION FLOORING MARKET, BY END USER, 2020-2032 ($MILLION)
- TABLE 43. REST OF EUROPE CONSTRUCTION FLOORING MARKET, BY PRINTING TECHNOLOGY, 2020-2032 ($MILLION)
- TABLE 44. REST OF EUROPE CONSTRUCTION FLOORING MARKET, BY MATERIAL, 2020-2032 ($MILLION)
- TABLE 45. REST OF EUROPE CONSTRUCTION FLOORING MARKET, BY END USER, 2020-2032 ($MILLION)
- TABLE 46. ASIA-PACIFIC CONSTRUCTION FLOORING MARKET, BY PRINTING TECHNOLOGY, 2020-2032 ($MILLION)
- TABLE 47. ASIA-PACIFIC CONSTRUCTION FLOORING MARKET, BY MATERIAL, 2020-2032 ($MILLION)
- TABLE 48. ASIA-PACIFIC CONSTRUCTION FLOORING MARKET, BY END USER, 2020-2032 ($MILLION)
- TABLE 49. ASIA-PACIFIC CONSTRUCTION FLOORING MARKET, BY COUNTRY, 2020-2032 ($MILLION)
- TABLE 50. CHINA CONSTRUCTION FLOORING MARKET, BY PRINTING TECHNOLOGY, 2020-2032 ($MILLION)
- TABLE 51. CHINA CONSTRUCTION FLOORING MARKET, BY MATERIAL, 2020-2032 ($MILLION)
- TABLE 52. CHINA CONSTRUCTION FLOORING MARKET, BY END USER, 2020-2032 ($MILLION)
- TABLE 53. JAPAN CONSTRUCTION FLOORING MARKET, BY PRINTING TECHNOLOGY, 2020-2032 ($MILLION)
- TABLE 54. JAPAN CONSTRUCTION FLOORING MARKET, BY MATERIAL, 2020-2032 ($MILLION)
- TABLE 55. JAPAN CONSTRUCTION FLOORING MARKET, BY END USER, 2020-2032 ($MILLION)
- TABLE 56. INDIA CONSTRUCTION FLOORING MARKET, BY PRINTING TECHNOLOGY, 2020-2032 ($MILLION)
- TABLE 57. INDIA CONSTRUCTION FLOORING MARKET, BY MATERIAL, 2020-2032 ($MILLION)
- TABLE 58. INDIA CONSTRUCTION FLOORING MARKET, BY END USER, 2020-2032 ($MILLION)
- TABLE 59. SOUTH KOREA CONSTRUCTION FLOORING MARKET, BY PRINTING TECHNOLOGY, 2020-2032 ($MILLION)
- TABLE 60. SOUTH KOREA CONSTRUCTION FLOORING MARKET, BY MATERIAL, 2020-2032 ($MILLION)
- TABLE 61. SOUTH KOREA CONSTRUCTION FLOORING MARKET, BY END USER, 2020-2032 ($MILLION)
- TABLE 62. REST OF ASIA-PACIFIC CONSTRUCTION FLOORING MARKET, BY PRINTING TECHNOLOGY, 2020-2032 ($MILLION)
- TABLE 63. REST OF ASIA-PACIFIC CONSTRUCTION FLOORING MARKET, BY MATERIAL, 2020-2032 ($MILLION)
- TABLE 64. REST OF ASIA-PACIFIC CONSTRUCTION FLOORING MARKET, BY END USER, 2020-2032 ($MILLION)
- TABLE 65. LAMEA CONSTRUCTION FLOORING MARKET, BY PRINTING TECHNOLOGY, 2020-2032 ($MILLION)
- TABLE 66. LAMEA CONSTRUCTION FLOORING MARKET, BY MATERIAL, 2020-2032 ($MILLION)
- TABLE 67. LAMEA CONSTRUCTION FLOORING MARKET, BY END USER, 2020-2032 ($MILLION)
- TABLE 68. LAMEA CONSTRUCTION FLOORING MARKET, BY COUNTRY, 2020-2032 ($MILLION)
- TABLE 69. LATIN AMERICA CONSTRUCTION FLOORING MARKET, BY PRINTING TECHNOLOGY, 2020-2032 ($MILLION)
- TABLE 70. LATIN AMERICA CONSTRUCTION FLOORING MARKET, BY MATERIAL, 2020-2032 ($MILLION)
- TABLE 71. LATIN AMERICA CONSTRUCTION FLOORING MARKET, BY END USER, 2020-2032 ($MILLION)
- TABLE 72. MIDDLE EAST CONSTRUCTION FLOORING MARKET, BY PRINTING TECHNOLOGY, 2020-2032 ($MILLION)
- TABLE 73. MIDDLE EAST CONSTRUCTION FLOORING MARKET, BY MATERIAL, 2020-2032 ($MILLION)
- TABLE 74. MIDDLE EAST CONSTRUCTION FLOORING MARKET, BY END USER, 2020-2032 ($MILLION)
- TABLE 75. AFRICA CONSTRUCTION FLOORING MARKET, BY PRINTING TECHNOLOGY, 2020-2032 ($MILLION)
- TABLE 76. AFRICA CONSTRUCTION FLOORING MARKET, BY MATERIAL, 2020-2032 ($MILLION)
- TABLE 77. AFRICA CONSTRUCTION FLOORING MARKET, BY END USER, 2020-2032 ($MILLION)
- TABLE 78. J&J INDUSTRIES, INC.: KEY EXECUTIVES
- TABLE 79. J&J INDUSTRIES, INC.: COMPANY SNAPSHOT
- TABLE 80. J&J INDUSTRIES, INC.: SERVICE SEGMENTS
- TABLE 81. J&J INDUSTRIES, INC.: PRODUCT PORTFOLIO
- TABLE 82. SHAW INDUSTRIES GROUP, INC.: KEY EXECUTIVES
- TABLE 83. SHAW INDUSTRIES GROUP, INC.: COMPANY SNAPSHOT
- TABLE 84. SHAW INDUSTRIES GROUP, INC.: PRODUCT SEGMENTS
- TABLE 85. SHAW INDUSTRIES GROUP, INC.: PRODUCT PORTFOLIO
- TABLE 86. ARMSTRONG: KEY EXECUTIVES
- TABLE 87. ARMSTRONG: COMPANY SNAPSHOT
- TABLE 88. ARMSTRONG: SERVICE SEGMENTS
- TABLE 89. ARMSTRONG: PRODUCT PORTFOLIO
- TABLE 90. MOHAWK: KEY EXECUTIVES
- TABLE 91. MOHAWK: COMPANY SNAPSHOT
- TABLE 92. MOHAWK: SERVICE SEGMENTS
- TABLE 93. MOHAWK: PRODUCT PORTFOLIO
- TABLE 94. MOHAWK: KEY STRATERGIES
- TABLE 95. TARKETT GROUP: KEY EXECUTIVES
- TABLE 96. TARKETT GROUP: COMPANY SNAPSHOT
- TABLE 97. TARKETT GROUP: PRODUCT SEGMENTS
- TABLE 98. TARKETT GROUP: PRODUCT PORTFOLIO
- TABLE 99. BEAULIEU INTERNATIONAL GROUP NV: KEY EXECUTIVES
- TABLE 100. BEAULIEU INTERNATIONAL GROUP NV: COMPANY SNAPSHOT
- TABLE 101. BEAULIEU INTERNATIONAL GROUP NV: SERVICE SEGMENTS
- TABLE 102. BEAULIEU INTERNATIONAL GROUP NV: PRODUCT PORTFOLIO
- TABLE 103. IRON WOODS: KEY EXECUTIVES
- TABLE 104. IRON WOODS: COMPANY SNAPSHOT
- TABLE 105. IRON WOODS: PRODUCT SEGMENTS
- TABLE 106. IRON WOODS: PRODUCT PORTFOLIO
- TABLE 107. INTERFACE INC.: KEY EXECUTIVES
- TABLE 108. INTERFACE INC.: COMPANY SNAPSHOT
- TABLE 109. INTERFACE INC.: SERVICE SEGMENTS
- TABLE 110. INTERFACE INC.: PRODUCT PORTFOLIO
- TABLE 111. TOLI CORPORATION: KEY EXECUTIVES
- TABLE 112. TOLI CORPORATION: COMPANY SNAPSHOT
- TABLE 113. TOLI CORPORATION: PRODUCT SEGMENTS
- TABLE 114. TOLI CORPORATION: PRODUCT PORTFOLIO
- TABLE 115. ECORE INTERNATIONAL, INC.: KEY EXECUTIVES
- TABLE 116. ECORE INTERNATIONAL, INC.: COMPANY SNAPSHOT
- TABLE 117. ECORE INTERNATIONAL, INC.: PRODUCT SEGMENTS
- TABLE 118. ECORE INTERNATIONAL, INC.: PRODUCT PORTFOLIO
- TABLE 119. ECORE INTERNATIONAL, INC.: KEY STRATERGIES
LIST OF FIGURES
- FIGURE 01. CONSTRUCTION FLOORING MARKET, 2020-2032
- FIGURE 02. SEGMENTATION OF CONSTRUCTION FLOORING MARKET,2020-2032
- FIGURE 03. TOP IMPACTING FACTORS IN CONSTRUCTION FLOORING MARKET (2022 TO 2032)
- FIGURE 04. TOP INVESTMENT POCKETS IN CONSTRUCTION FLOORING MARKET (2023-2032)
- FIGURE 05. LOW BARGAINING POWER OF SUPPLIERS
- FIGURE 06. LOW THREAT OF NEW ENTRANTS
- FIGURE 07. LOW THREAT OF SUBSTITUTES
- FIGURE 08. LOW INTENSITY OF RIVALRY
- FIGURE 09. LOW BARGAINING POWER OF BUYERS
- FIGURE 10. GLOBAL CONSTRUCTION FLOORING MARKET:DRIVERS, RESTRAINTS AND OPPORTUNITIES
- FIGURE 11. CONSTRUCTION FLOORING MARKET, BY PRINTING TECHNOLOGY, 2020 AND 2032(%)
- FIGURE 12. COMPARATIVE SHARE ANALYSIS OF CONSTRUCTION FLOORING MARKET FOR DIGITAL, BY COUNTRY 2020 AND 2032(%)
- FIGURE 13. COMPARATIVE SHARE ANALYSIS OF CONSTRUCTION FLOORING MARKET FOR TRADITIONAL, BY COUNTRY 2020 AND 2032(%)
- FIGURE 14. CONSTRUCTION FLOORING MARKET, BY MATERIAL, 2020 AND 2032(%)
- FIGURE 15. COMPARATIVE SHARE ANALYSIS OF CONSTRUCTION FLOORING MARKET FOR WOOD, BY COUNTRY 2020 AND 2032(%)
- FIGURE 16. COMPARATIVE SHARE ANALYSIS OF CONSTRUCTION FLOORING MARKET FOR STONE, BY COUNTRY 2020 AND 2032(%)
- FIGURE 17. COMPARATIVE SHARE ANALYSIS OF CONSTRUCTION FLOORING MARKET FOR CERAMIC, BY COUNTRY 2020 AND 2032(%)
- FIGURE 18. COMPARATIVE SHARE ANALYSIS OF CONSTRUCTION FLOORING MARKET FOR LAMINATE, BY COUNTRY 2020 AND 2032(%)
- FIGURE 19. COMPARATIVE SHARE ANALYSIS OF CONSTRUCTION FLOORING MARKET FOR OTHERS, BY COUNTRY 2020 AND 2032(%)
- FIGURE 20. CONSTRUCTION FLOORING MARKET, BY END USER, 2020 AND 2032(%)
- FIGURE 21. COMPARATIVE SHARE ANALYSIS OF CONSTRUCTION FLOORING MARKET FOR RESIDENTIAL, BY COUNTRY 2020 AND 2032(%)
- FIGURE 22. COMPARATIVE SHARE ANALYSIS OF CONSTRUCTION FLOORING MARKET FOR NON-RESIDENTIAL, BY COUNTRY 2020 AND 2032(%)
- FIGURE 23. CONSTRUCTION FLOORING MARKET BY REGION, 2020 AND 2032(%)
- FIGURE 24. U.S. CONSTRUCTION FLOORING MARKET, 2020-2032 ($MILLION)
- FIGURE 25. CANADA CONSTRUCTION FLOORING MARKET, 2020-2032 ($MILLION)
- FIGURE 26. MEXICO CONSTRUCTION FLOORING MARKET, 2020-2032 ($MILLION)
- FIGURE 27. GERMANY CONSTRUCTION FLOORING MARKET, 2020-2032 ($MILLION)
- FIGURE 28. FRANCE CONSTRUCTION FLOORING MARKET, 2020-2032 ($MILLION)
- FIGURE 29. ITALY CONSTRUCTION FLOORING MARKET, 2020-2032 ($MILLION)
- FIGURE 30. UK CONSTRUCTION FLOORING MARKET, 2020-2032 ($MILLION)
- FIGURE 31. REST OF EUROPE CONSTRUCTION FLOORING MARKET, 2020-2032 ($MILLION)
- FIGURE 32. CHINA CONSTRUCTION FLOORING MARKET, 2020-2032 ($MILLION)
- FIGURE 33. JAPAN CONSTRUCTION FLOORING MARKET, 2020-2032 ($MILLION)
- FIGURE 34. INDIA CONSTRUCTION FLOORING MARKET, 2020-2032 ($MILLION)
- FIGURE 35. SOUTH KOREA CONSTRUCTION FLOORING MARKET, 2020-2032 ($MILLION)
- FIGURE 36. REST OF ASIA-PACIFIC CONSTRUCTION FLOORING MARKET, 2020-2032 ($MILLION)
- FIGURE 37. LATIN AMERICA CONSTRUCTION FLOORING MARKET, 2020-2032 ($MILLION)
- FIGURE 38. MIDDLE EAST CONSTRUCTION FLOORING MARKET, 2020-2032 ($MILLION)
- FIGURE 39. AFRICA CONSTRUCTION FLOORING MARKET, 2020-2032 ($MILLION)
- FIGURE 40. TOP WINNING STRATEGIES, BY YEAR (2022)
- FIGURE 41. TOP WINNING STRATEGIES, BY DEVELOPMENT (2022)
- FIGURE 42. TOP WINNING STRATEGIES, BY COMPANY (2022)
- FIGURE 43. PRODUCT MAPPING OF TOP 10 PLAYERS
- FIGURE 44. COMPETITIVE DASHBOARD
- FIGURE 45. COMPETITIVE HEATMAP: CONSTRUCTION FLOORING MARKET
- FIGURE 46. TOP PLAYER POSITIONING, 2020
- FIGURE 47. INTERFACE INC.: NET SALES, 2020-2022 ($MILLION)
- FIGURE 48. INTERFACE INC.: RESEARCH & DEVELOPMENT EXPENDITURE, 2020-2022 ($MILLION)
- FIGURE 49. INTERFACE INC.: REVENUE SHARE BY SEGMENT, 2022 (%)
- FIGURE 50. INTERFACE INC.: REVENUE SHARE BY REGION, 2022 (%)
 全球地板市場規模、佔有率、成長分析、按產品、按應用分類 - 產業預測,2024-2031 年
 模組化地板市場 - 全球產業規模、佔有率、趨勢、機會和預測,按產品類型、組件、最終用戶、地區、競爭細分,2019-2029F
 2024-2028年全球木地板市場
 工業混凝土地板市場規模和預測、全球和地區佔有率、趨勢和成長機會分析報告範圍:按類型、應用和最終用途行業
 2024-2028年全球地板市場
 硬木地板:市場佔有率分析、行業趨勢和統計、成長預測(2024-2029)
 2024 年硬面地板材料全球市場報告
 全球硬木地板市場 - 2024-2031
 2024 年模組化地板材料全球市場報告
 模組化地板市場:按產品類型、應用分類 - 2024-2030 年全球預測