


 |
市場調查報告書
商品編碼
1344434
電解質混合市場:各類型,各終端用戶,各流通管道:全球機會分析與產業預測,2022-2031年Electrolyte Mixes Market By Type, By End User, By Distribution Channels : Global Opportunity Analysis and Industry Forecast, 2022-2031 |
||||||
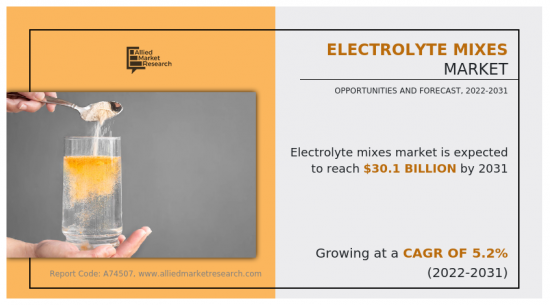
根據Allied Market Research發布的最新報告《電解質混合市場》,電解質混合市場將在2022年達到177億美元,2031年達到301億美元,複合年增長率預計為5.2%。
電解質混合物是一種粉末或液體飲料補充劑,是電解質、鈉、鉀、鎂和鈣等礦物質的混合物,這些礦物質對於身體的正常運作至關重要。將電解質混合物添加到水和其他飲料中,以補充運動期間或脫水時損失的電解質。運動員、健身愛好者和生活方式活躍的人通常會使用它來支持水分、提高表現和幫助恢復。電解質混合物也可用於治療腹瀉和嘔吐等疾病引起的脫水。
老化人口的快速成長是推動電解質混合物市場成長的關鍵因素。這是因為隨著年齡的增長,吸收和保留最佳健康所需的必需礦物質和電解質的效率會降低。鈉、鉀、鈣和鎂等電解質在調節老年人的體液平衡、神經和肌肉功能以及血壓等身體功能方面發揮重要作用。
目錄
第1章 簡介
第2章 摘要整理
第3章 市場概要
- 市場定義和範圍
- 主要調查結果
- 影響要素
- 主要的投資機會
- 波特的五力分析
- 市場動態
- 促進因素
- 消費者對健康和保健的興趣日益濃厚
- 慢性病激增
- 對功能性飲料的需求不斷增加
- 阻礙因素
- 消費者意識有限
- 替代品的可用性
- 機會
- 對天然和有機產品的需求激增
- 運動和健身活動越來越受歡迎
- 促進因素
- COVID-19對市場的影響分析
- 價值鏈分析
第4章 電解質混合市場:各類型
- 運動飲料
- 電解質平板電腦
- 電解質粉
第5章 電解質混合市場:各終端用戶
- 住宅用
- 商業用
第6章 電解質混合市場:各流通管道
- 大賣場和超級市場
- 專賣店
- 電子商務
- B2B
第7章 電解質混合市場:各地區
- 北美
- 美國
- 加拿大
- 墨西哥
- 歐洲
- 英國
- 德國
- 法國
- 義大利
- 西班牙
- 其他歐洲
- 亞太地區
- 中國
- 日本
- 印度
- 澳洲
- 韓國
- 其他亞太地區
- 南美·中東·非洲
- 巴西
- 阿根廷
- 南非
- 其他地區
第8章 競爭情形
- 簡介
- 主要成功策略
- 主要10企業的產品製圖
- 競爭儀表板
- 競爭熱圖
- 主要企業的定位,2022年
第9章 企業簡介
- Atlantic Essential Products, Inc.
- Dr. Price's Vitamins
- First Endurance
- GU Energy Labs
- Halewood Laboratories Pvt. Ltd.
- Hammer Nutrition
- Nutricost
- Skratch Labs, LLC
- Ultima Health Products, Inc.
- Sequel Natural LLC
- Denver Bodega LLC
- GlaxoSmithKline plc
- Unilever PLC
- Nestle S.A.
- PepsiCo, Inc.
According to a new report published by Allied Market Research, titled, "Electrolyte Mixes Market," The electrolyte mixes market was valued at $17.7 billion in 2022, and is estimated to reach $30.1 billion by 2031, growing at a CAGR of 5.2% from 2022 to 2031.
An electrolyte mix is a powdered or liquid beverage supplement that contains a blend of electrolytes, which are minerals such as sodium, potassium, magnesium, and calcium that are essential for the proper functioning of the body. Electrolyte mixes are added to water or other beverages to help replace electrolytes lost during physical activity or as a result of dehydration. They are commonly used by athletes, fitness enthusiasts, and people with active lifestyles to support hydration, improve performance, and aid in recovery. Electrolyte mixes can be used as a remedy for dehydration caused by illnesses such as diarrhea or vomiting.
Surge in aging population is a key factor that drives the growth of the electrolyte mix market. This is attributed to the fact that as people age, their bodies become less efficient at absorbing and retaining the essential minerals and electrolytes required for optimal health. Electrolytes such as sodium, potassium, calcium, and magnesium play crucial roles in regulating bodily functions such as fluid balance, nerve & muscle functions, and blood pressure among aged individuals.
In addition, with growing age, the risk of dehydration and electrolyte imbalances increases, which can lead to a range of health problems. Moreover, many seniors may have medical conditions that require them to take medications that can affect electrolyte balance. Therefore, there is a growing demand for electrolyte mixes and supplements that can help seniors maintain optimal electrolyte levels and support their overall health and well-being.
Furthermore, increase in trend of active aging and rise in focus on healthy lifestyles among seniors have contributed to the demand for electrolyte mixes. Many seniors are interested in maintaining their physical fitness and staying active, and electrolyte mixes can help them replenish lost electrolytes during exercise and physical activity.
However, health concerns associated with electrolytes hamper the market growth. One of the primary concerns is related to the safety and effectiveness of the products. Consumers may be hesitant to use electrolyte mixes if they are unsure about the quality, purity, and effectiveness of the ingredients. There have been cases of electrolyte mixes being recalled due to contamination or mislabeling, which can lower consumer confidence in the product.
Another health concern that may hamper the market growth is related to the potential side effects of electrolyte mixes. In some cases, consuming too much of certain electrolytes, such as sodium or potassium, can lead to health problems such as high blood pressure or kidney damage. Consumers may be wary of using electrolyte mixes if they are concerned about the potential risks associated with excessive electrolyte consumption.
In addition, some consumers may be hesitant to use electrolyte mixes as they prefer to obtain essential minerals and electrolytes from whole foods and natural sources. They may perceive electrolyte mixes as processed and unnatural and prefer to use alternative methods for maintaining their electrolyte balance.
Furthermore, economic factors may hamper the market growth for electrolyte mixes. Consumers may be hesitant to spend money on electrolyte mixes if they perceive them as unnecessary or expensive compared to other alternatives.
On the contrary, surge in demand for natural and organic products is fostering the growth of the electrolyte mix market. Consumers are increasingly concerned about the quality and purity of the products they consume and are looking for products that are free from artificial ingredients and preservatives. This trend is particularly strong in the health and wellness sector, where consumers are looking for products that support their active lifestyles and promote overall health and well-being.
In response to this demand, many electrolyte mix manufacturers are now offering products made with natural and organic ingredients. These products are often marketed as healthier alternatives to traditional electrolyte mixes and are designed to appeal to health-conscious consumers. They may also be formulated with additional ingredients that have health benefits, such as vitamins, minerals, and antioxidants.
In addition to meeting consumer demand for natural and organic products, the trend toward natural and organic ingredients is helping to differentiate electrolyte mix products in an increasingly competitive market. By offering products with unique and high-quality ingredients, manufacturers can build a loyal customer base and establish themselves as leaders in the market.
The global electrolyte mix market is segmented into type, end user, distribution channel, and region. Depending on type the market is classified into sports drinks, electrolyte tablets, and electrolyte powders. On the basis of end user, it is bifurcated into residential and commercial. By distribution channel, it is classified hypermarket/supermarket, specialty stores, e-commerce, and others. Region wise, the market is analyzed across North America, Europe, Asia-Pacific and LAMEA.
Key players included in the analysis of electrolyte mix market are Atlantic Essentials Products, INC., DR. PRICE'S VITAMINS ,First Endurance, GlaxoSmithKline, GU Energy Labs, Halewood Laboratories, Hammer Nutrition, Liquid IV, Nestle Health Science Company, Nutricost, PepsiCo Inc., Skratch Labs, Ultima Replenisher, and Vega.
The report offers a thorough analysis of Electrolyte Mixes Market with detailed study of various aspects of the market such as market dynamics, vital segments, major geographies, key players, and competitive landscape. The report provides a clear picture of the current market situation and future trends of the Electrolyte Mixes Market based on the impact of various market dynamics and vital forces influencing the market. The drivers and opportunities in the market contributing to the market growth are acknowledged in the market dynamics. Besides, challenges and restraints that hold potential to hamper the market growth are also premeditated in the Electrolyte Mixes Market. Porter's five forces analysis is delivered through the report which precisely highlights the effects of key forces on the Electrolyte Mixes Market. The report offers market size and estimations analyzing Electrolyte Mixes Market through various segments.
In addition, the report includes geographical market analysis of these segments. Each segment entailed in the report is studied at regional and country level as well to provide complete coverage of Electrolyte Mixes Market. The report categorizes the Electrolyte Mixes Market into four major geographies including North America, Europe, Asia-Pacific, and LAMEA. These geographies are further sub-categorized into countries to cover Electrolyte Mixes Market scenario across in respective regions. Furthermore, the report covers competitive scenario of the Electrolyte Mixes Market. The key players operating in the Electrolyte Mixes Market are studied in the report to understand their current market position and competitive strengths in the industry.
The report profiles 10 key companies. Moreover, the company profiles include various data-points such as company overview, company executives, recent financials of the company, major growth strategies espoused by company, new initiatives and advancements by company to sustain and mend their position in the Electrolyte Mixes Market, and others
Key Benefits For Stakeholders
- This report provides a quantitative analysis of the market segments, current trends, estimations, and dynamics of the electrolyte mixes market analysis from 2022 to 2032 to identify the prevailing electrolyte mixes market opportunities.
- The market research is offered along with information related to key drivers, restraints, and opportunities.
- Porter's five forces analysis highlights the potency of buyers and suppliers to enable stakeholders make profit-oriented business decisions and strengthen their supplier-buyer network.
- In-depth analysis of the electrolyte mixes market segmentation assists to determine the prevailing market opportunities.
- Major countries in each region are mapped according to their revenue contribution to the global market.
- Market player positioning facilitates benchmarking and provides a clear understanding of the present position of the market players.
- The report includes the analysis of the regional as well as global electrolyte mixes market trends, key players, market segments, application areas, and market growth strategies.
Key Market Segments
By Type
- Sports drinks
- Electrolyte tablets
- Electrolyte powders
By End User
- Residential
- Commercial
By Distribution Channels
- Hypermarkets and Supermarkets
- Specialty Stores
- E-Commerce
- B2B
By Region
- North America
- U.S.
- Canada
- Mexico
- Europe
- UK
- Germany
- France
- Italy
- Spain
- Rest of Europe
- Asia-Pacific
- China
- Japan
- India
- Australia
- South Korea
- Rest of Asia-Pacific
- LAMEA
- Brazil
- Argentina
- South Africa
- Rest of LAMEA
Key Market Players:
- GU Energy Labs
- Dr. Price's Vitamins
- PepsiCo, Inc.
- Skratch Labs, LLC
- Nestle S.A.
- GlaxoSmithKline plc
- Hammer Nutrition
- Denver Bodega LLC
- First Endurance
- Halewood Laboratories Pvt. Ltd.
- Sequel Natural LLC
- Atlantic Essential Products, Inc.
- Ultima Health Products, Inc.
- Unilever PLC
- Nutricost
TABLE OF CONTENTS
CHAPTER 1: INTRODUCTION
- 1.1. Report description
- 1.2. Key market segments
- 1.3. Key benefits to the stakeholders
- 1.4. Research Methodology
- 1.4.1. Primary research
- 1.4.2. Secondary research
- 1.4.3. Analyst tools and models
CHAPTER 2: EXECUTIVE SUMMARY
- 2.1. CXO Perspective
CHAPTER 3: MARKET OVERVIEW
- 3.1. Market definition and scope
- 3.2. Key findings
- 3.2.1. Top impacting factors
- 3.2.2. Top investment pockets
- 3.3. Porter's five forces analysis
- 3.3.1. Bargaining power of suppliers
- 3.3.2. Bargaining power of buyers
- 3.3.3. Threat of substitutes
- 3.3.4. Threat of new entrants
- 3.3.5. Intensity of rivalry
- 3.4. Market dynamics
- 3.4.1. Drivers
- 3.4.1.1. Increase in consumer interest in health and wellness
- 3.4.1.2. Surge in incidence of chronic diseases
- 3.4.1.3. Rise in demand for functional beverages
- 3.4.1. Drivers
- 3.4.2. Restraints
- 3.4.2.1. Limited consumer awareness
- 3.4.2.2. Availability of substitutes
- 3.4.3. Opportunities
- 3.4.3.1. Surge in demand for natural and organic products
- 3.4.3.2. Rise in popularity of sports and fitness activities
- 3.5. COVID-19 Impact Analysis on the market
- 3.6. Value Chain Analysis
CHAPTER 4: ELECTROLYTE MIXES MARKET, BY TYPE
- 4.1. Overview
- 4.1.1. Market size and forecast
- 4.2. Sports drinks
- 4.2.1. Key market trends, growth factors and opportunities
- 4.2.2. Market size and forecast, by region
- 4.2.3. Market share analysis by country
- 4.3. Electrolyte tablets
- 4.3.1. Key market trends, growth factors and opportunities
- 4.3.2. Market size and forecast, by region
- 4.3.3. Market share analysis by country
- 4.4. Electrolyte powders
- 4.4.1. Key market trends, growth factors and opportunities
- 4.4.2. Market size and forecast, by region
- 4.4.3. Market share analysis by country
CHAPTER 5: ELECTROLYTE MIXES MARKET, BY END USER
- 5.1. Overview
- 5.1.1. Market size and forecast
- 5.2. Residential
- 5.2.1. Key market trends, growth factors and opportunities
- 5.2.2. Market size and forecast, by region
- 5.2.3. Market share analysis by country
- 5.3. Commercial
- 5.3.1. Key market trends, growth factors and opportunities
- 5.3.2. Market size and forecast, by region
- 5.3.3. Market share analysis by country
CHAPTER 6: ELECTROLYTE MIXES MARKET, BY DISTRIBUTION CHANNELS
- 6.1. Overview
- 6.1.1. Market size and forecast
- 6.2. Hypermarkets and Supermarkets
- 6.2.1. Key market trends, growth factors and opportunities
- 6.2.2. Market size and forecast, by region
- 6.2.3. Market share analysis by country
- 6.3. Specialty Stores
- 6.3.1. Key market trends, growth factors and opportunities
- 6.3.2. Market size and forecast, by region
- 6.3.3. Market share analysis by country
- 6.4. E-Commerce
- 6.4.1. Key market trends, growth factors and opportunities
- 6.4.2. Market size and forecast, by region
- 6.4.3. Market share analysis by country
- 6.5. B2B
- 6.5.1. Key market trends, growth factors and opportunities
- 6.5.2. Market size and forecast, by region
- 6.5.3. Market share analysis by country
CHAPTER 7: ELECTROLYTE MIXES MARKET, BY REGION
- 7.1. Overview
- 7.1.1. Market size and forecast By Region
- 7.2. North America
- 7.2.1. Key trends and opportunities
- 7.2.2. Market size and forecast, by Type
- 7.2.3. Market size and forecast, by End User
- 7.2.4. Market size and forecast, by Distribution Channels
- 7.2.5. Market size and forecast, by country
- 7.2.5.1. U.S.
- 7.2.5.1.1. Key market trends, growth factors and opportunities
- 7.2.5.1.2. Market size and forecast, by Type
- 7.2.5.1.3. Market size and forecast, by End User
- 7.2.5.1.4. Market size and forecast, by Distribution Channels
- 7.2.5.2. Canada
- 7.2.5.2.1. Key market trends, growth factors and opportunities
- 7.2.5.2.2. Market size and forecast, by Type
- 7.2.5.2.3. Market size and forecast, by End User
- 7.2.5.2.4. Market size and forecast, by Distribution Channels
- 7.2.5.3. Mexico
- 7.2.5.3.1. Key market trends, growth factors and opportunities
- 7.2.5.3.2. Market size and forecast, by Type
- 7.2.5.3.3. Market size and forecast, by End User
- 7.2.5.3.4. Market size and forecast, by Distribution Channels
- 7.3. Europe
- 7.3.1. Key trends and opportunities
- 7.3.2. Market size and forecast, by Type
- 7.3.3. Market size and forecast, by End User
- 7.3.4. Market size and forecast, by Distribution Channels
- 7.3.5. Market size and forecast, by country
- 7.3.5.1. UK
- 7.3.5.1.1. Key market trends, growth factors and opportunities
- 7.3.5.1.2. Market size and forecast, by Type
- 7.3.5.1.3. Market size and forecast, by End User
- 7.3.5.1.4. Market size and forecast, by Distribution Channels
- 7.3.5.2. Germany
- 7.3.5.2.1. Key market trends, growth factors and opportunities
- 7.3.5.2.2. Market size and forecast, by Type
- 7.3.5.2.3. Market size and forecast, by End User
- 7.3.5.2.4. Market size and forecast, by Distribution Channels
- 7.3.5.3. France
- 7.3.5.3.1. Key market trends, growth factors and opportunities
- 7.3.5.3.2. Market size and forecast, by Type
- 7.3.5.3.3. Market size and forecast, by End User
- 7.3.5.3.4. Market size and forecast, by Distribution Channels
- 7.3.5.4. Italy
- 7.3.5.4.1. Key market trends, growth factors and opportunities
- 7.3.5.4.2. Market size and forecast, by Type
- 7.3.5.4.3. Market size and forecast, by End User
- 7.3.5.4.4. Market size and forecast, by Distribution Channels
- 7.3.5.5. Spain
- 7.3.5.5.1. Key market trends, growth factors and opportunities
- 7.3.5.5.2. Market size and forecast, by Type
- 7.3.5.5.3. Market size and forecast, by End User
- 7.3.5.5.4. Market size and forecast, by Distribution Channels
- 7.3.5.6. Rest of Europe
- 7.3.5.6.1. Key market trends, growth factors and opportunities
- 7.3.5.6.2. Market size and forecast, by Type
- 7.3.5.6.3. Market size and forecast, by End User
- 7.3.5.6.4. Market size and forecast, by Distribution Channels
- 7.4. Asia-Pacific
- 7.4.1. Key trends and opportunities
- 7.4.2. Market size and forecast, by Type
- 7.4.3. Market size and forecast, by End User
- 7.4.4. Market size and forecast, by Distribution Channels
- 7.4.5. Market size and forecast, by country
- 7.4.5.1. China
- 7.4.5.1.1. Key market trends, growth factors and opportunities
- 7.4.5.1.2. Market size and forecast, by Type
- 7.4.5.1.3. Market size and forecast, by End User
- 7.4.5.1.4. Market size and forecast, by Distribution Channels
- 7.4.5.2. Japan
- 7.4.5.2.1. Key market trends, growth factors and opportunities
- 7.4.5.2.2. Market size and forecast, by Type
- 7.4.5.2.3. Market size and forecast, by End User
- 7.4.5.2.4. Market size and forecast, by Distribution Channels
- 7.4.5.3. India
- 7.4.5.3.1. Key market trends, growth factors and opportunities
- 7.4.5.3.2. Market size and forecast, by Type
- 7.4.5.3.3. Market size and forecast, by End User
- 7.4.5.3.4. Market size and forecast, by Distribution Channels
- 7.4.5.4. Australia
- 7.4.5.4.1. Key market trends, growth factors and opportunities
- 7.4.5.4.2. Market size and forecast, by Type
- 7.4.5.4.3. Market size and forecast, by End User
- 7.4.5.4.4. Market size and forecast, by Distribution Channels
- 7.4.5.5. South Korea
- 7.4.5.5.1. Key market trends, growth factors and opportunities
- 7.4.5.5.2. Market size and forecast, by Type
- 7.4.5.5.3. Market size and forecast, by End User
- 7.4.5.5.4. Market size and forecast, by Distribution Channels
- 7.4.5.6. Rest of Asia-Pacific
- 7.4.5.6.1. Key market trends, growth factors and opportunities
- 7.4.5.6.2. Market size and forecast, by Type
- 7.4.5.6.3. Market size and forecast, by End User
- 7.4.5.6.4. Market size and forecast, by Distribution Channels
- 7.5. LAMEA
- 7.5.1. Key trends and opportunities
- 7.5.2. Market size and forecast, by Type
- 7.5.3. Market size and forecast, by End User
- 7.5.4. Market size and forecast, by Distribution Channels
- 7.5.5. Market size and forecast, by country
- 7.5.5.1. Brazil
- 7.5.5.1.1. Key market trends, growth factors and opportunities
- 7.5.5.1.2. Market size and forecast, by Type
- 7.5.5.1.3. Market size and forecast, by End User
- 7.5.5.1.4. Market size and forecast, by Distribution Channels
- 7.5.5.2. Argentina
- 7.5.5.2.1. Key market trends, growth factors and opportunities
- 7.5.5.2.2. Market size and forecast, by Type
- 7.5.5.2.3. Market size and forecast, by End User
- 7.5.5.2.4. Market size and forecast, by Distribution Channels
- 7.5.5.3. South Africa
- 7.5.5.3.1. Key market trends, growth factors and opportunities
- 7.5.5.3.2. Market size and forecast, by Type
- 7.5.5.3.3. Market size and forecast, by End User
- 7.5.5.3.4. Market size and forecast, by Distribution Channels
- 7.5.5.4. Rest of LAMEA
- 7.5.5.4.1. Key market trends, growth factors and opportunities
- 7.5.5.4.2. Market size and forecast, by Type
- 7.5.5.4.3. Market size and forecast, by End User
- 7.5.5.4.4. Market size and forecast, by Distribution Channels
CHAPTER 8: COMPETITIVE LANDSCAPE
- 8.1. Introduction
- 8.2. Top winning strategies
- 8.3. Product Mapping of Top 10 Player
- 8.4. Competitive Dashboard
- 8.5. Competitive Heatmap
- 8.6. Top player positioning, 2022
CHAPTER 9: COMPANY PROFILES
- 9.1. Atlantic Essential Products, Inc.
- 9.1.1. Company overview
- 9.1.2. Key Executives
- 9.1.3. Company snapshot
- 9.1.4. Operating business segments
- 9.1.5. Product portfolio
- 9.2. Dr. Price's Vitamins
- 9.2.1. Company overview
- 9.2.2. Key Executives
- 9.2.3. Company snapshot
- 9.2.4. Operating business segments
- 9.2.5. Product portfolio
- 9.3. First Endurance
- 9.3.1. Company overview
- 9.3.2. Key Executives
- 9.3.3. Company snapshot
- 9.3.4. Operating business segments
- 9.3.5. Product portfolio
- 9.4. GU Energy Labs
- 9.4.1. Company overview
- 9.4.2. Key Executives
- 9.4.3. Company snapshot
- 9.4.4. Operating business segments
- 9.4.5. Product portfolio
- 9.5. Halewood Laboratories Pvt. Ltd.
- 9.5.1. Company overview
- 9.5.2. Key Executives
- 9.5.3. Company snapshot
- 9.5.4. Operating business segments
- 9.5.5. Product portfolio
- 9.6. Hammer Nutrition
- 9.6.1. Company overview
- 9.6.2. Key Executives
- 9.6.3. Company snapshot
- 9.6.4. Operating business segments
- 9.6.5. Product portfolio
- 9.7. Nutricost
- 9.7.1. Company overview
- 9.7.2. Key Executives
- 9.7.3. Company snapshot
- 9.7.4. Operating business segments
- 9.7.5. Product portfolio
- 9.7.6. Key strategic moves and developments
- 9.8. Skratch Labs, LLC
- 9.8.1. Company overview
- 9.8.2. Key Executives
- 9.8.3. Company snapshot
- 9.8.4. Operating business segments
- 9.8.5. Product portfolio
- 9.9. Ultima Health Products, Inc.
- 9.9.1. Company overview
- 9.9.2. Key Executives
- 9.9.3. Company snapshot
- 9.9.4. Operating business segments
- 9.9.5. Product portfolio
- 9.10. Sequel Natural LLC
- 9.10.1. Company overview
- 9.10.2. Key Executives
- 9.10.3. Company snapshot
- 9.10.4. Operating business segments
- 9.10.5. Product portfolio
- 9.11. Denver Bodega LLC
- 9.11.1. Company overview
- 9.11.2. Key Executives
- 9.11.3. Company snapshot
- 9.11.4. Operating business segments
- 9.11.5. Product portfolio
- 9.12. GlaxoSmithKline plc
- 9.12.1. Company overview
- 9.12.2. Key Executives
- 9.12.3. Company snapshot
- 9.12.4. Operating business segments
- 9.12.5. Product portfolio
- 9.12.6. Business performance
- 9.13. Unilever PLC
- 9.13.1. Company overview
- 9.13.2. Key Executives
- 9.13.3. Company snapshot
- 9.13.4. Operating business segments
- 9.13.5. Product portfolio
- 9.13.6. Business performance
- 9.13.7. Key strategic moves and developments
- 9.14. Nestle S.A.
- 9.14.1. Company overview
- 9.14.2. Key Executives
- 9.14.3. Company snapshot
- 9.14.4. Operating business segments
- 9.14.5. Product portfolio
- 9.14.6. Business performance
- 9.14.7. Key strategic moves and developments
- 9.15. PepsiCo, Inc.
- 9.15.1. Company overview
- 9.15.2. Key Executives
- 9.15.3. Company snapshot
- 9.15.4. Operating business segments
- 9.15.5. Product portfolio
- 9.15.6. Business performance
LIST OF TABLES
- TABLE 01. GLOBAL ELECTROLYTE MIXES MARKET, BY TYPE, 2022-2032 ($MILLION)
- TABLE 02. ELECTROLYTE MIXES MARKET FOR SPORTS DRINKS, BY REGION, 2022-2032 ($MILLION)
- TABLE 03. ELECTROLYTE MIXES MARKET FOR ELECTROLYTE TABLETS, BY REGION, 2022-2032 ($MILLION)
- TABLE 04. ELECTROLYTE MIXES MARKET FOR ELECTROLYTE POWDERS, BY REGION, 2022-2032 ($MILLION)
- TABLE 05. GLOBAL ELECTROLYTE MIXES MARKET, BY END USER, 2022-2032 ($MILLION)
- TABLE 06. ELECTROLYTE MIXES MARKET FOR RESIDENTIAL, BY REGION, 2022-2032 ($MILLION)
- TABLE 07. ELECTROLYTE MIXES MARKET FOR COMMERCIAL, BY REGION, 2022-2032 ($MILLION)
- TABLE 08. GLOBAL ELECTROLYTE MIXES MARKET, BY DISTRIBUTION CHANNELS, 2022-2032 ($MILLION)
- TABLE 09. ELECTROLYTE MIXES MARKET FOR HYPERMARKETS AND SUPERMARKETS, BY REGION, 2022-2032 ($MILLION)
- TABLE 10. ELECTROLYTE MIXES MARKET FOR SPECIALTY STORES, BY REGION, 2022-2032 ($MILLION)
- TABLE 11. ELECTROLYTE MIXES MARKET FOR E-COMMERCE, BY REGION, 2022-2032 ($MILLION)
- TABLE 12. ELECTROLYTE MIXES MARKET FOR B2B, BY REGION, 2022-2032 ($MILLION)
- TABLE 13. ELECTROLYTE MIXES MARKET, BY REGION, 2022-2032 ($MILLION)
- TABLE 14. NORTH AMERICA ELECTROLYTE MIXES MARKET, BY TYPE, 2022-2032 ($MILLION)
- TABLE 15. NORTH AMERICA ELECTROLYTE MIXES MARKET, BY END USER, 2022-2032 ($MILLION)
- TABLE 16. NORTH AMERICA ELECTROLYTE MIXES MARKET, BY DISTRIBUTION CHANNELS, 2022-2032 ($MILLION)
- TABLE 17. NORTH AMERICA ELECTROLYTE MIXES MARKET, BY COUNTRY, 2022-2032 ($MILLION)
- TABLE 18. U.S. ELECTROLYTE MIXES MARKET, BY TYPE, 2022-2032 ($MILLION)
- TABLE 19. U.S. ELECTROLYTE MIXES MARKET, BY END USER, 2022-2032 ($MILLION)
- TABLE 20. U.S. ELECTROLYTE MIXES MARKET, BY DISTRIBUTION CHANNELS, 2022-2032 ($MILLION)
- TABLE 21. CANADA ELECTROLYTE MIXES MARKET, BY TYPE, 2022-2032 ($MILLION)
- TABLE 22. CANADA ELECTROLYTE MIXES MARKET, BY END USER, 2022-2032 ($MILLION)
- TABLE 23. CANADA ELECTROLYTE MIXES MARKET, BY DISTRIBUTION CHANNELS, 2022-2032 ($MILLION)
- TABLE 24. MEXICO ELECTROLYTE MIXES MARKET, BY TYPE, 2022-2032 ($MILLION)
- TABLE 25. MEXICO ELECTROLYTE MIXES MARKET, BY END USER, 2022-2032 ($MILLION)
- TABLE 26. MEXICO ELECTROLYTE MIXES MARKET, BY DISTRIBUTION CHANNELS, 2022-2032 ($MILLION)
- TABLE 27. EUROPE ELECTROLYTE MIXES MARKET, BY TYPE, 2022-2032 ($MILLION)
- TABLE 28. EUROPE ELECTROLYTE MIXES MARKET, BY END USER, 2022-2032 ($MILLION)
- TABLE 29. EUROPE ELECTROLYTE MIXES MARKET, BY DISTRIBUTION CHANNELS, 2022-2032 ($MILLION)
- TABLE 30. EUROPE ELECTROLYTE MIXES MARKET, BY COUNTRY, 2022-2032 ($MILLION)
- TABLE 31. UK ELECTROLYTE MIXES MARKET, BY TYPE, 2022-2032 ($MILLION)
- TABLE 32. UK ELECTROLYTE MIXES MARKET, BY END USER, 2022-2032 ($MILLION)
- TABLE 33. UK ELECTROLYTE MIXES MARKET, BY DISTRIBUTION CHANNELS, 2022-2032 ($MILLION)
- TABLE 34. GERMANY ELECTROLYTE MIXES MARKET, BY TYPE, 2022-2032 ($MILLION)
- TABLE 35. GERMANY ELECTROLYTE MIXES MARKET, BY END USER, 2022-2032 ($MILLION)
- TABLE 36. GERMANY ELECTROLYTE MIXES MARKET, BY DISTRIBUTION CHANNELS, 2022-2032 ($MILLION)
- TABLE 37. FRANCE ELECTROLYTE MIXES MARKET, BY TYPE, 2022-2032 ($MILLION)
- TABLE 38. FRANCE ELECTROLYTE MIXES MARKET, BY END USER, 2022-2032 ($MILLION)
- TABLE 39. FRANCE ELECTROLYTE MIXES MARKET, BY DISTRIBUTION CHANNELS, 2022-2032 ($MILLION)
- TABLE 40. ITALY ELECTROLYTE MIXES MARKET, BY TYPE, 2022-2032 ($MILLION)
- TABLE 41. ITALY ELECTROLYTE MIXES MARKET, BY END USER, 2022-2032 ($MILLION)
- TABLE 42. ITALY ELECTROLYTE MIXES MARKET, BY DISTRIBUTION CHANNELS, 2022-2032 ($MILLION)
- TABLE 43. SPAIN ELECTROLYTE MIXES MARKET, BY TYPE, 2022-2032 ($MILLION)
- TABLE 44. SPAIN ELECTROLYTE MIXES MARKET, BY END USER, 2022-2032 ($MILLION)
- TABLE 45. SPAIN ELECTROLYTE MIXES MARKET, BY DISTRIBUTION CHANNELS, 2022-2032 ($MILLION)
- TABLE 46. REST OF EUROPE ELECTROLYTE MIXES MARKET, BY TYPE, 2022-2032 ($MILLION)
- TABLE 47. REST OF EUROPE ELECTROLYTE MIXES MARKET, BY END USER, 2022-2032 ($MILLION)
- TABLE 48. REST OF EUROPE ELECTROLYTE MIXES MARKET, BY DISTRIBUTION CHANNELS, 2022-2032 ($MILLION)
- TABLE 49. ASIA-PACIFIC ELECTROLYTE MIXES MARKET, BY TYPE, 2022-2032 ($MILLION)
- TABLE 50. ASIA-PACIFIC ELECTROLYTE MIXES MARKET, BY END USER, 2022-2032 ($MILLION)
- TABLE 51. ASIA-PACIFIC ELECTROLYTE MIXES MARKET, BY DISTRIBUTION CHANNELS, 2022-2032 ($MILLION)
- TABLE 52. ASIA-PACIFIC ELECTROLYTE MIXES MARKET, BY COUNTRY, 2022-2032 ($MILLION)
- TABLE 53. CHINA ELECTROLYTE MIXES MARKET, BY TYPE, 2022-2032 ($MILLION)
- TABLE 54. CHINA ELECTROLYTE MIXES MARKET, BY END USER, 2022-2032 ($MILLION)
- TABLE 55. CHINA ELECTROLYTE MIXES MARKET, BY DISTRIBUTION CHANNELS, 2022-2032 ($MILLION)
- TABLE 56. JAPAN ELECTROLYTE MIXES MARKET, BY TYPE, 2022-2032 ($MILLION)
- TABLE 57. JAPAN ELECTROLYTE MIXES MARKET, BY END USER, 2022-2032 ($MILLION)
- TABLE 58. JAPAN ELECTROLYTE MIXES MARKET, BY DISTRIBUTION CHANNELS, 2022-2032 ($MILLION)
- TABLE 59. INDIA ELECTROLYTE MIXES MARKET, BY TYPE, 2022-2032 ($MILLION)
- TABLE 60. INDIA ELECTROLYTE MIXES MARKET, BY END USER, 2022-2032 ($MILLION)
- TABLE 61. INDIA ELECTROLYTE MIXES MARKET, BY DISTRIBUTION CHANNELS, 2022-2032 ($MILLION)
- TABLE 62. AUSTRALIA ELECTROLYTE MIXES MARKET, BY TYPE, 2022-2032 ($MILLION)
- TABLE 63. AUSTRALIA ELECTROLYTE MIXES MARKET, BY END USER, 2022-2032 ($MILLION)
- TABLE 64. AUSTRALIA ELECTROLYTE MIXES MARKET, BY DISTRIBUTION CHANNELS, 2022-2032 ($MILLION)
- TABLE 65. SOUTH KOREA ELECTROLYTE MIXES MARKET, BY TYPE, 2022-2032 ($MILLION)
- TABLE 66. SOUTH KOREA ELECTROLYTE MIXES MARKET, BY END USER, 2022-2032 ($MILLION)
- TABLE 67. SOUTH KOREA ELECTROLYTE MIXES MARKET, BY DISTRIBUTION CHANNELS, 2022-2032 ($MILLION)
- TABLE 68. REST OF ASIA-PACIFIC ELECTROLYTE MIXES MARKET, BY TYPE, 2022-2032 ($MILLION)
- TABLE 69. REST OF ASIA-PACIFIC ELECTROLYTE MIXES MARKET, BY END USER, 2022-2032 ($MILLION)
- TABLE 70. REST OF ASIA-PACIFIC ELECTROLYTE MIXES MARKET, BY DISTRIBUTION CHANNELS, 2022-2032 ($MILLION)
- TABLE 71. LAMEA ELECTROLYTE MIXES MARKET, BY TYPE, 2022-2032 ($MILLION)
- TABLE 72. LAMEA ELECTROLYTE MIXES MARKET, BY END USER, 2022-2032 ($MILLION)
- TABLE 73. LAMEA ELECTROLYTE MIXES MARKET, BY DISTRIBUTION CHANNELS, 2022-2032 ($MILLION)
- TABLE 74. LAMEA ELECTROLYTE MIXES MARKET, BY COUNTRY, 2022-2032 ($MILLION)
- TABLE 75. BRAZIL ELECTROLYTE MIXES MARKET, BY TYPE, 2022-2032 ($MILLION)
- TABLE 76. BRAZIL ELECTROLYTE MIXES MARKET, BY END USER, 2022-2032 ($MILLION)
- TABLE 77. BRAZIL ELECTROLYTE MIXES MARKET, BY DISTRIBUTION CHANNELS, 2022-2032 ($MILLION)
- TABLE 78. ARGENTINA ELECTROLYTE MIXES MARKET, BY TYPE, 2022-2032 ($MILLION)
- TABLE 79. ARGENTINA ELECTROLYTE MIXES MARKET, BY END USER, 2022-2032 ($MILLION)
- TABLE 80. ARGENTINA ELECTROLYTE MIXES MARKET, BY DISTRIBUTION CHANNELS, 2022-2032 ($MILLION)
- TABLE 81. SOUTH AFRICA ELECTROLYTE MIXES MARKET, BY TYPE, 2022-2032 ($MILLION)
- TABLE 82. SOUTH AFRICA ELECTROLYTE MIXES MARKET, BY END USER, 2022-2032 ($MILLION)
- TABLE 83. SOUTH AFRICA ELECTROLYTE MIXES MARKET, BY DISTRIBUTION CHANNELS, 2022-2032 ($MILLION)
- TABLE 84. REST OF LAMEA ELECTROLYTE MIXES MARKET, BY TYPE, 2022-2032 ($MILLION)
- TABLE 85. REST OF LAMEA ELECTROLYTE MIXES MARKET, BY END USER, 2022-2032 ($MILLION)
- TABLE 86. REST OF LAMEA ELECTROLYTE MIXES MARKET, BY DISTRIBUTION CHANNELS, 2022-2032 ($MILLION)
- TABLE 87. ATLANTIC ESSENTIAL PRODUCTS, INC.: KEY EXECUTIVES
- TABLE 88. ATLANTIC ESSENTIAL PRODUCTS, INC.: COMPANY SNAPSHOT
- TABLE 89. ATLANTIC ESSENTIAL PRODUCTS, INC.: PRODUCT SEGMENTS
- TABLE 90. ATLANTIC ESSENTIAL PRODUCTS, INC.: PRODUCT PORTFOLIO
- TABLE 91. DR. PRICE'S VITAMINS: KEY EXECUTIVES
- TABLE 92. DR. PRICE'S VITAMINS: COMPANY SNAPSHOT
- TABLE 93. DR. PRICE'S VITAMINS: PRODUCT SEGMENTS
- TABLE 94. DR. PRICE'S VITAMINS: PRODUCT PORTFOLIO
- TABLE 95. FIRST ENDURANCE: KEY EXECUTIVES
- TABLE 96. FIRST ENDURANCE: COMPANY SNAPSHOT
- TABLE 97. FIRST ENDURANCE: PRODUCT SEGMENTS
- TABLE 98. FIRST ENDURANCE: PRODUCT PORTFOLIO
- TABLE 99. GU ENERGY LABS: KEY EXECUTIVES
- TABLE 100. GU ENERGY LABS: COMPANY SNAPSHOT
- TABLE 101. GU ENERGY LABS: PRODUCT SEGMENTS
- TABLE 102. GU ENERGY LABS: PRODUCT PORTFOLIO
- TABLE 103. HALEWOOD LABORATORIES PVT. LTD.: KEY EXECUTIVES
- TABLE 104. HALEWOOD LABORATORIES PVT. LTD.: COMPANY SNAPSHOT
- TABLE 105. HALEWOOD LABORATORIES PVT. LTD.: PRODUCT SEGMENTS
- TABLE 106. HALEWOOD LABORATORIES PVT. LTD.: PRODUCT PORTFOLIO
- TABLE 107. HAMMER NUTRITION: KEY EXECUTIVES
- TABLE 108. HAMMER NUTRITION: COMPANY SNAPSHOT
- TABLE 109. HAMMER NUTRITION: PRODUCT SEGMENTS
- TABLE 110. HAMMER NUTRITION: PRODUCT PORTFOLIO
- TABLE 111. NUTRICOST: KEY EXECUTIVES
- TABLE 112. NUTRICOST: COMPANY SNAPSHOT
- TABLE 113. NUTRICOST: PRODUCT SEGMENTS
- TABLE 114. NUTRICOST: PRODUCT PORTFOLIO
- TABLE 115. NUTRICOST: KEY STRATERGIES
- TABLE 116. SKRATCH LABS, LLC: KEY EXECUTIVES
- TABLE 117. SKRATCH LABS, LLC: COMPANY SNAPSHOT
- TABLE 118. SKRATCH LABS, LLC: PRODUCT SEGMENTS
- TABLE 119. SKRATCH LABS, LLC: PRODUCT PORTFOLIO
- TABLE 120. ULTIMA HEALTH PRODUCTS, INC.: KEY EXECUTIVES
- TABLE 121. ULTIMA HEALTH PRODUCTS, INC.: COMPANY SNAPSHOT
- TABLE 122. ULTIMA HEALTH PRODUCTS, INC.: PRODUCT SEGMENTS
- TABLE 123. ULTIMA HEALTH PRODUCTS, INC.: PRODUCT PORTFOLIO
- TABLE 124. SEQUEL NATURAL LLC: KEY EXECUTIVES
- TABLE 125. SEQUEL NATURAL LLC: COMPANY SNAPSHOT
- TABLE 126. SEQUEL NATURAL LLC: PRODUCT SEGMENTS
- TABLE 127. SEQUEL NATURAL LLC: PRODUCT PORTFOLIO
- TABLE 128. DENVER BODEGA LLC: KEY EXECUTIVES
- TABLE 129. DENVER BODEGA LLC: COMPANY SNAPSHOT
- TABLE 130. DENVER BODEGA LLC: PRODUCT SEGMENTS
- TABLE 131. DENVER BODEGA LLC: PRODUCT PORTFOLIO
- TABLE 132. GLAXOSMITHKLINE PLC: KEY EXECUTIVES
- TABLE 133. GLAXOSMITHKLINE PLC: COMPANY SNAPSHOT
- TABLE 134. GLAXOSMITHKLINE PLC: PRODUCT SEGMENTS
- TABLE 135. GLAXOSMITHKLINE PLC: PRODUCT PORTFOLIO
- TABLE 136. UNILEVER PLC: KEY EXECUTIVES
- TABLE 137. UNILEVER PLC: COMPANY SNAPSHOT
- TABLE 138. UNILEVER PLC: PRODUCT SEGMENTS
- TABLE 139. UNILEVER PLC: PRODUCT PORTFOLIO
- TABLE 140. UNILEVER PLC: KEY STRATERGIES
- TABLE 141. NESTLE S.A.: KEY EXECUTIVES
- TABLE 142. NESTLE S.A.: COMPANY SNAPSHOT
- TABLE 143. NESTLE S.A.: PRODUCT SEGMENTS
- TABLE 144. NESTLE S.A.: PRODUCT PORTFOLIO
- TABLE 145. NESTLE S.A.: KEY STRATERGIES
- TABLE 146. PEPSICO, INC.: KEY EXECUTIVES
- TABLE 147. PEPSICO, INC.: COMPANY SNAPSHOT
- TABLE 148. PEPSICO, INC.: PRODUCT SEGMENTS
- TABLE 149. PEPSICO, INC.: PRODUCT PORTFOLIO
LIST OF FIGURES
- FIGURE 01. ELECTROLYTE MIXES MARKET, 2022-2032
- FIGURE 02. SEGMENTATION OF ELECTROLYTE MIXES MARKET, 2022-2032
- FIGURE 03. TOP INVESTMENT POCKETS IN ELECTROLYTE MIXES MARKET (2022-2031)
- FIGURE 04. LOW BARGAINING POWER OF SUPPLIERS
- FIGURE 05. LOW BARGAINING POWER OF BUYERS
- FIGURE 06. LOW THREAT OF SUBSTITUTES
- FIGURE 07. LOW THREAT OF NEW ENTRANTS
- FIGURE 08. LOW INTENSITY OF RIVALRY
- FIGURE 09. DRIVERS, RESTRAINTS AND OPPORTUNITIES: GLOBALELECTROLYTE MIXES MARKET
- FIGURE 10. VALUE CHAIN ANALYSIS: ELECTROLYTE MIXES MARKET
- FIGURE 11. ELECTROLYTE MIXES MARKET, BY TYPE, 2022(%)
- FIGURE 12. COMPARATIVE SHARE ANALYSIS OF ELECTROLYTE MIXES MARKET FOR SPORTS DRINKS, BY COUNTRY 2022 AND 2032(%)
- FIGURE 13. COMPARATIVE SHARE ANALYSIS OF ELECTROLYTE MIXES MARKET FOR ELECTROLYTE TABLETS, BY COUNTRY 2022 AND 2032(%)
- FIGURE 14. COMPARATIVE SHARE ANALYSIS OF ELECTROLYTE MIXES MARKET FOR ELECTROLYTE POWDERS, BY COUNTRY 2022 AND 2032(%)
- FIGURE 15. ELECTROLYTE MIXES MARKET, BY END USER, 2022(%)
- FIGURE 16. COMPARATIVE SHARE ANALYSIS OF ELECTROLYTE MIXES MARKET FOR RESIDENTIAL, BY COUNTRY 2022 AND 2032(%)
- FIGURE 17. COMPARATIVE SHARE ANALYSIS OF ELECTROLYTE MIXES MARKET FOR COMMERCIAL, BY COUNTRY 2022 AND 2032(%)
- FIGURE 18. ELECTROLYTE MIXES MARKET, BY DISTRIBUTION CHANNELS, 2022(%)
- FIGURE 19. COMPARATIVE SHARE ANALYSIS OF ELECTROLYTE MIXES MARKET FOR HYPERMARKETS AND SUPERMARKETS, BY COUNTRY 2022 AND 2032(%)
- FIGURE 20. COMPARATIVE SHARE ANALYSIS OF ELECTROLYTE MIXES MARKET FOR SPECIALTY STORES, BY COUNTRY 2022 AND 2032(%)
- FIGURE 21. COMPARATIVE SHARE ANALYSIS OF ELECTROLYTE MIXES MARKET FOR E-COMMERCE, BY COUNTRY 2022 AND 2032(%)
- FIGURE 22. COMPARATIVE SHARE ANALYSIS OF ELECTROLYTE MIXES MARKET FOR B2B, BY COUNTRY 2022 AND 2032(%)
- FIGURE 23. ELECTROLYTE MIXES MARKET BY REGION, 2022
- FIGURE 24. U.S. ELECTROLYTE MIXES MARKET, 2022-2032 ($MILLION)
- FIGURE 25. CANADA ELECTROLYTE MIXES MARKET, 2022-2032 ($MILLION)
- FIGURE 26. MEXICO ELECTROLYTE MIXES MARKET, 2022-2032 ($MILLION)
- FIGURE 27. UK ELECTROLYTE MIXES MARKET, 2022-2032 ($MILLION)
- FIGURE 28. GERMANY ELECTROLYTE MIXES MARKET, 2022-2032 ($MILLION)
- FIGURE 29. FRANCE ELECTROLYTE MIXES MARKET, 2022-2032 ($MILLION)
- FIGURE 30. ITALY ELECTROLYTE MIXES MARKET, 2022-2032 ($MILLION)
- FIGURE 31. SPAIN ELECTROLYTE MIXES MARKET, 2022-2032 ($MILLION)
- FIGURE 32. REST OF EUROPE ELECTROLYTE MIXES MARKET, 2022-2032 ($MILLION)
- FIGURE 33. CHINA ELECTROLYTE MIXES MARKET, 2022-2032 ($MILLION)
- FIGURE 34. JAPAN ELECTROLYTE MIXES MARKET, 2022-2032 ($MILLION)
- FIGURE 35. INDIA ELECTROLYTE MIXES MARKET, 2022-2032 ($MILLION)
- FIGURE 36. AUSTRALIA ELECTROLYTE MIXES MARKET, 2022-2032 ($MILLION)
- FIGURE 37. SOUTH KOREA ELECTROLYTE MIXES MARKET, 2022-2032 ($MILLION)
- FIGURE 38. REST OF ASIA-PACIFIC ELECTROLYTE MIXES MARKET, 2022-2032 ($MILLION)
- FIGURE 39. BRAZIL ELECTROLYTE MIXES MARKET, 2022-2032 ($MILLION)
- FIGURE 40. ARGENTINA ELECTROLYTE MIXES MARKET, 2022-2032 ($MILLION)
- FIGURE 41. SOUTH AFRICA ELECTROLYTE MIXES MARKET, 2022-2032 ($MILLION)
- FIGURE 42. REST OF LAMEA ELECTROLYTE MIXES MARKET, 2022-2032 ($MILLION)
- FIGURE 43. TOP WINNING STRATEGIES, BY YEAR
- FIGURE 44. TOP WINNING STRATEGIES, BY DEVELOPMENT
- FIGURE 45. TOP WINNING STRATEGIES, BY COMPANY
- FIGURE 46. PRODUCT MAPPING OF TOP 10 PLAYERS
- FIGURE 47. COMPETITIVE DASHBOARD
- FIGURE 48. COMPETITIVE HEATMAP: ELECTROLYTE MIXES MARKET
- FIGURE 49. TOP PLAYER POSITIONING, 2022
- FIGURE 50. GLAXOSMITHKLINE PLC: NET SALES, 2020-2022 ($MILLION)
- FIGURE 51. GLAXOSMITHKLINE PLC: REVENUE SHARE BY SEGMENT, 2022 (%)
- FIGURE 52. GLAXOSMITHKLINE PLC: REVENUE SHARE BY REGION, 2022 (%)
- FIGURE 53. UNILEVER PLC: NET REVENUE, 2020-2022 ($MILLION)
- FIGURE 54. UNILEVER PLC: RESEARCH & DEVELOPMENT EXPENDITURE, 2020-2022 ($MILLION)
- FIGURE 55. UNILEVER PLC: REVENUE SHARE BY SEGMENT, 2022 (%)
- FIGURE 56. UNILEVER PLC: REVENUE SHARE BY REGION, 2022 (%)
- FIGURE 57. NESTLE S.A.: NET REVENUE, 2020-2022 ($MILLION)
- FIGURE 58. NESTLE S.A.: RESEARCH & DEVELOPMENT EXPENDITURE, 2020-2022 ($MILLION)
- FIGURE 59. NESTLE S.A.: REVENUE SHARE BY SEGMENT, 2022 (%)
- FIGURE 60. NESTLE S.A.: REVENUE SHARE BY REGION, 2022 (%)
- FIGURE 61. PEPSICO, INC.: NET REVENUE, 2020-2022 ($MILLION)
- FIGURE 62. PEPSICO, INC.: RESEARCH & DEVELOPMENT EXPENDITURE, 2020-2022 ($MILLION)
- FIGURE 63. PEPSICO, INC.: REVENUE SHARE BY SEGMENT, 2022 (%)
- FIGURE 64. PEPSICO, INC.: REVENUE SHARE BY REGION, 2022 (%)


