


 |
市場調查報告書
商品編碼
1298265
氣味傳感器市場:按傳感器類型、設備類型、應用、最終用途行業:2021-2031 年全球機會分析和行業預測Odor Sensor Market By Sensor Type, By Instrument Type, By Application Areas, By End Use Industry : Global Opportunity Analysis and Industry Forecast, 2021-2031 |
||||||
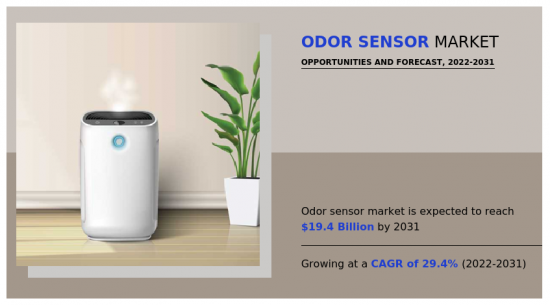
2021年全球氣味傳感器市場價值為15億美元,預計2022年至2031年復合年增長率為29.4%,到2031年達到194億美元。
氣味傳感器是設計用於檢測和測量各種揮發性有機化合物 (VOC) 和引起特定氣味的氣體的存在的設備。這些傳感器結合物理和化學原理來檢測和量化空氣中特定氣體的濃度。氣味傳感器的主要部件包括傳感元件、信號處理單元和電源。傳感元件通常由能夠檢測特定氣體或揮發性有機化合物並產生可測量的電信號作為響應的材料製成。信號處理單元負責將電信號轉換成可以解釋和分析的形式,電源提供操作傳感器所需的能量。
氣味傳感器應用廣泛,包括空氣質量監測、食品安全和環境保護。它還用於 HVAC 系統中的室內空氣質量控制以及工業和住宅應用中的氣體洩漏檢測。此外,氣味傳感器在汽車、食品和飲料以及醫療保健行業中具有多種用途,包括空氣質量監測、質量控制和患者監測。
由於人們對空氣污染及其對醫療保健的負面影響的認識不斷增強,對智能家居和樓宇自動化的需求不斷增加,以及對食品安全和質量控制的需求不斷增加,氣味傳感器適配器市場預計在預測期內將大幅增長。此外,醫療保健和醫療診斷領域的新興應用預計將為預測期內的市場增長提供利潤豐厚的機會。相反,氣味傳感器的高成本和新興國家氣味傳感器的技術限制是氣味傳感器適配器市場的一些市場限制因素。
氣味傳感器市場根據傳感器類型、設備類型、應用領域、最終用途行業和地區進行細分。根據傳感器類型,市場分為生物傳感器、化學傳感器、質譜傳感器、差分光學吸收光譜儀等。根據設備類型,市場分為單元件氣味傳感器和多氣味傳感器。
根據應用,市場分為氣味可視化和標準化、食品質量控制、醫療診斷、空氣控制、環境監測等。按最終用途行業,市場分為軍事和國防、農業、醫療保健、HoReCa、娛樂、可再生能源、電力和廢物管理、食品和飲料、化妝品等。
按地區劃分,氣味傳感器市場趨勢為北美(美國、加拿大、墨西哥)、歐洲(英國、德國、法國、意大利、歐洲其他地區)、亞太地區(中國、日本、印度、韓國、台灣、亞洲其他地區)、太平洋地區)以及亞太地區其他地區(南美洲、中東和非洲)。亞太地區作為氣味傳感器的市場進入者佔據著重要地位。
目錄
第 1 章 簡介
第二章執行摘要
第三章市場概況
- 市場定義和範圍
- 主要發現
- 影響因素
- 主要投資機會
- 波特五力分析
- 供應商的議價能力
- 買方議價能力
- 替代品的威脅
- 新進入者的威脅
- 競爭強度
- 市場動態
- 促進者
- 氣味傳感器成本高
- 新興國家氣味傳感器的技術限制
- 抑製劑
- 人們越來越意識到空氣污染及其對醫療保健的負面影響
- 對智能家居和樓宇自動化的需求不斷增長
- 對食品安全和質量控制的需求不斷增長
- 機會
- 醫療保健和醫療診斷中的新興應用
- 促進者
- COVID-19 的市場影響分析
4 氣味傳感器市場(按傳感器類型)
- 概述
- 市場規模及預測
- 生物傳感器
- 主要市場趨勢、增長動力和機遇
- 市場規模/預測:按地區
- 市場份額分析:按國家分類
- 化學傳感器
- 主要市場趨勢、增長動力和機遇
- 市場規模/預測:按地區
- 市場份額分析:按國家分類
- 質譜傳感器
- 主要市場趨勢、增長動力和機遇
- 市場規模/預測:按地區
- 市場份額分析:按國家分類
- 差分光學吸收光譜儀
- 主要市場趨勢、增長動力和機遇
- 市場規模/預測:按地區
- 市場份額分析:按國家分類
- 其他
- 主要市場趨勢、增長動力和機遇
- 市場規模/預測:按地區
- 市場份額分析:按國家分類
5.氣味傳感器市場,按設備類型
- 概述
- 市場規模及預測
- 單元件氣味傳感器
- 主要市場趨勢、增長動力和機遇
- 市場規模/預測:按地區
- 市場份額分析:按國家分類
- 多種氣味傳感器
- 主要市場趨勢、增長動力和機遇
- 市場規模/預測:按地區
- 市場份額分析:按國家分類
6. 氣味傳感器市場(按應用)
- 概述
- 市場規模及預測
- 氣味可視化和標準化
- 主要市場趨勢、增長動力和機遇
- 市場規模/預測:按地區
- 市場份額分析:按國家分類
- 食品質量控制
- 主要市場趨勢、增長動力和機遇
- 市場規模/預測:按地區
- 市場份額分析:按國家分類
- 醫學診斷
- 主要市場趨勢、增長動力和機遇
- 市場規模/預測:按地區
- 市場份額分析:按國家分類
- 空氣控制和環境監測
- 主要市場趨勢、增長動力和機遇
- 市場規模/預測:按地區
- 市場份額分析:按國家分類
- 其他
- 主要市場趨勢、增長動力和機遇
- 市場規模/預測:按地區
- 市場份額分析:按國家分類
7. 氣味傳感器市場(按最終用途行業)
- 概述
- 市場規模/預測
- 軍事/國防
- 主要市場趨勢、增長動力和機遇
- 市場規模/預測:按地區
- 市場份額分析:按國家分類
- 農業
- 主要市場趨勢、增長動力和機遇
- 市場規模/預測:按地區
- 市場份額分析:按國家分類
- 衛生保健
- 主要市場趨勢、增長動力和機遇
- 市場規模/預測:按地區
- 市場份額分析:按國家分類
- 衛生保健
- 主要市場趨勢、增長動力和機遇
- 市場規模/預測:按地區
- 市場份額分析:按國家分類
- 娛樂
- 主要市場趨勢、增長動力和機遇
- 市場規模/預測:按地區
- 市場份額分析:按國家分類
- 可再生能源發電和廢物管理
- 主要市場趨勢、增長動力和機遇
- 市場規模/預測:按地區
- 市場份額分析:按國家分類
- 飲食
- 主要市場趨勢、增長動力和機遇
- 市場規模/預測:按地區
- 市場份額分析:按國家分類
- 化妝品
- 主要市場趨勢、增長動力和機遇
- 市場規模/預測:按地區
- 市場份額分析:按國家分類
- 其他
- 主要市場趨勢、增長動力和機遇
- 市場規模/預測:按地區
- 市場份額分析:按國家分類
8.按地區劃分的氣味傳感器市場
- 概述
- 市場規模/預測:按地區
- 北美
- 主要趨勢和機遇
- 市場規模和預測:按傳感器類型
- 市場規模/預測:按設備類型
- 市場規模/預測:按應用領域
- 市場規模和預測:按最終用途行業
- 市場規模/預測:按國家
- 美國
- 主要市場趨勢、增長動力和機遇
- 市場規模和預測:按傳感器類型
- 市場規模/預測:按設備類型
- 市場規模/預測:按應用領域
- 市場規模和預測:按最終用途行業
- 加拿大
- 主要市場趨勢、增長動力和機遇
- 市場規模和預測:按傳感器類型
- 市場規模/預測:按設備類型
- 市場規模/預測:按應用領域
- 市場規模和預測:按最終用途行業
- 墨西哥
- 主要市場趨勢、增長動力和機遇
- 市場規模和預測:按傳感器類型
- 市場規模/預測:按設備類型
- 市場規模/預測:按應用領域
- 市場規模和預測:按最終用途行業
- 歐洲
- 主要趨勢和機遇
- 市場規模和預測:按傳感器類型
- 市場規模/預測:按設備類型
- 市場規模/預測:按應用領域
- 市場規模和預測:按最終用途行業
- 市場規模/預測:按國家
- 英國
- 主要市場趨勢、增長動力和機遇
- 市場規模和預測:按傳感器類型
- 市場規模/預測:按設備類型
- 市場規模/預測:按應用領域
- 市場規模和預測:按最終用途行業
- 德國
- 主要市場趨勢、增長動力和機遇
- 市場規模和預測:按傳感器類型
- 市場規模/預測:按設備類型
- 市場規模/預測:按應用領域
- 市場規模和預測:按最終用途行業
- 法國
- 主要市場趨勢、增長動力和機遇
- 市場規模和預測:按傳感器類型
- 市場規模/預測:按設備類型
- 市場規模/預測:按應用領域
- 市場規模和預測:按最終用途行業
- 意大利
- 主要市場趨勢、增長動力和機遇
- 市場規模和預測:按傳感器類型
- 市場規模/預測:按設備類型
- 市場規模/預測:按應用領域
- 市場規模和預測:按最終用途行業
- 歐洲其他地區
- 主要市場趨勢、增長動力和機遇
- 市場規模和預測:按傳感器類型
- 市場規模/預測:按設備類型
- 市場規模/預測:按應用領域
- 市場規模和預測:按最終用途行業
- 亞太地區
- 主要趨勢和機遇
- 市場規模和預測:按傳感器類型
- 市場規模/預測:按設備類型
- 市場規模/預測:按應用領域
- 市場規模和預測:按最終用途行業
- 市場規模/預測:按國家
- 中國
- 主要市場趨勢、增長動力和機遇
- 市場規模和預測:按傳感器類型
- 市場規模/預測:按設備類型
- 市場規模/預測:按應用領域
- 市場規模和預測:按最終用途行業
- 日本
- 主要市場趨勢、增長動力和機遇
- 市場規模和預測:按傳感器類型
- 市場規模/預測:按設備類型
- 市場規模/預測:按應用領域
- 市場規模和預測:按最終用途行業
- 印度
- 主要市場趨勢、增長動力和機遇
- 市場規模和預測:按傳感器類型
- 市場規模/預測:按設備類型
- 市場規模/預測:按應用領域
- 市場規模和預測:按最終用途行業
- 韓國
- 主要市場趨勢、增長動力和機遇
- 市場規模和預測:按傳感器類型
- 市場規模/預測:按設備類型
- 市場規模/預測:按應用領域
- 市場規模和預測:按最終用途行業
- 台灣
- 主要市場趨勢、增長動力和機遇
- 市場規模和預測:按傳感器類型
- 市場規模/預測:按設備類型
- 市場規模/預測:按應用領域
- 市場規模和預測:按最終用途行業
- 亞太其他地區
- 主要市場趨勢、增長動力和機遇
- 市場規模和預測:按傳感器類型
- 市場規模/預測:按設備類型
- 市場規模/預測:按應用領域
- 市場規模和預測:按最終用途行業
- 拉丁美洲/中東/非洲
- 主要趨勢和機遇
- 市場規模和預測:按傳感器類型
- 市場規模/預測:按設備類型
- 市場規模/預測:按應用領域
- 市場規模和預測:按最終用途行業
- 市場規模/預測:按國家
- 拉丁美洲
- 主要市場趨勢、增長動力和機遇
- 市場規模和預測:按傳感器類型
- 市場規模/預測:按設備類型
- 市場規模/預測:按應用領域
- 市場規模和預測:按最終用途行業
- 中東
- 主要市場趨勢、增長動力和機遇
- 市場規模和預測:按傳感器類型
- 市場規模/預測:按設備類型
- 市場規模/預測:按應用領域
- 市場規模和預測:按最終用途行業
- 非洲市場
- 主要市場趨勢、增長動力和機遇
- 市場規模和預測:按傳感器類型
- 市場規模/預測:按設備類型
- 市場規模/預測:按應用領域
- 市場規模和預測:按最終用途行業
第9章 競爭格局
- 介紹
- 關鍵成功策略
- 10大公司產品圖
- 比賽儀表板
- 比賽熱圖
- 2021 年頂級公司定位
第十章公司簡介
- Figaro Engineering Inc.
- Panasonic Corporation
- Honeywell International Inc.
- Aryballe Technologies
- Membrapor
- Alphasense
- Aeroqual
- Drager
- Comon Invent B.V.
- Odotech Inc.(Envirosuite Ltd)
- The eNose Company
- Electronic Sensor Technology
The global odor sensor market was valued at $1.5 billion in 2021, and is projected to reach $19.4 billion by 2031, growing at a CAGR of 29.4% from 2022 to 2031. Odor sensors are devices that are designed to detect and measure the presence of various volatile organic compounds (VOCs) and gases, which are responsible for specific odors. These sensors work by using a combination of physical and chemical principles to detect and quantify the concentration of specific gases in the air. The main components of an odor sensor include a sensing element, a signal processing unit, and a power source. The sensing element is usually made of a material that can detect specific gases or VOCs and produce a measurable electrical signal in response. The signal processing unit is responsible for converting the electrical signal into a form that can be interpreted and analyzed, while the power source provides the energy needed to operate the sensor.
Odor sensors are used in a wide range of applications, including air quality monitoring, food safety, and environmental protection. They are also used in HVAC systems for indoor air quality control, as well as in industrial and residential areas for gas leak detection. Additionally, odor sensors are used in the automotive, food and beverage, and healthcare industries for various purposes, such as air quality monitoring, quality control, and patient monitoring.
The odor sensors adapters market is expected to grow significantly during the forecast period, owing rise in awareness of air pollution and its negative healthcare effects, rising demand for smart home and building automation, and growing demand for food safety and quality control. Furthermore, emerging applications in healthcare and medical diagnosis is expected to provide lucrative opportunities for market growth during the forecast period. On the contrary, the high cost of odor sensors and technological limitation of odor sensors in emerging economies, are some of the market restraints for odor sensors adapters market.
The odor sensors market is segmented on the basis of sensor type, instrument type, application areas, end use industry and region. On the basis of sensor type, the market is divided into biosensors, chemical sensors, mass spectrometry sensors, differential optical absorption spectrometers, and others. Based on instrument type, the market is segregated into One element odor sensors, and multiodor sensors.
Based on application areas, the market is segregated into smell visualization and standardization, food quality control, medical diagnosis, air control, environmental monitoring, and others. Based on end use industry, the market is segregated into military and defense, agriculture, healthcare, HoReCa, entertainment, renewal energy generation and waste management, food and beverages, cosmetics, and others.
Region-wise, the Odor sensors Market trends are analyzed across North America (the U.S., Canada, and Mexico), Europe (UK, Germany, France, Italy, and Rest of Europe), Asia-Pacific (China, Japan, India, South Korea, Taiwan, and Rest of Asia-Pacific), and LAMEA (Latin America, Middle East, and Africa). Asia-Pacific remains a significant participant in the Odor sensors market.
The key players that operate in the market include: Aeroqual, Alphasense, Aryballe Technologies, Comon Invent B.V., Drager, Electronic Sensor Technology, Figaro Engineering Inc., Honeywell International Inc., Membrapor, Odotech Inc. (Envirosuite Ltd), Panasonic Corporation, and The ENose Company..
Key Benefits For Stakeholders
- This report provides a quantitative analysis of the market segments, current trends, estimations, and dynamics of the odor sensor market analysis from 2021 to 2031 to identify the prevailing odor sensor market opportunities.
- The market research is offered along with information related to key drivers, restraints, and opportunities.
- Porter's five forces analysis highlights the potency of buyers and suppliers to enable stakeholders make profit-oriented business decisions and strengthen their supplier-buyer network.
- In-depth analysis of the odor sensor market segmentation assists to determine the prevailing market opportunities.
- Major countries in each region are mapped according to their revenue contribution to the global market.
- Market player positioning facilitates benchmarking and provides a clear understanding of the present position of the market players.
- The report includes the analysis of the regional as well as global odor sensor market trends, key players, market segments, application areas, and market growth strategies.
Key Market Segments
By Application Areas
- Smell Visualization and Standardization
- Food Quality Control
- Medical Diagnosis
- Air Control and Environmental Monitoring
- Others
By End Use Industry
- Military and Defense
- Agriculture
- Healthcare
- HoReCa
- Entertainment
- Renewal Energy Generation and Waste Management
- Food and Beverages
- Cosmetics
- Others
By Sensor Type
- Biosensors
- Chemical Sensors
- Mass Spectrometry Sensors
- Differential Optical Absorption Spectrometers
- Others
By Instrument Type
- One Element Odor Sensors
- Multiodor Sensors
By Region
- North America
- U.S.
- Canada
- Mexico
- Europe
- UK
- Germany
- France
- Italy
- Rest of Europe
- Asia-Pacific
- China
- Japan
- India
- South Korea
- Taiwan
- Rest of Asia-Pacific
- LAMEA
- Latin America
- Middle East
- Africa
Key Market Players:
- Drager
- Aryballe Technologies
- Honeywell International Inc.
- Odotech Inc. (Envirosuite Ltd)
- Alphasense
- Aeroqual
- Figaro Engineering Inc.
- Panasonic Corporation
- Comon Invent B.V.
- Membrapor
- The eNose Company
- Electronic Sensor Technology
TABLE OF CONTENTS
CHAPTER 1: INTRODUCTION
- 1.1. Report description
- 1.2. Key market segments
- 1.3. Key benefits to the stakeholders
- 1.4. Research Methodology
- 1.4.1. Primary research
- 1.4.2. Secondary research
- 1.4.3. Analyst tools and models
CHAPTER 2: EXECUTIVE SUMMARY
- 2.1. CXO Perspective
CHAPTER 3: MARKET OVERVIEW
- 3.1. Market definition and scope
- 3.2. Key findings
- 3.2.1. Top impacting factors
- 3.2.2. Top investment pockets
- 3.3. Porter's five forces analysis
- 3.3.1. Bargaining power of suppliers
- 3.3.2. Bargaining power of buyers
- 3.3.3. Threat of substitutes
- 3.3.4. Threat of new entrants
- 3.3.5. Intensity of rivalry
- 3.4. Market dynamics
- 3.4.1. Drivers
- 3.4.1.1. High cost of odor sensors
- 3.4.1.2. Technological limitation of odor sensors in emerging economies
- 3.4.1. Drivers
- 3.4.2. Restraints
- 3.4.2.1. Rise in awareness of air pollution and its negative healthcare effects
- 3.4.2.2. Rising demand for smart home and building automation
- 3.4.2.3. Growing demand for food safety and quality control
- 3.4.3. Opportunities
- 3.4.3.1. Emerging applications in healthcare and medical diagnosis
- 3.5. COVID-19 Impact Analysis on the market
CHAPTER 4: ODOR SENSOR MARKET, BY SENSOR TYPE
- 4.1. Overview
- 4.1.1. Market size and forecast
- 4.2. Biosensors
- 4.2.1. Key market trends, growth factors and opportunities
- 4.2.2. Market size and forecast, by region
- 4.2.3. Market share analysis by country
- 4.3. Chemical Sensors
- 4.3.1. Key market trends, growth factors and opportunities
- 4.3.2. Market size and forecast, by region
- 4.3.3. Market share analysis by country
- 4.4. Mass Spectrometry Sensors
- 4.4.1. Key market trends, growth factors and opportunities
- 4.4.2. Market size and forecast, by region
- 4.4.3. Market share analysis by country
- 4.5. Differential Optical Absorption Spectrometers
- 4.5.1. Key market trends, growth factors and opportunities
- 4.5.2. Market size and forecast, by region
- 4.5.3. Market share analysis by country
- 4.6. Others
- 4.6.1. Key market trends, growth factors and opportunities
- 4.6.2. Market size and forecast, by region
- 4.6.3. Market share analysis by country
CHAPTER 5: ODOR SENSOR MARKET, BY INSTRUMENT TYPE
- 5.1. Overview
- 5.1.1. Market size and forecast
- 5.2. One Element Odor Sensors
- 5.2.1. Key market trends, growth factors and opportunities
- 5.2.2. Market size and forecast, by region
- 5.2.3. Market share analysis by country
- 5.3. Multiodor Sensors
- 5.3.1. Key market trends, growth factors and opportunities
- 5.3.2. Market size and forecast, by region
- 5.3.3. Market share analysis by country
CHAPTER 6: ODOR SENSOR MARKET, BY APPLICATION AREAS
- 6.1. Overview
- 6.1.1. Market size and forecast
- 6.2. Smell Visualization and Standardization
- 6.2.1. Key market trends, growth factors and opportunities
- 6.2.2. Market size and forecast, by region
- 6.2.3. Market share analysis by country
- 6.3. Food Quality Control
- 6.3.1. Key market trends, growth factors and opportunities
- 6.3.2. Market size and forecast, by region
- 6.3.3. Market share analysis by country
- 6.4. Medical Diagnosis
- 6.4.1. Key market trends, growth factors and opportunities
- 6.4.2. Market size and forecast, by region
- 6.4.3. Market share analysis by country
- 6.5. Air Control and Environmental Monitoring
- 6.5.1. Key market trends, growth factors and opportunities
- 6.5.2. Market size and forecast, by region
- 6.5.3. Market share analysis by country
- 6.6. Others
- 6.6.1. Key market trends, growth factors and opportunities
- 6.6.2. Market size and forecast, by region
- 6.6.3. Market share analysis by country
CHAPTER 7: ODOR SENSOR MARKET, BY END USE INDUSTRY
- 7.1. Overview
- 7.1.1. Market size and forecast
- 7.2. Military and Defense
- 7.2.1. Key market trends, growth factors and opportunities
- 7.2.2. Market size and forecast, by region
- 7.2.3. Market share analysis by country
- 7.3. Agriculture
- 7.3.1. Key market trends, growth factors and opportunities
- 7.3.2. Market size and forecast, by region
- 7.3.3. Market share analysis by country
- 7.4. Healthcare
- 7.4.1. Key market trends, growth factors and opportunities
- 7.4.2. Market size and forecast, by region
- 7.4.3. Market share analysis by country
- 7.5. HoReCa
- 7.5.1. Key market trends, growth factors and opportunities
- 7.5.2. Market size and forecast, by region
- 7.5.3. Market share analysis by country
- 7.6. Entertainment
- 7.6.1. Key market trends, growth factors and opportunities
- 7.6.2. Market size and forecast, by region
- 7.6.3. Market share analysis by country
- 7.7. Renewal Energy Generation and Waste Management
- 7.7.1. Key market trends, growth factors and opportunities
- 7.7.2. Market size and forecast, by region
- 7.7.3. Market share analysis by country
- 7.8. Food and Beverages
- 7.8.1. Key market trends, growth factors and opportunities
- 7.8.2. Market size and forecast, by region
- 7.8.3. Market share analysis by country
- 7.9. Cosmetics
- 7.9.1. Key market trends, growth factors and opportunities
- 7.9.2. Market size and forecast, by region
- 7.9.3. Market share analysis by country
- 7.10. Others
- 7.10.1. Key market trends, growth factors and opportunities
- 7.10.2. Market size and forecast, by region
- 7.10.3. Market share analysis by country
CHAPTER 8: ODOR SENSOR MARKET, BY REGION
- 8.1. Overview
- 8.1.1. Market size and forecast By Region
- 8.2. North America
- 8.2.1. Key trends and opportunities
- 8.2.2. Market size and forecast, by Sensor Type
- 8.2.3. Market size and forecast, by Instrument Type
- 8.2.4. Market size and forecast, by Application Areas
- 8.2.5. Market size and forecast, by End Use Industry
- 8.2.6. Market size and forecast, by country
- 8.2.6.1. U.S.
- 8.2.6.1.1. Key market trends, growth factors and opportunities
- 8.2.6.1.2. Market size and forecast, by Sensor Type
- 8.2.6.1.3. Market size and forecast, by Instrument Type
- 8.2.6.1.4. Market size and forecast, by Application Areas
- 8.2.6.1.5. Market size and forecast, by End Use Industry
- 8.2.6.2. Canada
- 8.2.6.2.1. Key market trends, growth factors and opportunities
- 8.2.6.2.2. Market size and forecast, by Sensor Type
- 8.2.6.2.3. Market size and forecast, by Instrument Type
- 8.2.6.2.4. Market size and forecast, by Application Areas
- 8.2.6.2.5. Market size and forecast, by End Use Industry
- 8.2.6.3. Mexico
- 8.2.6.3.1. Key market trends, growth factors and opportunities
- 8.2.6.3.2. Market size and forecast, by Sensor Type
- 8.2.6.3.3. Market size and forecast, by Instrument Type
- 8.2.6.3.4. Market size and forecast, by Application Areas
- 8.2.6.3.5. Market size and forecast, by End Use Industry
- 8.3. Europe
- 8.3.1. Key trends and opportunities
- 8.3.2. Market size and forecast, by Sensor Type
- 8.3.3. Market size and forecast, by Instrument Type
- 8.3.4. Market size and forecast, by Application Areas
- 8.3.5. Market size and forecast, by End Use Industry
- 8.3.6. Market size and forecast, by country
- 8.3.6.1. UK
- 8.3.6.1.1. Key market trends, growth factors and opportunities
- 8.3.6.1.2. Market size and forecast, by Sensor Type
- 8.3.6.1.3. Market size and forecast, by Instrument Type
- 8.3.6.1.4. Market size and forecast, by Application Areas
- 8.3.6.1.5. Market size and forecast, by End Use Industry
- 8.3.6.2. Germany
- 8.3.6.2.1. Key market trends, growth factors and opportunities
- 8.3.6.2.2. Market size and forecast, by Sensor Type
- 8.3.6.2.3. Market size and forecast, by Instrument Type
- 8.3.6.2.4. Market size and forecast, by Application Areas
- 8.3.6.2.5. Market size and forecast, by End Use Industry
- 8.3.6.3. France
- 8.3.6.3.1. Key market trends, growth factors and opportunities
- 8.3.6.3.2. Market size and forecast, by Sensor Type
- 8.3.6.3.3. Market size and forecast, by Instrument Type
- 8.3.6.3.4. Market size and forecast, by Application Areas
- 8.3.6.3.5. Market size and forecast, by End Use Industry
- 8.3.6.4. Italy
- 8.3.6.4.1. Key market trends, growth factors and opportunities
- 8.3.6.4.2. Market size and forecast, by Sensor Type
- 8.3.6.4.3. Market size and forecast, by Instrument Type
- 8.3.6.4.4. Market size and forecast, by Application Areas
- 8.3.6.4.5. Market size and forecast, by End Use Industry
- 8.3.6.5. Rest of Europe
- 8.3.6.5.1. Key market trends, growth factors and opportunities
- 8.3.6.5.2. Market size and forecast, by Sensor Type
- 8.3.6.5.3. Market size and forecast, by Instrument Type
- 8.3.6.5.4. Market size and forecast, by Application Areas
- 8.3.6.5.5. Market size and forecast, by End Use Industry
- 8.4. Asia-Pacific
- 8.4.1. Key trends and opportunities
- 8.4.2. Market size and forecast, by Sensor Type
- 8.4.3. Market size and forecast, by Instrument Type
- 8.4.4. Market size and forecast, by Application Areas
- 8.4.5. Market size and forecast, by End Use Industry
- 8.4.6. Market size and forecast, by country
- 8.4.6.1. China
- 8.4.6.1.1. Key market trends, growth factors and opportunities
- 8.4.6.1.2. Market size and forecast, by Sensor Type
- 8.4.6.1.3. Market size and forecast, by Instrument Type
- 8.4.6.1.4. Market size and forecast, by Application Areas
- 8.4.6.1.5. Market size and forecast, by End Use Industry
- 8.4.6.2. Japan
- 8.4.6.2.1. Key market trends, growth factors and opportunities
- 8.4.6.2.2. Market size and forecast, by Sensor Type
- 8.4.6.2.3. Market size and forecast, by Instrument Type
- 8.4.6.2.4. Market size and forecast, by Application Areas
- 8.4.6.2.5. Market size and forecast, by End Use Industry
- 8.4.6.3. India
- 8.4.6.3.1. Key market trends, growth factors and opportunities
- 8.4.6.3.2. Market size and forecast, by Sensor Type
- 8.4.6.3.3. Market size and forecast, by Instrument Type
- 8.4.6.3.4. Market size and forecast, by Application Areas
- 8.4.6.3.5. Market size and forecast, by End Use Industry
- 8.4.6.4. South Korea
- 8.4.6.4.1. Key market trends, growth factors and opportunities
- 8.4.6.4.2. Market size and forecast, by Sensor Type
- 8.4.6.4.3. Market size and forecast, by Instrument Type
- 8.4.6.4.4. Market size and forecast, by Application Areas
- 8.4.6.4.5. Market size and forecast, by End Use Industry
- 8.4.6.5. Taiwan
- 8.4.6.5.1. Key market trends, growth factors and opportunities
- 8.4.6.5.2. Market size and forecast, by Sensor Type
- 8.4.6.5.3. Market size and forecast, by Instrument Type
- 8.4.6.5.4. Market size and forecast, by Application Areas
- 8.4.6.5.5. Market size and forecast, by End Use Industry
- 8.4.6.6. Rest of Asia-Pacific
- 8.4.6.6.1. Key market trends, growth factors and opportunities
- 8.4.6.6.2. Market size and forecast, by Sensor Type
- 8.4.6.6.3. Market size and forecast, by Instrument Type
- 8.4.6.6.4. Market size and forecast, by Application Areas
- 8.4.6.6.5. Market size and forecast, by End Use Industry
- 8.5. LAMEA
- 8.5.1. Key trends and opportunities
- 8.5.2. Market size and forecast, by Sensor Type
- 8.5.3. Market size and forecast, by Instrument Type
- 8.5.4. Market size and forecast, by Application Areas
- 8.5.5. Market size and forecast, by End Use Industry
- 8.5.6. Market size and forecast, by country
- 8.5.6.1. Latin America
- 8.5.6.1.1. Key market trends, growth factors and opportunities
- 8.5.6.1.2. Market size and forecast, by Sensor Type
- 8.5.6.1.3. Market size and forecast, by Instrument Type
- 8.5.6.1.4. Market size and forecast, by Application Areas
- 8.5.6.1.5. Market size and forecast, by End Use Industry
- 8.5.6.2. Middle East
- 8.5.6.2.1. Key market trends, growth factors and opportunities
- 8.5.6.2.2. Market size and forecast, by Sensor Type
- 8.5.6.2.3. Market size and forecast, by Instrument Type
- 8.5.6.2.4. Market size and forecast, by Application Areas
- 8.5.6.2.5. Market size and forecast, by End Use Industry
- 8.5.6.3. Africa
- 8.5.6.3.1. Key market trends, growth factors and opportunities
- 8.5.6.3.2. Market size and forecast, by Sensor Type
- 8.5.6.3.3. Market size and forecast, by Instrument Type
- 8.5.6.3.4. Market size and forecast, by Application Areas
- 8.5.6.3.5. Market size and forecast, by End Use Industry
CHAPTER 9: COMPETITIVE LANDSCAPE
- 9.1. Introduction
- 9.2. Top winning strategies
- 9.3. Product Mapping of Top 10 Player
- 9.4. Competitive Dashboard
- 9.5. Competitive Heatmap
- 9.6. Top player positioning, 2021
CHAPTER 10: COMPANY PROFILES
- 10.1. Figaro Engineering Inc.
- 10.1.1. Company overview
- 10.1.2. Key Executives
- 10.1.3. Company snapshot
- 10.1.4. Operating business segments
- 10.1.5. Product portfolio
- 10.1.6. Key strategic moves and developments
- 10.2. Panasonic Corporation
- 10.2.1. Company overview
- 10.2.2. Key Executives
- 10.2.3. Company snapshot
- 10.2.4. Operating business segments
- 10.2.5. Product portfolio
- 10.2.6. Business performance
- 10.2.7. Key strategic moves and developments
- 10.3. Honeywell International Inc.
- 10.3.1. Company overview
- 10.3.2. Key Executives
- 10.3.3. Company snapshot
- 10.3.4. Operating business segments
- 10.3.5. Product portfolio
- 10.3.6. Business performance
- 10.3.7. Key strategic moves and developments
- 10.4. Aryballe Technologies
- 10.4.1. Company overview
- 10.4.2. Key Executives
- 10.4.3. Company snapshot
- 10.4.4. Operating business segments
- 10.4.5. Product portfolio
- 10.4.6. Key strategic moves and developments
- 10.5. Membrapor
- 10.5.1. Company overview
- 10.5.2. Key Executives
- 10.5.3. Company snapshot
- 10.5.4. Operating business segments
- 10.5.5. Product portfolio
- 10.5.6. Key strategic moves and developments
- 10.6. Alphasense
- 10.6.1. Company overview
- 10.6.2. Key Executives
- 10.6.3. Company snapshot
- 10.6.4. Operating business segments
- 10.6.5. Product portfolio
- 10.6.6. Key strategic moves and developments
- 10.7. Aeroqual
- 10.7.1. Company overview
- 10.7.2. Key Executives
- 10.7.3. Company snapshot
- 10.7.4. Operating business segments
- 10.7.5. Product portfolio
- 10.7.6. Key strategic moves and developments
- 10.8. Drager
- 10.8.1. Company overview
- 10.8.2. Key Executives
- 10.8.3. Company snapshot
- 10.8.4. Operating business segments
- 10.8.5. Product portfolio
- 10.8.6. Business performance
- 10.8.7. Key strategic moves and developments
- 10.9. Comon Invent B.V.
- 10.9.1. Company overview
- 10.9.2. Key Executives
- 10.9.3. Company snapshot
- 10.9.4. Operating business segments
- 10.9.5. Product portfolio
- 10.9.6. Key strategic moves and developments
- 10.10. Odotech Inc. (Envirosuite Ltd)
- 10.10.1. Company overview
- 10.10.2. Key Executives
- 10.10.3. Company snapshot
- 10.10.4. Operating business segments
- 10.10.5. Product portfolio
- 10.10.6. Key strategic moves and developments
- 10.11. The eNose Company
- 10.11.1. Company overview
- 10.11.2. Key Executives
- 10.11.3. Company snapshot
- 10.11.4. Operating business segments
- 10.11.5. Product portfolio
- 10.12. Electronic Sensor Technology
- 10.12.1. Company overview
- 10.12.2. Key Executives
- 10.12.3. Company snapshot
- 10.12.4. Operating business segments
- 10.12.5. Product portfolio
- 10.12.6. Key strategic moves and developments
LIST OF TABLES
- TABLE 01. GLOBAL ODOR SENSOR MARKET, BY SENSOR TYPE, 2021-2031 ($MILLION)
- TABLE 02. ODOR SENSOR MARKET FOR BIOSENSORS, BY REGION, 2021-2031 ($MILLION)
- TABLE 03. ODOR SENSOR MARKET FOR CHEMICAL SENSORS, BY REGION, 2021-2031 ($MILLION)
- TABLE 04. ODOR SENSOR MARKET FOR MASS SPECTROMETRY SENSORS, BY REGION, 2021-2031 ($MILLION)
- TABLE 05. ODOR SENSOR MARKET FOR DIFFERENTIAL OPTICAL ABSORPTION SPECTROMETERS, BY REGION, 2021-2031 ($MILLION)
- TABLE 06. ODOR SENSOR MARKET FOR OTHERS, BY REGION, 2021-2031 ($MILLION)
- TABLE 07. GLOBAL ODOR SENSOR MARKET, BY INSTRUMENT TYPE, 2021-2031 ($MILLION)
- TABLE 08. ODOR SENSOR MARKET FOR ONE ELEMENT ODOR SENSORS, BY REGION, 2021-2031 ($MILLION)
- TABLE 09. ODOR SENSOR MARKET FOR MULTIODOR SENSORS, BY REGION, 2021-2031 ($MILLION)
- TABLE 10. GLOBAL ODOR SENSOR MARKET, BY APPLICATION AREAS, 2021-2031 ($MILLION)
- TABLE 11. ODOR SENSOR MARKET FOR SMELL VISUALIZATION AND STANDARDIZATION, BY REGION, 2021-2031 ($MILLION)
- TABLE 12. ODOR SENSOR MARKET FOR FOOD QUALITY CONTROL, BY REGION, 2021-2031 ($MILLION)
- TABLE 13. ODOR SENSOR MARKET FOR MEDICAL DIAGNOSIS, BY REGION, 2021-2031 ($MILLION)
- TABLE 14. ODOR SENSOR MARKET FOR AIR CONTROL AND ENVIRONMENTAL MONITORING, BY REGION, 2021-2031 ($MILLION)
- TABLE 15. ODOR SENSOR MARKET FOR OTHERS, BY REGION, 2021-2031 ($MILLION)
- TABLE 16. GLOBAL ODOR SENSOR MARKET, BY END USE INDUSTRY, 2021-2031 ($MILLION)
- TABLE 17. ODOR SENSOR MARKET FOR MILITARY AND DEFENSE, BY REGION, 2021-2031 ($MILLION)
- TABLE 18. ODOR SENSOR MARKET FOR AGRICULTURE, BY REGION, 2021-2031 ($MILLION)
- TABLE 19. ODOR SENSOR MARKET FOR HEALTHCARE, BY REGION, 2021-2031 ($MILLION)
- TABLE 20. ODOR SENSOR MARKET FOR HORECA, BY REGION, 2021-2031 ($MILLION)
- TABLE 21. ODOR SENSOR MARKET FOR ENTERTAINMENT, BY REGION, 2021-2031 ($MILLION)
- TABLE 22. ODOR SENSOR MARKET FOR RENEWAL ENERGY GENERATION AND WASTE MANAGEMENT, BY REGION, 2021-2031 ($MILLION)
- TABLE 23. ODOR SENSOR MARKET FOR FOOD AND BEVERAGES, BY REGION, 2021-2031 ($MILLION)
- TABLE 24. ODOR SENSOR MARKET FOR COSMETICS, BY REGION, 2021-2031 ($MILLION)
- TABLE 25. ODOR SENSOR MARKET FOR OTHERS, BY REGION, 2021-2031 ($MILLION)
- TABLE 26. ODOR SENSOR MARKET, BY REGION, 2021-2031 ($MILLION)
- TABLE 27. NORTH AMERICA ODOR SENSOR MARKET, BY SENSOR TYPE, 2021-2031 ($MILLION)
- TABLE 28. NORTH AMERICA ODOR SENSOR MARKET, BY INSTRUMENT TYPE, 2021-2031 ($MILLION)
- TABLE 29. NORTH AMERICA ODOR SENSOR MARKET, BY APPLICATION AREAS, 2021-2031 ($MILLION)
- TABLE 30. NORTH AMERICA ODOR SENSOR MARKET, BY END USE INDUSTRY, 2021-2031 ($MILLION)
- TABLE 31. NORTH AMERICA ODOR SENSOR MARKET, BY COUNTRY, 2021-2031 ($MILLION)
- TABLE 32. U.S. ODOR SENSOR MARKET, BY SENSOR TYPE, 2021-2031 ($MILLION)
- TABLE 33. U.S. ODOR SENSOR MARKET, BY INSTRUMENT TYPE, 2021-2031 ($MILLION)
- TABLE 34. U.S. ODOR SENSOR MARKET, BY APPLICATION AREAS, 2021-2031 ($MILLION)
- TABLE 35. U.S. ODOR SENSOR MARKET, BY END USE INDUSTRY, 2021-2031 ($MILLION)
- TABLE 36. CANADA ODOR SENSOR MARKET, BY SENSOR TYPE, 2021-2031 ($MILLION)
- TABLE 37. CANADA ODOR SENSOR MARKET, BY INSTRUMENT TYPE, 2021-2031 ($MILLION)
- TABLE 38. CANADA ODOR SENSOR MARKET, BY APPLICATION AREAS, 2021-2031 ($MILLION)
- TABLE 39. CANADA ODOR SENSOR MARKET, BY END USE INDUSTRY, 2021-2031 ($MILLION)
- TABLE 40. MEXICO ODOR SENSOR MARKET, BY SENSOR TYPE, 2021-2031 ($MILLION)
- TABLE 41. MEXICO ODOR SENSOR MARKET, BY INSTRUMENT TYPE, 2021-2031 ($MILLION)
- TABLE 42. MEXICO ODOR SENSOR MARKET, BY APPLICATION AREAS, 2021-2031 ($MILLION)
- TABLE 43. MEXICO ODOR SENSOR MARKET, BY END USE INDUSTRY, 2021-2031 ($MILLION)
- TABLE 44. EUROPE ODOR SENSOR MARKET, BY SENSOR TYPE, 2021-2031 ($MILLION)
- TABLE 45. EUROPE ODOR SENSOR MARKET, BY INSTRUMENT TYPE, 2021-2031 ($MILLION)
- TABLE 46. EUROPE ODOR SENSOR MARKET, BY APPLICATION AREAS, 2021-2031 ($MILLION)
- TABLE 47. EUROPE ODOR SENSOR MARKET, BY END USE INDUSTRY, 2021-2031 ($MILLION)
- TABLE 48. EUROPE ODOR SENSOR MARKET, BY COUNTRY, 2021-2031 ($MILLION)
- TABLE 49. UK ODOR SENSOR MARKET, BY SENSOR TYPE, 2021-2031 ($MILLION)
- TABLE 50. UK ODOR SENSOR MARKET, BY INSTRUMENT TYPE, 2021-2031 ($MILLION)
- TABLE 51. UK ODOR SENSOR MARKET, BY APPLICATION AREAS, 2021-2031 ($MILLION)
- TABLE 52. UK ODOR SENSOR MARKET, BY END USE INDUSTRY, 2021-2031 ($MILLION)
- TABLE 53. GERMANY ODOR SENSOR MARKET, BY SENSOR TYPE, 2021-2031 ($MILLION)
- TABLE 54. GERMANY ODOR SENSOR MARKET, BY INSTRUMENT TYPE, 2021-2031 ($MILLION)
- TABLE 55. GERMANY ODOR SENSOR MARKET, BY APPLICATION AREAS, 2021-2031 ($MILLION)
- TABLE 56. GERMANY ODOR SENSOR MARKET, BY END USE INDUSTRY, 2021-2031 ($MILLION)
- TABLE 57. FRANCE ODOR SENSOR MARKET, BY SENSOR TYPE, 2021-2031 ($MILLION)
- TABLE 58. FRANCE ODOR SENSOR MARKET, BY INSTRUMENT TYPE, 2021-2031 ($MILLION)
- TABLE 59. FRANCE ODOR SENSOR MARKET, BY APPLICATION AREAS, 2021-2031 ($MILLION)
- TABLE 60. FRANCE ODOR SENSOR MARKET, BY END USE INDUSTRY, 2021-2031 ($MILLION)
- TABLE 61. ITALY ODOR SENSOR MARKET, BY SENSOR TYPE, 2021-2031 ($MILLION)
- TABLE 62. ITALY ODOR SENSOR MARKET, BY INSTRUMENT TYPE, 2021-2031 ($MILLION)
- TABLE 63. ITALY ODOR SENSOR MARKET, BY APPLICATION AREAS, 2021-2031 ($MILLION)
- TABLE 64. ITALY ODOR SENSOR MARKET, BY END USE INDUSTRY, 2021-2031 ($MILLION)
- TABLE 65. REST OF EUROPE ODOR SENSOR MARKET, BY SENSOR TYPE, 2021-2031 ($MILLION)
- TABLE 66. REST OF EUROPE ODOR SENSOR MARKET, BY INSTRUMENT TYPE, 2021-2031 ($MILLION)
- TABLE 67. REST OF EUROPE ODOR SENSOR MARKET, BY APPLICATION AREAS, 2021-2031 ($MILLION)
- TABLE 68. REST OF EUROPE ODOR SENSOR MARKET, BY END USE INDUSTRY, 2021-2031 ($MILLION)
- TABLE 69. ASIA-PACIFIC ODOR SENSOR MARKET, BY SENSOR TYPE, 2021-2031 ($MILLION)
- TABLE 70. ASIA-PACIFIC ODOR SENSOR MARKET, BY INSTRUMENT TYPE, 2021-2031 ($MILLION)
- TABLE 71. ASIA-PACIFIC ODOR SENSOR MARKET, BY APPLICATION AREAS, 2021-2031 ($MILLION)
- TABLE 72. ASIA-PACIFIC ODOR SENSOR MARKET, BY END USE INDUSTRY, 2021-2031 ($MILLION)
- TABLE 73. ASIA-PACIFIC ODOR SENSOR MARKET, BY COUNTRY, 2021-2031 ($MILLION)
- TABLE 74. CHINA ODOR SENSOR MARKET, BY SENSOR TYPE, 2021-2031 ($MILLION)
- TABLE 75. CHINA ODOR SENSOR MARKET, BY INSTRUMENT TYPE, 2021-2031 ($MILLION)
- TABLE 76. CHINA ODOR SENSOR MARKET, BY APPLICATION AREAS, 2021-2031 ($MILLION)
- TABLE 77. CHINA ODOR SENSOR MARKET, BY END USE INDUSTRY, 2021-2031 ($MILLION)
- TABLE 78. JAPAN ODOR SENSOR MARKET, BY SENSOR TYPE, 2021-2031 ($MILLION)
- TABLE 79. JAPAN ODOR SENSOR MARKET, BY INSTRUMENT TYPE, 2021-2031 ($MILLION)
- TABLE 80. JAPAN ODOR SENSOR MARKET, BY APPLICATION AREAS, 2021-2031 ($MILLION)
- TABLE 81. JAPAN ODOR SENSOR MARKET, BY END USE INDUSTRY, 2021-2031 ($MILLION)
- TABLE 82. INDIA ODOR SENSOR MARKET, BY SENSOR TYPE, 2021-2031 ($MILLION)
- TABLE 83. INDIA ODOR SENSOR MARKET, BY INSTRUMENT TYPE, 2021-2031 ($MILLION)
- TABLE 84. INDIA ODOR SENSOR MARKET, BY APPLICATION AREAS, 2021-2031 ($MILLION)
- TABLE 85. INDIA ODOR SENSOR MARKET, BY END USE INDUSTRY, 2021-2031 ($MILLION)
- TABLE 86. SOUTH KOREA ODOR SENSOR MARKET, BY SENSOR TYPE, 2021-2031 ($MILLION)
- TABLE 87. SOUTH KOREA ODOR SENSOR MARKET, BY INSTRUMENT TYPE, 2021-2031 ($MILLION)
- TABLE 88. SOUTH KOREA ODOR SENSOR MARKET, BY APPLICATION AREAS, 2021-2031 ($MILLION)
- TABLE 89. SOUTH KOREA ODOR SENSOR MARKET, BY END USE INDUSTRY, 2021-2031 ($MILLION)
- TABLE 90. TAIWAN ODOR SENSOR MARKET, BY SENSOR TYPE, 2021-2031 ($MILLION)
- TABLE 91. TAIWAN ODOR SENSOR MARKET, BY INSTRUMENT TYPE, 2021-2031 ($MILLION)
- TABLE 92. TAIWAN ODOR SENSOR MARKET, BY APPLICATION AREAS, 2021-2031 ($MILLION)
- TABLE 93. TAIWAN ODOR SENSOR MARKET, BY END USE INDUSTRY, 2021-2031 ($MILLION)
- TABLE 94. REST OF ASIA-PACIFIC ODOR SENSOR MARKET, BY SENSOR TYPE, 2021-2031 ($MILLION)
- TABLE 95. REST OF ASIA-PACIFIC ODOR SENSOR MARKET, BY INSTRUMENT TYPE, 2021-2031 ($MILLION)
- TABLE 96. REST OF ASIA-PACIFIC ODOR SENSOR MARKET, BY APPLICATION AREAS, 2021-2031 ($MILLION)
- TABLE 97. REST OF ASIA-PACIFIC ODOR SENSOR MARKET, BY END USE INDUSTRY, 2021-2031 ($MILLION)
- TABLE 98. LAMEA ODOR SENSOR MARKET, BY SENSOR TYPE, 2021-2031 ($MILLION)
- TABLE 99. LAMEA ODOR SENSOR MARKET, BY INSTRUMENT TYPE, 2021-2031 ($MILLION)
- TABLE 100. LAMEA ODOR SENSOR MARKET, BY APPLICATION AREAS, 2021-2031 ($MILLION)
- TABLE 101. LAMEA ODOR SENSOR MARKET, BY END USE INDUSTRY, 2021-2031 ($MILLION)
- TABLE 102. LAMEA ODOR SENSOR MARKET, BY COUNTRY, 2021-2031 ($MILLION)
- TABLE 103. LATIN AMERICA ODOR SENSOR MARKET, BY SENSOR TYPE, 2021-2031 ($MILLION)
- TABLE 104. LATIN AMERICA ODOR SENSOR MARKET, BY INSTRUMENT TYPE, 2021-2031 ($MILLION)
- TABLE 105. LATIN AMERICA ODOR SENSOR MARKET, BY APPLICATION AREAS, 2021-2031 ($MILLION)
- TABLE 106. LATIN AMERICA ODOR SENSOR MARKET, BY END USE INDUSTRY, 2021-2031 ($MILLION)
- TABLE 107. MIDDLE EAST ODOR SENSOR MARKET, BY SENSOR TYPE, 2021-2031 ($MILLION)
- TABLE 108. MIDDLE EAST ODOR SENSOR MARKET, BY INSTRUMENT TYPE, 2021-2031 ($MILLION)
- TABLE 109. MIDDLE EAST ODOR SENSOR MARKET, BY APPLICATION AREAS, 2021-2031 ($MILLION)
- TABLE 110. MIDDLE EAST ODOR SENSOR MARKET, BY END USE INDUSTRY, 2021-2031 ($MILLION)
- TABLE 111. AFRICA ODOR SENSOR MARKET, BY SENSOR TYPE, 2021-2031 ($MILLION)
- TABLE 112. AFRICA ODOR SENSOR MARKET, BY INSTRUMENT TYPE, 2021-2031 ($MILLION)
- TABLE 113. AFRICA ODOR SENSOR MARKET, BY APPLICATION AREAS, 2021-2031 ($MILLION)
- TABLE 114. AFRICA ODOR SENSOR MARKET, BY END USE INDUSTRY, 2021-2031 ($MILLION)
- TABLE 115. FIGARO ENGINEERING INC.: KEY EXECUTIVES
- TABLE 116. FIGARO ENGINEERING INC.: COMPANY SNAPSHOT
- TABLE 117. FIGARO ENGINEERING INC.: PRODUCT SEGMENTS
- TABLE 118. FIGARO ENGINEERING INC.: PRODUCT PORTFOLIO
- TABLE 119. FIGARO ENGINEERING INC.: KEY STRATERGIES
- TABLE 120. PANASONIC CORPORATION: KEY EXECUTIVES
- TABLE 121. PANASONIC CORPORATION: COMPANY SNAPSHOT
- TABLE 122. PANASONIC CORPORATION: SERVICE SEGMENTS
- TABLE 123. PANASONIC CORPORATION: PRODUCT PORTFOLIO
- TABLE 124. PANASONIC CORPORATION: KEY STRATERGIES
- TABLE 125. HONEYWELL INTERNATIONAL INC.: KEY EXECUTIVES
- TABLE 126. HONEYWELL INTERNATIONAL INC.: COMPANY SNAPSHOT
- TABLE 127. HONEYWELL INTERNATIONAL INC.: PRODUCT SEGMENTS
- TABLE 128. HONEYWELL INTERNATIONAL INC.: PRODUCT PORTFOLIO
- TABLE 129. HONEYWELL INTERNATIONAL INC.: KEY STRATERGIES
- TABLE 130. ARYBALLE TECHNOLOGIES: KEY EXECUTIVES
- TABLE 131. ARYBALLE TECHNOLOGIES: COMPANY SNAPSHOT
- TABLE 132. ARYBALLE TECHNOLOGIES: PRODUCT SEGMENTS
- TABLE 133. ARYBALLE TECHNOLOGIES: PRODUCT PORTFOLIO
- TABLE 134. ARYBALLE TECHNOLOGIES: KEY STRATERGIES
- TABLE 135. MEMBRAPOR: KEY EXECUTIVES
- TABLE 136. MEMBRAPOR: COMPANY SNAPSHOT
- TABLE 137. MEMBRAPOR: PRODUCT SEGMENTS
- TABLE 138. MEMBRAPOR: PRODUCT PORTFOLIO
- TABLE 139. MEMBRAPOR: KEY STRATERGIES
- TABLE 140. ALPHASENSE: KEY EXECUTIVES
- TABLE 141. ALPHASENSE: COMPANY SNAPSHOT
- TABLE 142. ALPHASENSE: PRODUCT SEGMENTS
- TABLE 143. ALPHASENSE: PRODUCT PORTFOLIO
- TABLE 144. ALPHASENSE: KEY STRATERGIES
- TABLE 145. AEROQUAL: KEY EXECUTIVES
- TABLE 146. AEROQUAL: COMPANY SNAPSHOT
- TABLE 147. AEROQUAL: PRODUCT SEGMENTS
- TABLE 148. AEROQUAL: PRODUCT PORTFOLIO
- TABLE 149. AEROQUAL: KEY STRATERGIES
- TABLE 150. DRAGER: KEY EXECUTIVES
- TABLE 151. DRAGER: COMPANY SNAPSHOT
- TABLE 152. DRAGER: PRODUCT SEGMENTS
- TABLE 153. DRAGER: PRODUCT PORTFOLIO
- TABLE 154. DRAGER: KEY STRATERGIES
- TABLE 155. COMON INVENT B.V.: KEY EXECUTIVES
- TABLE 156. COMON INVENT B.V.: COMPANY SNAPSHOT
- TABLE 157. COMON INVENT B.V.: SERVICE SEGMENTS
- TABLE 158. COMON INVENT B.V.: PRODUCT PORTFOLIO
- TABLE 159. COMON INVENT B.V.: KEY STRATERGIES
- TABLE 160. ODOTECH INC. (ENVIROSUITE LTD): KEY EXECUTIVES
- TABLE 161. ODOTECH INC. (ENVIROSUITE LTD): COMPANY SNAPSHOT
- TABLE 162. ODOTECH INC. (ENVIROSUITE LTD): SERVICE SEGMENTS
- TABLE 163. ODOTECH INC. (ENVIROSUITE LTD): PRODUCT PORTFOLIO
- TABLE 164. ODOTECH INC. (ENVIROSUITE LTD): KEY STRATERGIES
- TABLE 165. THE ENOSE COMPANY: KEY EXECUTIVES
- TABLE 166. THE ENOSE COMPANY: COMPANY SNAPSHOT
- TABLE 167. THE ENOSE COMPANY: PRODUCT SEGMENTS
- TABLE 168. THE ENOSE COMPANY: PRODUCT PORTFOLIO
- TABLE 169. ELECTRONIC SENSOR TECHNOLOGY: KEY EXECUTIVES
- TABLE 170. ELECTRONIC SENSOR TECHNOLOGY: COMPANY SNAPSHOT
- TABLE 171. ELECTRONIC SENSOR TECHNOLOGY: SERVICE SEGMENTS
- TABLE 172. ELECTRONIC SENSOR TECHNOLOGY: PRODUCT PORTFOLIO
- TABLE 173. ELECTRONIC SENSOR TECHNOLOGY: KEY STRATERGIES
LIST OF FIGURES
- FIGURE 01. ODOR SENSOR MARKET, 2021-2031
- FIGURE 02. SEGMENTATION OF ODOR SENSOR MARKET, 2021-2031
- FIGURE 03. TOP INVESTMENT POCKETS IN ODOR SENSOR MARKET (2022-2031)
- FIGURE 04. LOW BARGAINING POWER OF SUPPLIERS
- FIGURE 05. LOW BARGAINING POWER OF BUYERS
- FIGURE 06. LOW THREAT OF SUBSTITUTES
- FIGURE 07. LOW THREAT OF NEW ENTRANTS
- FIGURE 08. LOW INTENSITY OF RIVALRY
- FIGURE 09. DRIVERS, RESTRAINTS AND OPPORTUNITIES: GLOBALODOR SENSOR MARKET
- FIGURE 10. ODOR SENSOR MARKET, BY SENSOR TYPE, 2021(%)
- FIGURE 11. COMPARATIVE SHARE ANALYSIS OF ODOR SENSOR MARKET FOR BIOSENSORS, BY COUNTRY 2021 AND 2031(%)
- FIGURE 12. COMPARATIVE SHARE ANALYSIS OF ODOR SENSOR MARKET FOR CHEMICAL SENSORS, BY COUNTRY 2021 AND 2031(%)
- FIGURE 13. COMPARATIVE SHARE ANALYSIS OF ODOR SENSOR MARKET FOR MASS SPECTROMETRY SENSORS, BY COUNTRY 2021 AND 2031(%)
- FIGURE 14. COMPARATIVE SHARE ANALYSIS OF ODOR SENSOR MARKET FOR DIFFERENTIAL OPTICAL ABSORPTION SPECTROMETERS, BY COUNTRY 2021 AND 2031(%)
- FIGURE 15. COMPARATIVE SHARE ANALYSIS OF ODOR SENSOR MARKET FOR OTHERS, BY COUNTRY 2021 AND 2031(%)
- FIGURE 16. ODOR SENSOR MARKET, BY INSTRUMENT TYPE, 2021(%)
- FIGURE 17. COMPARATIVE SHARE ANALYSIS OF ODOR SENSOR MARKET FOR ONE ELEMENT ODOR SENSORS, BY COUNTRY 2021 AND 2031(%)
- FIGURE 18. COMPARATIVE SHARE ANALYSIS OF ODOR SENSOR MARKET FOR MULTIODOR SENSORS, BY COUNTRY 2021 AND 2031(%)
- FIGURE 19. ODOR SENSOR MARKET, BY APPLICATION AREAS, 2021(%)
- FIGURE 20. COMPARATIVE SHARE ANALYSIS OF ODOR SENSOR MARKET FOR SMELL VISUALIZATION AND STANDARDIZATION, BY COUNTRY 2021 AND 2031(%)
- FIGURE 21. COMPARATIVE SHARE ANALYSIS OF ODOR SENSOR MARKET FOR FOOD QUALITY CONTROL, BY COUNTRY 2021 AND 2031(%)
- FIGURE 22. COMPARATIVE SHARE ANALYSIS OF ODOR SENSOR MARKET FOR MEDICAL DIAGNOSIS, BY COUNTRY 2021 AND 2031(%)
- FIGURE 23. COMPARATIVE SHARE ANALYSIS OF ODOR SENSOR MARKET FOR AIR CONTROL AND ENVIRONMENTAL MONITORING, BY COUNTRY 2021 AND 2031(%)
- FIGURE 24. COMPARATIVE SHARE ANALYSIS OF ODOR SENSOR MARKET FOR OTHERS, BY COUNTRY 2021 AND 2031(%)
- FIGURE 25. ODOR SENSOR MARKET, BY END USE INDUSTRY, 2021(%)
- FIGURE 26. COMPARATIVE SHARE ANALYSIS OF ODOR SENSOR MARKET FOR MILITARY AND DEFENSE, BY COUNTRY 2021 AND 2031(%)
- FIGURE 27. COMPARATIVE SHARE ANALYSIS OF ODOR SENSOR MARKET FOR AGRICULTURE, BY COUNTRY 2021 AND 2031(%)
- FIGURE 28. COMPARATIVE SHARE ANALYSIS OF ODOR SENSOR MARKET FOR HEALTHCARE, BY COUNTRY 2021 AND 2031(%)
- FIGURE 29. COMPARATIVE SHARE ANALYSIS OF ODOR SENSOR MARKET FOR HORECA, BY COUNTRY 2021 AND 2031(%)
- FIGURE 30. COMPARATIVE SHARE ANALYSIS OF ODOR SENSOR MARKET FOR ENTERTAINMENT, BY COUNTRY 2021 AND 2031(%)
- FIGURE 31. COMPARATIVE SHARE ANALYSIS OF ODOR SENSOR MARKET FOR RENEWAL ENERGY GENERATION AND WASTE MANAGEMENT, BY COUNTRY 2021 AND 2031(%)
- FIGURE 32. COMPARATIVE SHARE ANALYSIS OF ODOR SENSOR MARKET FOR FOOD AND BEVERAGES, BY COUNTRY 2021 AND 2031(%)
- FIGURE 33. COMPARATIVE SHARE ANALYSIS OF ODOR SENSOR MARKET FOR COSMETICS, BY COUNTRY 2021 AND 2031(%)
- FIGURE 34. COMPARATIVE SHARE ANALYSIS OF ODOR SENSOR MARKET FOR OTHERS, BY COUNTRY 2021 AND 2031(%)
- FIGURE 35. ODOR SENSOR MARKET BY REGION, 2021
- FIGURE 36. U.S. ODOR SENSOR MARKET, 2021-2031 ($MILLION)
- FIGURE 37. CANADA ODOR SENSOR MARKET, 2021-2031 ($MILLION)
- FIGURE 38. MEXICO ODOR SENSOR MARKET, 2021-2031 ($MILLION)
- FIGURE 39. UK ODOR SENSOR MARKET, 2021-2031 ($MILLION)
- FIGURE 40. GERMANY ODOR SENSOR MARKET, 2021-2031 ($MILLION)
- FIGURE 41. FRANCE ODOR SENSOR MARKET, 2021-2031 ($MILLION)
- FIGURE 42. ITALY ODOR SENSOR MARKET, 2021-2031 ($MILLION)
- FIGURE 43. REST OF EUROPE ODOR SENSOR MARKET, 2021-2031 ($MILLION)
- FIGURE 44. CHINA ODOR SENSOR MARKET, 2021-2031 ($MILLION)
- FIGURE 45. JAPAN ODOR SENSOR MARKET, 2021-2031 ($MILLION)
- FIGURE 46. INDIA ODOR SENSOR MARKET, 2021-2031 ($MILLION)
- FIGURE 47. SOUTH KOREA ODOR SENSOR MARKET, 2021-2031 ($MILLION)
- FIGURE 48. TAIWAN ODOR SENSOR MARKET, 2021-2031 ($MILLION)
- FIGURE 49. REST OF ASIA-PACIFIC ODOR SENSOR MARKET, 2021-2031 ($MILLION)
- FIGURE 50. LATIN AMERICA ODOR SENSOR MARKET, 2021-2031 ($MILLION)
- FIGURE 51. MIDDLE EAST ODOR SENSOR MARKET, 2021-2031 ($MILLION)
- FIGURE 52. AFRICA ODOR SENSOR MARKET, 2021-2031 ($MILLION)
- FIGURE 53. TOP WINNING STRATEGIES, BY YEAR
- FIGURE 54. TOP WINNING STRATEGIES, BY DEVELOPMENT
- FIGURE 55. TOP WINNING STRATEGIES, BY COMPANY
- FIGURE 56. PRODUCT MAPPING OF TOP 10 PLAYERS
- FIGURE 57. COMPETITIVE DASHBOARD
- FIGURE 58. COMPETITIVE HEATMAP: ODOR SENSOR MARKET
- FIGURE 59. TOP PLAYER POSITIONING, 2021
- FIGURE 60. PANASONIC CORPORATION: NET REVENUE, 2019-2021 ($MILLION)
- FIGURE 61. PANASONIC CORPORATION: REVENUE SHARE BY REGION, 2021 (%)
- FIGURE 62. PANASONIC CORPORATION: REVENUE SHARE BY REGION, 2021 (%)
- FIGURE 63. HONEYWELL INTERNATIONAL INC.: RESEARCH & DEVELOPMENT EXPENDITURE, 2019-2021 ($MILLION)
- FIGURE 64. HONEYWELL INTERNATIONAL INC.: NET SALES, 2019-2021 ($MILLION)
- FIGURE 65. HONEYWELL INTERNATIONAL INC.: REVENUE SHARE BY SEGMENT, 2021 (%)
- FIGURE 66. HONEYWELL INTERNATIONAL INC.: REVENUE SHARE BY REGION, 2021 (%)
- FIGURE 67. DRAGER: NET SALES, 2020-2021 ($MILLION)
- FIGURE 68. DRAGER: REVENUE SHARE BY SEGMENT, 2021 (%)
- FIGURE 69. DRAGER: REVENUE SHARE BY REGION, 2021 (%)
 電子鼻市場:按技術、最終用戶分類 - 2024-2030 年全球預測
 電子鼻(E-Nose):市場佔有率分析、產業趨勢與統計、2024年至2029年成長預測
 2030 年行動氣味識別終端市場預測:按技術、應用、最終用戶和地區進行的全球分析
 氣味感測器市場報告:2030 年趨勢、預測和競爭分析
 電子鼻市場報告:2030 年趨勢、預測與競爭分析
 電子鼻 (E-Nose) 的全球市場:2023年
 電子鼻市場:2023-2028年全球行業趨勢、佔有率、規模、成長、機會和預測
 2022-2028 年全球氣味傳感器市場規模、份額、行業趨勢分析報告,按傳感器類型、應用、設備類型(多氣味傳感器、單晶氣味傳感器)、最終用戶、地區展望和預測
 攜帶式臭氣感測器的全球市場:考察與預測 (到2029年)
 嗅覺感測器(E-nose)的全球市場