


 |
市場調查報告書
商品編碼
1415333
旋裝碳市場:材料類型、應用和最終用戶分類 - 2024-2030 年全球預測Spin on Carbon Market by Material Type (Hot-temperature spin on carbon, Normal-temperature spin on carbon), Application (Logic Devices, Memory Devices, Photonics), End User - Global Forecast 2024-2030 |
||||||
※ 本網頁內容可能與最新版本有所差異。詳細情況請與我們聯繫。
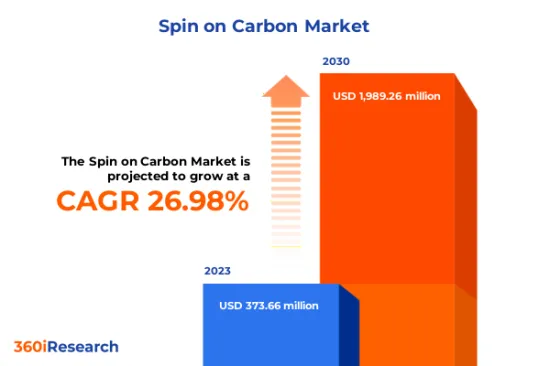
預計2023年旋裝碳市場規模為3.7366億美元,預計2024年將達4.7029億美元,2030年將達19.8926億美元,複合年成長率為26.98%。
全球旋塗碳市場
| 主要市場統計 | |
|---|---|
| 基準年[2023] | 37366萬美元 |
| 預測年份 [2024] | 47029萬美元 |
| 預測年份 [2030] | 1,989.26 百萬美元 |
| 複合年成長率(%) | 26.98% |
旋塗碳是一種主要用於半導體產業的特殊材料。旋塗碳材料是使用旋塗技術塗布半導體晶圓的碳基塗層。該工藝包括將少量旋塗碳材料沉積到晶圓上,並以高速旋轉晶圓形成薄而均勻的塗層。半導體製造中對更複雜晶片的需求不斷成長,以及記憶體製造中極紫外光刻 (EUV) 的發展,正在推動旋塗碳材料的廣泛採用。然而,由於先進的製造要求,開發和製造旋塗碳塗層的高成本可能會阻礙市場成長。也就是說,為滿足不斷變化的行業需求,旋塗碳材料配方的進步預計將為旋塗碳市場創造潛在機會。
區域洞察
由於反映材料科學和製造技術前沿研究的眾多專利創新,旋塗碳市場正在美洲地區不斷發展。此外,參與先進材料研究以及學術界和工業界之間的聯合計劃正在帶來碳基塗料的新應用和增強的性能,表明該地區旋塗碳市場的穩定成長。歐洲、中東和非洲地區,包括歐盟國家以及中東和非洲,代表了一個充滿活力和多樣化的旋塗碳市場。在該地區嚴格的環境法規和對高品質製造標準的承諾的推動下,該地區不斷上升的行動電話普及將帶動未來消費電子製造業的區域發展,這可能會導致對半導體材料和相關半導體的需求增加材料。同時,對中東國家教育機構和高科技園區的投資正在為該地區的研發開闢新的途徑。亞太地區的旋塗碳市場正在成長,其特點是對需要高等級半導體的家用電子電器的需求不斷增加。這種成長激發了人們對旋塗碳等先進材料的興趣,政府和私人實體正在投資半導體製造能力。
FPNV定位矩陣
FPNV定位矩陣對於評估旋裝碳市場至關重要。我們檢視與業務策略和產品滿意度相關的關鍵指標,以對供應商進行全面評估。這種深入的分析使用戶能夠根據自己的要求做出明智的決策。根據評估,供應商被分為四個成功程度不同的像限。最前線 (F)、探路者 (P)、利基 (N) 和重要 (V)。
市場佔有率分析
市場佔有率分析是一種綜合工具,可以對旋裝碳市場供應商的現狀進行深入而詳細的研究。全面比較和分析供應商在整體收益、基本客群和其他關鍵指標方面的貢獻,以便更好地了解公司的績效及其在爭奪市場佔有率時面臨的挑戰。此外,該分析還提供了對該行業競爭特徵的寶貴考察,包括在研究基準年觀察到的累積、分散主導地位和合併特徵等因素。這種詳細程度的提高使供應商能夠做出更明智的決策並制定有效的策略,從而在市場上獲得競爭優勢。
本報告在以下方面提供了寶貴的見解:
1-市場滲透率:提供有關主要企業所服務的市場的全面資訊。
2-市場開拓:我們深入研究利潤豐厚的新興市場,並分析它們在成熟細分市場中的滲透率。
3- 市場多元化:提供有關新產品發布、開拓地區、最新發展和投資的詳細資訊。
4-競爭力評估與資訊:對主要企業的市場佔有率、策略、產品、認證、監管狀況、專利狀況、製造能力等進行全面評估。
5- 產品開發與創新:提供對未來技術、研發活動和突破性產品開發的見解。
本報告解決了以下關鍵問題:
1-旋裝碳市場的市場規模與預測是多少?
2-旋裝碳市場預測期間需要考慮投資的產品、細分市場、應用和領域有哪些?
3-旋裝碳市場的技術趨勢和法律規範是什麼?
4-旋裝碳市場主要供應商的市場佔有率是多少?
5-進入旋裝碳市場合適的型態和策略手段是什麼?
目錄
第1章 前言
第2章調查方法
第3章執行摘要
第4章市場概況
第5章市場洞察
- 市場動態
- 促進因素
- 記憶體製造中極紫外光微影(EUV)的發展
- 半導體製造對更先進晶片的需求不斷增加
- 抑制因素
- 開發和製造旋塗碳塗層以及採購替代材料的成本高昂
- 機會
- 電子產品日益小型化以及對 MEMS 塗層性能的要求越來越高
- 物聯網的擴展以及對先進穿戴式裝置和智慧型裝置的需求
- 任務
- 將旋塗碳層與現有製造流程整合相關的技術挑戰
- 促進因素
- 市場區隔分析
- 材料類型:高溫旋塗碳 (HTC) 在高溫製程的重要用途
- 應用:由於旋塗碳能夠承受高能量等電漿蝕刻,因此其在電動設備中的使用正在迅速增加。
- 最終用戶:整合設備製造商不斷發展旋塗碳材料的使用
- 市場趨勢分析
- 高通膨的累積效應
- 波特五力分析
- 價值鍊和關鍵路徑分析
- 法律規範
第6章旋裝碳市場:依材料類型
- 介紹
- 高溫旋塗碳
- 常溫旋塗碳
第7章 旋裝碳市場:依應用分類
- 介紹
- 邏輯裝置
- 記憶設備
- 光電
- 電動設備
第 8 章 旋裝碳市場:依最終用戶分類
- 介紹
- 鑄造廠
- 綜合設備製造商
- 半導體組裝和測試委託
第 9 章 美洲旋裝碳市場
- 介紹
- 阿根廷
- 巴西
- 加拿大
- 墨西哥
- 美國
第10章亞太旋裝碳市場
- 介紹
- 澳洲
- 中國
- 印度
- 印尼
- 日本
- 馬來西亞
- 菲律賓
- 新加坡
- 韓國
- 台灣
- 泰國
- 越南
第11章 歐洲、中東和非洲的旋轉碳市場
- 介紹
- 丹麥
- 埃及
- 芬蘭
- 法國
- 德國
- 以色列
- 義大利
- 荷蘭
- 奈及利亞
- 挪威
- 波蘭
- 卡達
- 俄羅斯
- 沙烏地阿拉伯
- 南非
- 西班牙
- 瑞典
- 瑞士
- 土耳其
- 阿拉伯聯合大公國
- 英國
第12章競爭形勢
- FPNV定位矩陣
- 市場佔有率分析:主要企業
- 主要企業競爭情境分析
- 合約、合作和夥伴關係
- 新產品發布和功能增強
第13章競爭產品組合
- 主要公司簡介
- Applied Materials, Inc.
- Brewer Science, Inc.
- Dongjin Semichem Co., Ltd.
- DuPont de Nemours, Inc.
- HDC YoungChang
- Hydraquip
- INBRAIN Neuroelectronics SL
- Irresistible Materials Ltd.
- JSR Micro Inc
- Kayaku Advanced Materials, Inc.
- KOYJ CO.,LTD
- Merck KGaA
- Nano-C Inc.
- Pibond Oy
- Samsung SDI Co., Ltd.
- Shin-Etsu Chemical Co., Ltd.
- YCCHEM CO.,Ltd.
- 主要產品系列
第14章附錄
- 討論指南
- 關於許可證和定價
[184 Pages Report] The Spin on Carbon Market size was estimated at USD 373.66 million in 2023 and expected to reach USD 470.29 million in 2024, at a CAGR 26.98% to reach USD 1,989.26 million by 2030.
Global Spin on Carbon Market
| KEY MARKET STATISTICS | |
|---|---|
| Base Year [2023] | USD 373.66 million |
| Estimated Year [2024] | USD 470.29 million |
| Forecast Year [2030] | USD 1,989.26 million |
| CAGR (%) | 26.98% |
Spin on Carbon is a specialized class of materials used predominantly in the semiconductor industry. SoC materials are carbon-based coatings that are applied to semiconductor wafers using a spin-coating technique. This process involves depositing a small amount of SOC material onto the wafer and then spinning the wafer at high speed to achieve a thin, uniform coating. The growing demand for more sophisticated chips for semiconductor production and the development of extreme ultraviolet lithography (EUV) in memory manufacturing increases the adoption of the spin-on carbon material. However, the high costs involved in developing and manufacturing SoC coatings due to sophisticated production requirements may hinder market growth. Nevertheless, advancement in SoC material formulations to cater to evolving industry needs is expected to create potential opportunities for the SoC market.
Regional Insights
The Spin on Carbon (SoC) market is evolving in Americas region owing to the innovation with numerous patents reflecting pioneering work in material science and fabrication techniques. In addition, involvement in the research of advanced materials and collaborative initiatives between academia and industry are resulting in new applications and enhanced properties of carbon-based coatings, presenting a steady growth in the spin-on carbon market in this region. The EMEA region, including the European Union countries, the Middle East, and Africa, shows a dynamic and diverse market for spin-on carbon, driven by the region's stringent environmental regulations and commitment to high-quality manufacturing standards and the region has seen increased mobile penetration rates which may in the future translate to local developments in the consumer electronics manufacturing sector and subsequent demand for semiconductor materials. On the other hand, in Middle Eastern countries, investments in educational institutes and high-tech parks are opening up new avenues for research and development in the region. The Asia-Pacific region is witnessing growth in the Spin on Carbon market, characterized by a growing demand for consumer electronics that require high-grade semiconductors. This upsurge stimulates interest in advanced materials, such as spin on carbon, with government and private entities investing in semiconductor manufacturing capabilities.
FPNV Positioning Matrix
The FPNV Positioning Matrix is pivotal in evaluating the Spin on Carbon Market. It offers a comprehensive assessment of vendors, examining key metrics related to Business Strategy and Product Satisfaction. This in-depth analysis empowers users to make well-informed decisions aligned with their requirements. Based on the evaluation, the vendors are then categorized into four distinct quadrants representing varying levels of success: Forefront (F), Pathfinder (P), Niche (N), or Vital (V).
Market Share Analysis
The Market Share Analysis is a comprehensive tool that provides an insightful and in-depth examination of the current state of vendors in the Spin on Carbon Market. By meticulously comparing and analyzing vendor contributions in terms of overall revenue, customer base, and other key metrics, we can offer companies a greater understanding of their performance and the challenges they face when competing for market share. Additionally, this analysis provides valuable insights into the competitive nature of the sector, including factors such as accumulation, fragmentation dominance, and amalgamation traits observed over the base year period studied. With this expanded level of detail, vendors can make more informed decisions and devise effective strategies to gain a competitive edge in the market.
Key Company Profiles
The report delves into recent significant developments in the Spin on Carbon Market, highlighting leading vendors and their innovative profiles. These include Applied Materials, Inc., Brewer Science, Inc., Dongjin Semichem Co., Ltd., DuPont de Nemours, Inc., HDC YoungChang, Hydraquip, INBRAIN Neuroelectronics SL, Irresistible Materials Ltd., JSR Micro Inc, Kayaku Advanced Materials, Inc., KOYJ CO.,LTD, Merck KGaA, Nano-C Inc., Pibond Oy, Samsung SDI Co., Ltd., Shin-Etsu Chemical Co., Ltd., and YCCHEM CO.,Ltd..
Market Segmentation & Coverage
This research report categorizes the Spin on Carbon Market to forecast the revenues and analyze trends in each of the following sub-markets:
- Material Type
- Hot-temperature spin on carbon
- Normal-temperature spin on carbon
- Application
- Logic Devices
- Memory Devices
- Photonics
- Power Devices
- End User
- Foundries
- Integrated Device Manufacturers
- Outsourced Semiconductor Assembly & Test
- Region
- Americas
- Argentina
- Brazil
- Canada
- Mexico
- United States
- California
- Florida
- Illinois
- New York
- Ohio
- Pennsylvania
- Texas
- Asia-Pacific
- Australia
- China
- India
- Indonesia
- Japan
- Malaysia
- Philippines
- Singapore
- South Korea
- Taiwan
- Thailand
- Vietnam
- Europe, Middle East & Africa
- Denmark
- Egypt
- Finland
- France
- Germany
- Israel
- Italy
- Netherlands
- Nigeria
- Norway
- Poland
- Qatar
- Russia
- Saudi Arabia
- South Africa
- Spain
- Sweden
- Switzerland
- Turkey
- United Arab Emirates
- United Kingdom
- Americas
The report offers valuable insights on the following aspects:
1. Market Penetration: It presents comprehensive information on the market provided by key players.
2. Market Development: It delves deep into lucrative emerging markets and analyzes the penetration across mature market segments.
3. Market Diversification: It provides detailed information on new product launches, untapped geographic regions, recent developments, and investments.
4. Competitive Assessment & Intelligence: It conducts an exhaustive assessment of market shares, strategies, products, certifications, regulatory approvals, patent landscape, and manufacturing capabilities of the leading players.
5. Product Development & Innovation: It offers intelligent insights on future technologies, R&D activities, and breakthrough product developments.
The report addresses key questions such as:
1. What is the market size and forecast of the Spin on Carbon Market?
2. Which products, segments, applications, and areas should one consider investing in over the forecast period in the Spin on Carbon Market?
3. What are the technology trends and regulatory frameworks in the Spin on Carbon Market?
4. What is the market share of the leading vendors in the Spin on Carbon Market?
5. Which modes and strategic moves are suitable for entering the Spin on Carbon Market?
Table of Contents
1. Preface
- 1.1. Objectives of the Study
- 1.2. Market Segmentation & Coverage
- 1.3. Years Considered for the Study
- 1.4. Currency & Pricing
- 1.5. Language
- 1.6. Limitations
- 1.7. Assumptions
- 1.8. Stakeholders
2. Research Methodology
- 2.1. Define: Research Objective
- 2.2. Determine: Research Design
- 2.3. Prepare: Research Instrument
- 2.4. Collect: Data Source
- 2.5. Analyze: Data Interpretation
- 2.6. Formulate: Data Verification
- 2.7. Publish: Research Report
- 2.8. Repeat: Report Update
3. Executive Summary
4. Market Overview
- 4.1. Introduction
- 4.2. Spin on Carbon Market, by Region
5. Market Insights
- 5.1. Market Dynamics
- 5.1.1. Drivers
- 5.1.1.1. Development of extreme ultraviolet lithography (EUV) in memory manufacturing
- 5.1.1.2. Growing demand for more sophisticated chips for semiconductor production
- 5.1.2. Restraints
- 5.1.2.1. High costs involved in the development and manufacturing of SoC coatings and availability of substitute materials
- 5.1.3. Opportunities
- 5.1.3.1. Increrasing miniaturization of electronic devices and the requirement for better performance coatings in MEMS
- 5.1.3.2. Expansion of the IoT and the need for sophisticated wearables and smart devices
- 5.1.4. Challenges
- 5.1.4.1. Technical challenges associated with the integration of SOC layers with existing manufacturing processes
- 5.1.1. Drivers
- 5.2. Market Segmentation Analysis
- 5.2.1. Material Type: Significant usage of hot-temperature spin on carbon (HTC) in high-temperature processes
- 5.2.2. Application: Burgeoning utilization of SoC in power devices owing to its capability to endure high-energy plasma etches
- 5.2.3. End User: Evolving utilization of spin on carbon material by integrated device manufacturers
- 5.3. Market Trend Analysis
- 5.4. Cumulative Impact of High Inflation
- 5.5. Porter's Five Forces Analysis
- 5.5.1. Threat of New Entrants
- 5.5.2. Threat of Substitutes
- 5.5.3. Bargaining Power of Customers
- 5.5.4. Bargaining Power of Suppliers
- 5.5.5. Industry Rivalry
- 5.6. Value Chain & Critical Path Analysis
- 5.7. Regulatory Framework
6. Spin on Carbon Market, by Material Type
- 6.1. Introduction
- 6.2. Hot-temperature spin on carbon
- 6.3. Normal-temperature spin on carbon
7. Spin on Carbon Market, by Application
- 7.1. Introduction
- 7.2. Logic Devices
- 7.3. Memory Devices
- 7.4. Photonics
- 7.5. Power Devices
8. Spin on Carbon Market, by End User
- 8.1. Introduction
- 8.2. Foundries
- 8.3. Integrated Device Manufacturers
- 8.4. Outsourced Semiconductor Assembly & Test
9. Americas Spin on Carbon Market
- 9.1. Introduction
- 9.2. Argentina
- 9.3. Brazil
- 9.4. Canada
- 9.5. Mexico
- 9.6. United States
10. Asia-Pacific Spin on Carbon Market
- 10.1. Introduction
- 10.2. Australia
- 10.3. China
- 10.4. India
- 10.5. Indonesia
- 10.6. Japan
- 10.7. Malaysia
- 10.8. Philippines
- 10.9. Singapore
- 10.10. South Korea
- 10.11. Taiwan
- 10.12. Thailand
- 10.13. Vietnam
11. Europe, Middle East & Africa Spin on Carbon Market
- 11.1. Introduction
- 11.2. Denmark
- 11.3. Egypt
- 11.4. Finland
- 11.5. France
- 11.6. Germany
- 11.7. Israel
- 11.8. Italy
- 11.9. Netherlands
- 11.10. Nigeria
- 11.11. Norway
- 11.12. Poland
- 11.13. Qatar
- 11.14. Russia
- 11.15. Saudi Arabia
- 11.16. South Africa
- 11.17. Spain
- 11.18. Sweden
- 11.19. Switzerland
- 11.20. Turkey
- 11.21. United Arab Emirates
- 11.22. United Kingdom
12. Competitive Landscape
- 12.1. FPNV Positioning Matrix
- 12.2. Market Share Analysis, By Key Player
- 12.3. Competitive Scenario Analysis, By Key Player
- 12.3.1. Agreement, Collaboration, & Partnership
- 12.3.1.1. Coburn Technologies and SDC Technologies Announce the Launch of a Breakthrough Photochromic System for Optical Labs
- 12.3.2. New Product Launch & Enhancement
- 12.3.2.1. Lam Research launches Coronus DX to facilitate advanced wafer semiconductor manufacturing
- 12.3.1. Agreement, Collaboration, & Partnership
13. Competitive Portfolio
- 13.1. Key Company Profiles
- 13.1.1. Applied Materials, Inc.
- 13.1.2. Brewer Science, Inc.
- 13.1.3. Dongjin Semichem Co., Ltd.
- 13.1.4. DuPont de Nemours, Inc.
- 13.1.5. HDC YoungChang
- 13.1.6. Hydraquip
- 13.1.7. INBRAIN Neuroelectronics SL
- 13.1.8. Irresistible Materials Ltd.
- 13.1.9. JSR Micro Inc
- 13.1.10. Kayaku Advanced Materials, Inc.
- 13.1.11. KOYJ CO.,LTD
- 13.1.12. Merck KGaA
- 13.1.13. Nano-C Inc.
- 13.1.14. Pibond Oy
- 13.1.15. Samsung SDI Co., Ltd.
- 13.1.16. Shin-Etsu Chemical Co., Ltd.
- 13.1.17. YCCHEM CO.,Ltd.
- 13.2. Key Product Portfolio
14. Appendix
- 14.1. Discussion Guide
- 14.2. License & Pricing
LIST OF FIGURES
- FIGURE 1. SPIN ON CARBON MARKET RESEARCH PROCESS
- FIGURE 2. SPIN ON CARBON MARKET SIZE, 2023 VS 2030
- FIGURE 3. SPIN ON CARBON MARKET SIZE, 2018-2030 (USD MILLION)
- FIGURE 4. SPIN ON CARBON MARKET SIZE, BY REGION, 2023 VS 2030 (%)
- FIGURE 5. SPIN ON CARBON MARKET SIZE, BY REGION, 2023 VS 2024 VS 2030 (USD MILLION)
- FIGURE 6. SPIN ON CARBON MARKET DYNAMICS
- FIGURE 7. SPIN ON CARBON MARKET SIZE, BY MATERIAL TYPE, 2023 VS 2030 (%)
- FIGURE 8. SPIN ON CARBON MARKET SIZE, BY MATERIAL TYPE, 2023 VS 2024 VS 2030 (USD MILLION)
- FIGURE 9. SPIN ON CARBON MARKET SIZE, BY APPLICATION, 2023 VS 2030 (%)
- FIGURE 10. SPIN ON CARBON MARKET SIZE, BY APPLICATION, 2023 VS 2024 VS 2030 (USD MILLION)
- FIGURE 11. SPIN ON CARBON MARKET SIZE, BY END USER, 2023 VS 2030 (%)
- FIGURE 12. SPIN ON CARBON MARKET SIZE, BY END USER, 2023 VS 2024 VS 2030 (USD MILLION)
- FIGURE 13. AMERICAS SPIN ON CARBON MARKET SIZE, BY COUNTRY, 2023 VS 2030 (%)
- FIGURE 14. AMERICAS SPIN ON CARBON MARKET SIZE, BY COUNTRY, 2023 VS 2024 VS 2030 (USD MILLION)
- FIGURE 15. UNITED STATES SPIN ON CARBON MARKET SIZE, BY STATE, 2023 VS 2030 (%)
- FIGURE 16. UNITED STATES SPIN ON CARBON MARKET SIZE, BY STATE, 2023 VS 2024 VS 2030 (USD MILLION)
- FIGURE 17. ASIA-PACIFIC SPIN ON CARBON MARKET SIZE, BY COUNTRY, 2023 VS 2030 (%)
- FIGURE 18. ASIA-PACIFIC SPIN ON CARBON MARKET SIZE, BY COUNTRY, 2023 VS 2024 VS 2030 (USD MILLION)
- FIGURE 19. EUROPE, MIDDLE EAST & AFRICA SPIN ON CARBON MARKET SIZE, BY COUNTRY, 2023 VS 2030 (%)
- FIGURE 20. EUROPE, MIDDLE EAST & AFRICA SPIN ON CARBON MARKET SIZE, BY COUNTRY, 2023 VS 2024 VS 2030 (USD MILLION)
- FIGURE 21. SPIN ON CARBON MARKET, FPNV POSITIONING MATRIX, 2023
- FIGURE 22. SPIN ON CARBON MARKET SHARE, BY KEY PLAYER, 2023
LIST OF TABLES
- TABLE 1. SPIN ON CARBON MARKET SEGMENTATION & COVERAGE
- TABLE 2. UNITED STATES DOLLAR EXCHANGE RATE, 2018-2023
- TABLE 3. SPIN ON CARBON MARKET SIZE, 2018-2030 (USD MILLION)
- TABLE 4. GLOBAL SPIN ON CARBON MARKET SIZE, BY REGION, 2018-2030 (USD MILLION)
- TABLE 5. SPIN ON CARBON MARKET SIZE, BY MATERIAL TYPE, 2018-2030 (USD MILLION)
- TABLE 6. SPIN ON CARBON MARKET SIZE, BY HOT-TEMPERATURE SPIN ON CARBON, BY REGION, 2018-2030 (USD MILLION)
- TABLE 7. SPIN ON CARBON MARKET SIZE, BY NORMAL-TEMPERATURE SPIN ON CARBON, BY REGION, 2018-2030 (USD MILLION)
- TABLE 8. SPIN ON CARBON MARKET SIZE, BY APPLICATION, 2018-2030 (USD MILLION)
- TABLE 9. SPIN ON CARBON MARKET SIZE, BY LOGIC DEVICES, BY REGION, 2018-2030 (USD MILLION)
- TABLE 10. SPIN ON CARBON MARKET SIZE, BY MEMORY DEVICES, BY REGION, 2018-2030 (USD MILLION)
- TABLE 11. SPIN ON CARBON MARKET SIZE, BY PHOTONICS, BY REGION, 2018-2030 (USD MILLION)
- TABLE 12. SPIN ON CARBON MARKET SIZE, BY POWER DEVICES, BY REGION, 2018-2030 (USD MILLION)
- TABLE 13. SPIN ON CARBON MARKET SIZE, BY END USER, 2018-2030 (USD MILLION)
- TABLE 14. SPIN ON CARBON MARKET SIZE, BY FOUNDRIES, BY REGION, 2018-2030 (USD MILLION)
- TABLE 15. SPIN ON CARBON MARKET SIZE, BY INTEGRATED DEVICE MANUFACTURERS, BY REGION, 2018-2030 (USD MILLION)
- TABLE 16. SPIN ON CARBON MARKET SIZE, BY OUTSOURCED SEMICONDUCTOR ASSEMBLY & TEST, BY REGION, 2018-2030 (USD MILLION)
- TABLE 17. AMERICAS SPIN ON CARBON MARKET SIZE, BY MATERIAL TYPE, 2018-2030 (USD MILLION)
- TABLE 18. AMERICAS SPIN ON CARBON MARKET SIZE, BY APPLICATION, 2018-2030 (USD MILLION)
- TABLE 19. AMERICAS SPIN ON CARBON MARKET SIZE, BY END USER, 2018-2030 (USD MILLION)
- TABLE 20. AMERICAS SPIN ON CARBON MARKET SIZE, BY COUNTRY, 2018-2030 (USD MILLION)
- TABLE 21. ARGENTINA SPIN ON CARBON MARKET SIZE, BY MATERIAL TYPE, 2018-2030 (USD MILLION)
- TABLE 22. ARGENTINA SPIN ON CARBON MARKET SIZE, BY APPLICATION, 2018-2030 (USD MILLION)
- TABLE 23. ARGENTINA SPIN ON CARBON MARKET SIZE, BY END USER, 2018-2030 (USD MILLION)
- TABLE 24. BRAZIL SPIN ON CARBON MARKET SIZE, BY MATERIAL TYPE, 2018-2030 (USD MILLION)
- TABLE 25. BRAZIL SPIN ON CARBON MARKET SIZE, BY APPLICATION, 2018-2030 (USD MILLION)
- TABLE 26. BRAZIL SPIN ON CARBON MARKET SIZE, BY END USER, 2018-2030 (USD MILLION)
- TABLE 27. CANADA SPIN ON CARBON MARKET SIZE, BY MATERIAL TYPE, 2018-2030 (USD MILLION)
- TABLE 28. CANADA SPIN ON CARBON MARKET SIZE, BY APPLICATION, 2018-2030 (USD MILLION)
- TABLE 29. CANADA SPIN ON CARBON MARKET SIZE, BY END USER, 2018-2030 (USD MILLION)
- TABLE 30. MEXICO SPIN ON CARBON MARKET SIZE, BY MATERIAL TYPE, 2018-2030 (USD MILLION)
- TABLE 31. MEXICO SPIN ON CARBON MARKET SIZE, BY APPLICATION, 2018-2030 (USD MILLION)
- TABLE 32. MEXICO SPIN ON CARBON MARKET SIZE, BY END USER, 2018-2030 (USD MILLION)
- TABLE 33. UNITED STATES SPIN ON CARBON MARKET SIZE, BY MATERIAL TYPE, 2018-2030 (USD MILLION)
- TABLE 34. UNITED STATES SPIN ON CARBON MARKET SIZE, BY APPLICATION, 2018-2030 (USD MILLION)
- TABLE 35. UNITED STATES SPIN ON CARBON MARKET SIZE, BY END USER, 2018-2030 (USD MILLION)
- TABLE 36. UNITED STATES SPIN ON CARBON MARKET SIZE, BY STATE, 2018-2030 (USD MILLION)
- TABLE 37. ASIA-PACIFIC SPIN ON CARBON MARKET SIZE, BY MATERIAL TYPE, 2018-2030 (USD MILLION)
- TABLE 38. ASIA-PACIFIC SPIN ON CARBON MARKET SIZE, BY APPLICATION, 2018-2030 (USD MILLION)
- TABLE 39. ASIA-PACIFIC SPIN ON CARBON MARKET SIZE, BY END USER, 2018-2030 (USD MILLION)
- TABLE 40. ASIA-PACIFIC SPIN ON CARBON MARKET SIZE, BY COUNTRY, 2018-2030 (USD MILLION)
- TABLE 41. AUSTRALIA SPIN ON CARBON MARKET SIZE, BY MATERIAL TYPE, 2018-2030 (USD MILLION)
- TABLE 42. AUSTRALIA SPIN ON CARBON MARKET SIZE, BY APPLICATION, 2018-2030 (USD MILLION)
- TABLE 43. AUSTRALIA SPIN ON CARBON MARKET SIZE, BY END USER, 2018-2030 (USD MILLION)
- TABLE 44. CHINA SPIN ON CARBON MARKET SIZE, BY MATERIAL TYPE, 2018-2030 (USD MILLION)
- TABLE 45. CHINA SPIN ON CARBON MARKET SIZE, BY APPLICATION, 2018-2030 (USD MILLION)
- TABLE 46. CHINA SPIN ON CARBON MARKET SIZE, BY END USER, 2018-2030 (USD MILLION)
- TABLE 47. INDIA SPIN ON CARBON MARKET SIZE, BY MATERIAL TYPE, 2018-2030 (USD MILLION)
- TABLE 48. INDIA SPIN ON CARBON MARKET SIZE, BY APPLICATION, 2018-2030 (USD MILLION)
- TABLE 49. INDIA SPIN ON CARBON MARKET SIZE, BY END USER, 2018-2030 (USD MILLION)
- TABLE 50. INDONESIA SPIN ON CARBON MARKET SIZE, BY MATERIAL TYPE, 2018-2030 (USD MILLION)
- TABLE 51. INDONESIA SPIN ON CARBON MARKET SIZE, BY APPLICATION, 2018-2030 (USD MILLION)
- TABLE 52. INDONESIA SPIN ON CARBON MARKET SIZE, BY END USER, 2018-2030 (USD MILLION)
- TABLE 53. JAPAN SPIN ON CARBON MARKET SIZE, BY MATERIAL TYPE, 2018-2030 (USD MILLION)
- TABLE 54. JAPAN SPIN ON CARBON MARKET SIZE, BY APPLICATION, 2018-2030 (USD MILLION)
- TABLE 55. JAPAN SPIN ON CARBON MARKET SIZE, BY END USER, 2018-2030 (USD MILLION)
- TABLE 56. MALAYSIA SPIN ON CARBON MARKET SIZE, BY MATERIAL TYPE, 2018-2030 (USD MILLION)
- TABLE 57. MALAYSIA SPIN ON CARBON MARKET SIZE, BY APPLICATION, 2018-2030 (USD MILLION)
- TABLE 58. MALAYSIA SPIN ON CARBON MARKET SIZE, BY END USER, 2018-2030 (USD MILLION)
- TABLE 59. PHILIPPINES SPIN ON CARBON MARKET SIZE, BY MATERIAL TYPE, 2018-2030 (USD MILLION)
- TABLE 60. PHILIPPINES SPIN ON CARBON MARKET SIZE, BY APPLICATION, 2018-2030 (USD MILLION)
- TABLE 61. PHILIPPINES SPIN ON CARBON MARKET SIZE, BY END USER, 2018-2030 (USD MILLION)
- TABLE 62. SINGAPORE SPIN ON CARBON MARKET SIZE, BY MATERIAL TYPE, 2018-2030 (USD MILLION)
- TABLE 63. SINGAPORE SPIN ON CARBON MARKET SIZE, BY APPLICATION, 2018-2030 (USD MILLION)
- TABLE 64. SINGAPORE SPIN ON CARBON MARKET SIZE, BY END USER, 2018-2030 (USD MILLION)
- TABLE 65. SOUTH KOREA SPIN ON CARBON MARKET SIZE, BY MATERIAL TYPE, 2018-2030 (USD MILLION)
- TABLE 66. SOUTH KOREA SPIN ON CARBON MARKET SIZE, BY APPLICATION, 2018-2030 (USD MILLION)
- TABLE 67. SOUTH KOREA SPIN ON CARBON MARKET SIZE, BY END USER, 2018-2030 (USD MILLION)
- TABLE 68. TAIWAN SPIN ON CARBON MARKET SIZE, BY MATERIAL TYPE, 2018-2030 (USD MILLION)
- TABLE 69. TAIWAN SPIN ON CARBON MARKET SIZE, BY APPLICATION, 2018-2030 (USD MILLION)
- TABLE 70. TAIWAN SPIN ON CARBON MARKET SIZE, BY END USER, 2018-2030 (USD MILLION)
- TABLE 71. THAILAND SPIN ON CARBON MARKET SIZE, BY MATERIAL TYPE, 2018-2030 (USD MILLION)
- TABLE 72. THAILAND SPIN ON CARBON MARKET SIZE, BY APPLICATION, 2018-2030 (USD MILLION)
- TABLE 73. THAILAND SPIN ON CARBON MARKET SIZE, BY END USER, 2018-2030 (USD MILLION)
- TABLE 74. VIETNAM SPIN ON CARBON MARKET SIZE, BY MATERIAL TYPE, 2018-2030 (USD MILLION)
- TABLE 75. VIETNAM SPIN ON CARBON MARKET SIZE, BY APPLICATION, 2018-2030 (USD MILLION)
- TABLE 76. VIETNAM SPIN ON CARBON MARKET SIZE, BY END USER, 2018-2030 (USD MILLION)
- TABLE 77. EUROPE, MIDDLE EAST & AFRICA SPIN ON CARBON MARKET SIZE, BY MATERIAL TYPE, 2018-2030 (USD MILLION)
- TABLE 78. EUROPE, MIDDLE EAST & AFRICA SPIN ON CARBON MARKET SIZE, BY APPLICATION, 2018-2030 (USD MILLION)
- TABLE 79. EUROPE, MIDDLE EAST & AFRICA SPIN ON CARBON MARKET SIZE, BY END USER, 2018-2030 (USD MILLION)
- TABLE 80. EUROPE, MIDDLE EAST & AFRICA SPIN ON CARBON MARKET SIZE, BY COUNTRY, 2018-2030 (USD MILLION)
- TABLE 81. DENMARK SPIN ON CARBON MARKET SIZE, BY MATERIAL TYPE, 2018-2030 (USD MILLION)
- TABLE 82. DENMARK SPIN ON CARBON MARKET SIZE, BY APPLICATION, 2018-2030 (USD MILLION)
- TABLE 83. DENMARK SPIN ON CARBON MARKET SIZE, BY END USER, 2018-2030 (USD MILLION)
- TABLE 84. EGYPT SPIN ON CARBON MARKET SIZE, BY MATERIAL TYPE, 2018-2030 (USD MILLION)
- TABLE 85. EGYPT SPIN ON CARBON MARKET SIZE, BY APPLICATION, 2018-2030 (USD MILLION)
- TABLE 86. EGYPT SPIN ON CARBON MARKET SIZE, BY END USER, 2018-2030 (USD MILLION)
- TABLE 87. FINLAND SPIN ON CARBON MARKET SIZE, BY MATERIAL TYPE, 2018-2030 (USD MILLION)
- TABLE 88. FINLAND SPIN ON CARBON MARKET SIZE, BY APPLICATION, 2018-2030 (USD MILLION)
- TABLE 89. FINLAND SPIN ON CARBON MARKET SIZE, BY END USER, 2018-2030 (USD MILLION)
- TABLE 90. FRANCE SPIN ON CARBON MARKET SIZE, BY MATERIAL TYPE, 2018-2030 (USD MILLION)
- TABLE 91. FRANCE SPIN ON CARBON MARKET SIZE, BY APPLICATION, 2018-2030 (USD MILLION)
- TABLE 92. FRANCE SPIN ON CARBON MARKET SIZE, BY END USER, 2018-2030 (USD MILLION)
- TABLE 93. GERMANY SPIN ON CARBON MARKET SIZE, BY MATERIAL TYPE, 2018-2030 (USD MILLION)
- TABLE 94. GERMANY SPIN ON CARBON MARKET SIZE, BY APPLICATION, 2018-2030 (USD MILLION)
- TABLE 95. GERMANY SPIN ON CARBON MARKET SIZE, BY END USER, 2018-2030 (USD MILLION)
- TABLE 96. ISRAEL SPIN ON CARBON MARKET SIZE, BY MATERIAL TYPE, 2018-2030 (USD MILLION)
- TABLE 97. ISRAEL SPIN ON CARBON MARKET SIZE, BY APPLICATION, 2018-2030 (USD MILLION)
- TABLE 98. ISRAEL SPIN ON CARBON MARKET SIZE, BY END USER, 2018-2030 (USD MILLION)
- TABLE 99. ITALY SPIN ON CARBON MARKET SIZE, BY MATERIAL TYPE, 2018-2030 (USD MILLION)
- TABLE 100. ITALY SPIN ON CARBON MARKET SIZE, BY APPLICATION, 2018-2030 (USD MILLION)
- TABLE 101. ITALY SPIN ON CARBON MARKET SIZE, BY END USER, 2018-2030 (USD MILLION)
- TABLE 102. NETHERLANDS SPIN ON CARBON MARKET SIZE, BY MATERIAL TYPE, 2018-2030 (USD MILLION)
- TABLE 103. NETHERLANDS SPIN ON CARBON MARKET SIZE, BY APPLICATION, 2018-2030 (USD MILLION)
- TABLE 104. NETHERLANDS SPIN ON CARBON MARKET SIZE, BY END USER, 2018-2030 (USD MILLION)
- TABLE 105. NIGERIA SPIN ON CARBON MARKET SIZE, BY MATERIAL TYPE, 2018-2030 (USD MILLION)
- TABLE 106. NIGERIA SPIN ON CARBON MARKET SIZE, BY APPLICATION, 2018-2030 (USD MILLION)
- TABLE 107. NIGERIA SPIN ON CARBON MARKET SIZE, BY END USER, 2018-2030 (USD MILLION)
- TABLE 108. NORWAY SPIN ON CARBON MARKET SIZE, BY MATERIAL TYPE, 2018-2030 (USD MILLION)
- TABLE 109. NORWAY SPIN ON CARBON MARKET SIZE, BY APPLICATION, 2018-2030 (USD MILLION)
- TABLE 110. NORWAY SPIN ON CARBON MARKET SIZE, BY END USER, 2018-2030 (USD MILLION)
- TABLE 111. POLAND SPIN ON CARBON MARKET SIZE, BY MATERIAL TYPE, 2018-2030 (USD MILLION)
- TABLE 112. POLAND SPIN ON CARBON MARKET SIZE, BY APPLICATION, 2018-2030 (USD MILLION)
- TABLE 113. POLAND SPIN ON CARBON MARKET SIZE, BY END USER, 2018-2030 (USD MILLION)
- TABLE 114. QATAR SPIN ON CARBON MARKET SIZE, BY MATERIAL TYPE, 2018-2030 (USD MILLION)
- TABLE 115. QATAR SPIN ON CARBON MARKET SIZE, BY APPLICATION, 2018-2030 (USD MILLION)
- TABLE 116. QATAR SPIN ON CARBON MARKET SIZE, BY END USER, 2018-2030 (USD MILLION)
- TABLE 117. RUSSIA SPIN ON CARBON MARKET SIZE, BY MATERIAL TYPE, 2018-2030 (USD MILLION)
- TABLE 118. RUSSIA SPIN ON CARBON MARKET SIZE, BY APPLICATION, 2018-2030 (USD MILLION)
- TABLE 119. RUSSIA SPIN ON CARBON MARKET SIZE, BY END USER, 2018-2030 (USD MILLION)
- TABLE 120. SAUDI ARABIA SPIN ON CARBON MARKET SIZE, BY MATERIAL TYPE, 2018-2030 (USD MILLION)
- TABLE 121. SAUDI ARABIA SPIN ON CARBON MARKET SIZE, BY APPLICATION, 2018-2030 (USD MILLION)
- TABLE 122. SAUDI ARABIA SPIN ON CARBON MARKET SIZE, BY END USER, 2018-2030 (USD MILLION)
- TABLE 123. SOUTH AFRICA SPIN ON CARBON MARKET SIZE, BY MATERIAL TYPE, 2018-2030 (USD MILLION)
- TABLE 124. SOUTH AFRICA SPIN ON CARBON MARKET SIZE, BY APPLICATION, 2018-2030 (USD MILLION)
- TABLE 125. SOUTH AFRICA SPIN ON CARBON MARKET SIZE, BY END USER, 2018-2030 (USD MILLION)
- TABLE 126. SPAIN SPIN ON CARBON MARKET SIZE, BY MATERIAL TYPE, 2018-2030 (USD MILLION)
- TABLE 127. SPAIN SPIN ON CARBON MARKET SIZE, BY APPLICATION, 2018-2030 (USD MILLION)
- TABLE 128. SPAIN SPIN ON CARBON MARKET SIZE, BY END USER, 2018-2030 (USD MILLION)
- TABLE 129. SWEDEN SPIN ON CARBON MARKET SIZE, BY MATERIAL TYPE, 2018-2030 (USD MILLION)
- TABLE 130. SWEDEN SPIN ON CARBON MARKET SIZE, BY APPLICATION, 2018-2030 (USD MILLION)
- TABLE 131. SWEDEN SPIN ON CARBON MARKET SIZE, BY END USER, 2018-2030 (USD MILLION)
- TABLE 132. SWITZERLAND SPIN ON CARBON MARKET SIZE, BY MATERIAL TYPE, 2018-2030 (USD MILLION)
- TABLE 133. SWITZERLAND SPIN ON CARBON MARKET SIZE, BY APPLICATION, 2018-2030 (USD MILLION)
- TABLE 134. SWITZERLAND SPIN ON CARBON MARKET SIZE, BY END USER, 2018-2030 (USD MILLION)
- TABLE 135. TURKEY SPIN ON CARBON MARKET SIZE, BY MATERIAL TYPE, 2018-2030 (USD MILLION)
- TABLE 136. TURKEY SPIN ON CARBON MARKET SIZE, BY APPLICATION, 2018-2030 (USD MILLION)
- TABLE 137. TURKEY SPIN ON CARBON MARKET SIZE, BY END USER, 2018-2030 (USD MILLION)
- TABLE 138. UNITED ARAB EMIRATES SPIN ON CARBON MARKET SIZE, BY MATERIAL TYPE, 2018-2030 (USD MILLION)
- TABLE 139. UNITED ARAB EMIRATES SPIN ON CARBON MARKET SIZE, BY APPLICATION, 2018-2030 (USD MILLION)
- TABLE 140. UNITED ARAB EMIRATES SPIN ON CARBON MARKET SIZE, BY END USER, 2018-2030 (USD MILLION)
- TABLE 141. UNITED KINGDOM SPIN ON CARBON MARKET SIZE, BY MATERIAL TYPE, 2018-2030 (USD MILLION)
- TABLE 142. UNITED KINGDOM SPIN ON CARBON MARKET SIZE, BY APPLICATION, 2018-2030 (USD MILLION)
- TABLE 143. UNITED KINGDOM SPIN ON CARBON MARKET SIZE, BY END USER, 2018-2030 (USD MILLION)
- TABLE 144. SPIN ON CARBON MARKET, FPNV POSITIONING MATRIX, 2023
- TABLE 145. SPIN ON CARBON MARKET SHARE, BY KEY PLAYER, 2023
- TABLE 146. SPIN ON CARBON MARKET LICENSE & PRICING
 全球多模式晶片組市場研究報告 - 2024 年至 2032 年產業分析、規模、佔有率、成長、趨勢與預測
 多模晶片組市場(應用:智慧型手機、平板電腦、穿戴式裝置等)- 2023-2031 年全球產業分析、規模、佔有率、成長、趨勢與預測
 寬頻通訊晶片組市場報告:2030 年趨勢、預測與競爭分析
 投影機光處理晶片市場報告:2030 年趨勢、預測與競爭分析
 窄頻 PLC 晶片市場報告:2030 年趨勢、預測與競爭分析
 全球旋裝碳市場:按材料類型、按應用、按最終用戶、按地區 - 預測至 2028 年
 Wi-Fi 晶片組市場 - 全球產業規模、佔有率、趨勢、機會和預測,按類型、製造技術、晶片尺寸、按應用、地區、競爭細分,2018-2028 年
 多媒體晶片組市場 - 全球產業規模、佔有率、趨勢、機會和預測,按類型、按應用、最終用戶、地區、競爭細分,2018-2028 年
 數位光處理技術市場報告:2030 年趨勢、預測與競爭分析
 物聯網芯片組和物聯網模塊的趨勢:2023 年