


 |
市場調查報告書
商品編碼
1073200
全球治療性疫苗市場:疫苗類型(抗原疫苗,DNA疫苗,樹突狀細胞疫苗),疫苗組成方法(自身疫苗,同種異體疫苗),治療類型(單藥治療,聯合治療)Global Therapeutic Vaccines Market Distribution by Type of Vaccine (Antigen vaccine, DNA vaccine and Dendritic vaccine), Method of Vaccine Composition (Autologous vaccine and Allogeneic vaccine), Type of Therapy (Monotherapy and Combination Therapy), |
||||||
除了為預防疾病爆發而設計和管理的預防性疫苗外,研究人員還開發了治療性疫苗,旨在減輕已經感染該疾病的患者的痛苦。治療性疫苗不如預防性疫苗有效,但它們在各種臨床條件下表現出安全性、特異性和長期反應。
本報告分析了全球治療性疫苗市場、產品概況和市場基本結構、在研產品概況和臨床試驗進展、主要公司概況、重大資本交易和業務發展,我們將為您提供業務動態、創業趨勢、當前和未來的市場機會等。
文本中的圖表示例
目錄
第一章介紹
第2章執行摘要
第三章介紹
- 分析總結
- 治療性疫苗:概述
- 疫苗分類:按組成方法
- 疫苗分類:按作用機制
- 抗原疫苗
- 樹突疫苗
- DNA疫苗
- □疫苗
- 主要目標的跡象
- 癌症
- HIV 感染
- HPV感染
- 皰疹
- 疫苗臨床開發和批准
- 結論
第四章市場情況
- 分析總結
- 治療性疫苗:管道分析
- 發展階段分析
- 按疫苗類型分析
- 按疫苗類型分析(按組成方法)
- 按治療類型分析
- 目標疾病分析
- 給藥途徑分析
- 劑量分析
- 治療性疫苗:疫苗開發商分析
- 成立年份分析
- 按公司規模分析
- 按總部位置分析
- 主要開發商
- 網格分析:按發展階段、公司規模、總部位置
第 5 章公司簡介
- 分析總結
- BioNTech
- 公司簡介
- 財務信息
- 治療性疫苗端口對開本
- 最新趨勢和未來展望
- Brii Biosciences
- GlobeImmune
- Immatics
- Immune Response Biopharma
- Immunitor
- Inovio Pharmaceuticals
- Moderna
第6章臨床試驗分析
- 分析總結
- 分析範圍/方法
- 治療性疫苗:臨床試驗分析
- 臨床試驗註冊年份分析
- 按臨床試驗入組年份和入組患者人群分析
- 臨床試驗階段分析
- 按招聘情況分析
- 研究設計分析
- 臨床試驗重點領域分析
- 目標疾病分析
- 贊助商/合作者類型分析
- 最活躍的公司:註冊臨床試驗分析
- 註冊測試數量:按地區分析
- 入組患者人群:區域分析
第7章學術資助分析
- 分析總結
- 分析範圍/方法
- 治療性疫苗:學術資助分析
- 資助年份分析
- 按獎勵金額分析
- 研究所經營主體分析
- 資助期分析
- 按管理主題和資助期限分析
- 按資助申請類型分析
- 按用途分析贈款
- 按活動代碼分析
- 相關研究部門分析
- 按接收機構類型分析
- 詞雲分析:新焦點
- 受援組織的地理分佈
- 受歡迎的 NIH 部門:資助計數分析
- 傑出項目官員:資助數量分析
- 受歡迎的 Zuryo:撥款數量分析
第8章商業聯盟/合作
- 分析總結
- 商業聯盟模式
- 治療性疫苗:商業聯盟/合作
- 商業聯盟年度分析
- 商業聯盟類型分析
- 按年份和合作夥伴類型分析商業聯盟
- 按商業聯盟/合作夥伴類型分析
- 按優先級字段分析
- 按治療區域分析
- 最活躍公司:商業聯盟數量分析
- 區域分析
第9章啟動健康指數
- 分析總結
- 治療性疫苗市場啟動
- 按總部位置分析
- 啟動基準
- 供應商實力分析
- 管道強度分析
- 管道成熟度分析
- 金融投資分析
- 聯盟活動分析
- 創業健康指數:根源分析視角
第10章市場預測與機會分析
- 分析總結
- 預測方法和關鍵假設
- 全球治療性疫苗市場(2022-2035)
- 全球治療性疫苗市場:按疫苗類型(2022-2035)
- 全球治療性疫苗市場:按疫苗組成方法(2022-2035)
- 全球治療性疫苗市場:按治療類型(2022-2035)
- 全球治療性疫苗市場:按目標疾病(2022-2035)
- 全球治療性疫苗市場:按給藥途徑(2022-2035)
- 全球治療性疫苗市場:按地區劃分(2022-2035)
- 美國治療性疫苗市場(2022-2035)
- 加拿大治療性疫苗市場(2022-2035)
- 英國治療性疫苗市場 (2022-2035)
- 德國治療性疫苗市場(2022-2035)
- 法國治療性疫苗市場 (2022-2035)
- 意大利治療性疫苗市場(2022-2035)
- 西班牙治療性疫苗市場(2022-2035)
- 澳大利亞治療性疫苗市場(2022-2035)
- 日本治療性疫苗市場(2022-2035)
- 韓國治療性疫苗市場(2022-2035)
- 巴西治療性疫苗市場(2022-2035 年)
- 以色列治療性疫苗市場 (2022-2035)
- 全球治療性疫苗市場:單個產品的銷售預測(2022-2035)
- ASP0113
- Copaxone
- Galinpepimut-S
- Hepcortespenlisimut-L
- ICT-107
- IR103
- MGN1703
- Neuronata-R
- OncoVax
- OSE2101
- Provenge
- REMUNE
- RIAVAX
- V503
- V7
- VGX-3100
- Vigil
第 11 章案例研究:世界預防性疫苗
- 分析總結
- 預防性疫苗:市場情況
- 商業疫苗的情況
- 疫苗情況:按臨床試驗階段
- 發展階段分析
- 給藥途徑分析
- 按疫苗 API 類型分析
- 劑型分析
- 目標疾病分析
- 行業領先企業:臨床開發中的疫苗數量分析
- 領先的非工業公司:臨床開發中的疫苗數量分析
第 12 章案例研究:疫苗合同製造市場
- 分析總結
- 疫苗合同製造商:市場整體情況
- 成立年份分析
- 按公司規模/地點分析
- 地區分析
- 按提供的服務類型分析
- 按經營規模分析
- 按使用的表達系統類型分析
- 按生產的疫苗類型分析
第13章結論
第14章附錄1:聚合數據
第15章附錄2:公司/組織名單
Title:
Global Therapeutic Vaccines
Market Distribution by Type of Vaccine (Antigen vaccine, DNA vaccine and Dendritic vaccine), Method of Vaccine Composition (Autologous vaccine and Allogeneic vaccine), Type of Therapy (Monotherapy and Combination Therapy), Target Disease Indication (Cervical Cancer, Ewing Sarcoma, Glioblastoma, HIV Infection, Ovarian cancer, Prostate Cancer, Tuberculosis, Others), Route of Administration (Intravenous, Intradermal, Subcutaneous, Oral and Others) and Key Geographical Regions (North America, Europe, Asia-Pacific, Middle East and North Africa and rest of the world): Industry Trends and Global Forecasts, 2022-2035.
Example Insights:
Overview
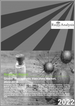
Unlike the prophylactic vaccines that are designed and administered as a precautionary measure to prevent the occurrence of a disease, researchers have developed therapeutic vaccines intended to alleviate the suffering of patients already infected with the disease. Therapeutic vaccines are not as efficacious as prophylactic vaccines; however, they demonstrate safety, specificity and a long-lasting response across various clinical conditions. These vaccines help the immune system in recognizing a foreign agent and are primarily being developed for viral infections and different types of cancer. Additionally, individuals who are affected with chronic infections but cannot produce enough efficient antibodies can be administered such vaccines. Currently, six therapeutic vaccines are commercially available, including Imlygic®, Provenge® and Tice® which have recently been approved for treatment of melanoma, prostate cancer and bladder cancer, respectively; in addition, over 350 vaccines are under development for various oncological, infectious, hepatological, neurological and autoimmune disorders.
Extensive research is being conducted to improve the overall stability of these therapeutic formulations and a variety of adjuvants (substances with an innate potential to augment an immune response) have been discovered for the development of more versatile vaccine formulations. Further, researchers are also investigating the potential of these vaccines against other chronic disease conditions, including hypertension and autoimmune disorders. Over the last few years, this segment of industry has witnessed substantial partnership activity and investment from various private and public sector investors / investment funds, which have extended financial support to the organizations engaged in R&D. Driven by encouraging clinical trial results, increasing adoption of therapeutic vaccines for treating various clinical conditions and investment in R&D, the therapeutic vaccines market is poised to witness noteworthy growth in the foreseen future.
Scope of the Report
The "Global Therapeutic Vaccines Market, 2022-2035" report features an extensive study on the current market landscape, offering an informed opinion on the likely evolution and future opportunities associated with the therapeutic vaccines market. The study underlines an in-depth analysis, highlighting the key drivers and the market trends related to this evolving segment of the pharmaceutical industry. Amongst other elements, the report includes:
- A detailed assessment of the current market landscape of therapeutic vaccines, based on several relevant parameters, such as phase of development (clinical and preclinical) of lead candidates, type of vaccine (antigen vaccine, dendritic vaccine, DNA vaccine and peptide vaccine) , type of vaccine by method of composition (autologous vaccine and allogeneic vaccine) , type of therapy (monotherapy and combination therapy), target disease indication and route of administration (intramuscular, intranasal, oral, intradermal, subcutaneous, intravenous and others) and dosing frequency. It also includes a list of players developing therapeutic vaccines along with information on their year of establishment, company size and location of headquarters.
- Elaborate profiles of key players engaged in the development of therapeutic vaccines, based across North America, Europe and Asia Pacific. Each profile features a brief overview of the company, its financial information (if available) , details on its clinical-stage vaccine candidates, recent developments and an informed future outlook.
- A detailed analysis of completed, ongoing and planned clinical trials of various therapeutic vaccines, based on important parameters, such as trial registration year, phase of development, trial recruitment status, study design, trial focus area, target disease indication(s), type of sponsor / collaborator, leading industry sponsors / collaborators (in terms of number of trials conducted), number of patients enrolled and regional distribution.
- An in-depth analysis of grants that have been awarded to various research institutes for research related to therapeutic vaccines, during the period, 2016-2022, on the basis of different parameters, such as year of grant award, amount awarded, administering institute center, support period, type of grant application, purpose of grant award, activity code, focus area, study section involved, type of recipient organization and focus area. In addition, it highlights the geographical distribution of recipient organizations, popular NIH departments, prominent program officers, and popular recipient organizations.
- An analysis of the partnerships that have been established in this domain since 2016, covering instances of product development and / or commercialization agreements, R&D collaborations, licensing agreements, mergers and acquisitions, clinical trial agreements, and other relevant deals.
- An analysis of the various start-ups engaged in the field of therapeutic vaccines, based on relevant parameters, such as number of candidates in discovery, preclinical and clinical phases of development, amount raised in different funding instances and number of partnerships established.
- A case study on preventive vaccines, along with information on marketed as well as clinical-stage candidates, based on parameters, such as phase of development, route of administration (intramuscular, subcutaneous, oral, intranasal, intradermal and others), type of vaccine API (live attenuated vaccine, inactivated vaccine, conjugate vaccine, subunit vaccine, toxoid vaccine and others), dosage form (ready to use liquid, lyophilized powder, nasal spray, capsule, and tablet) and target disease indication.
- A case study on contract manufacturing for vaccines, featuring a comprehensive list of active CMOs and analyses based on a number of parameters, such as year of establishment, company size, scale of operation (preclinical, clinical and commercial) , geographical location, number of vaccine manufacturing facilities, types of services offered (cell / virus banking, analytical development / testing, formulation, process development, fill / finish and regulatory filings), type of expression systems used for vaccine production (mammalian, microbial and others) and type of vaccine manufactured.
One of the key objectives of the report was to estimate the existing market size and future growth opportunity associated with therapeutic vaccines market in the mid to long term. Based on parameters, such as adoption rates and expected prices variations for these products, we have developed informed estimates on the likely evolution of the market for the period 2022-2035.
Our year-wise projections of the current and forecasted opportunity within the therapeutic vaccines market, have further been segmented across different types of vaccines (antigen vaccine, dendritic vaccine, DNA vaccine and peptide vaccine), types of vaccines by method of composition (autologous and allogeneic vaccine), types of therapies (monotherapy and combination), target disease indications, routes of administration (intramuscular, subcutaneous, oral, intranasal, intradermal and others) and key geographical regions (North America, Europe and Asia Pacific).
In order to account for future uncertainties and to add robustness to our model, we have provided three forecast scenarios, namely conservative, base and optimistic scenarios, representing different tracks of the industry's growth.
The opinions and insights presented in the report were influenced by discussions held with senior representatives in the industry. All actual figures have been sourced and analyzed from publicly available information forums and primary research discussions. Financial figures mentioned in this report are in USD, unless otherwise specified.
Key Questions Answered:
- Who are the leading industry players involved in developing therapeutic vaccines?
- What are the key therapeutic areas for which therapeutic vaccines are being / have been developed?
- What are the prevalent trends within competitive landscape of therapeutic vaccines?
- Which geographies are the most active in conducting clinical trials related to therapeutic vaccines?
- Which are the leading funding organizations providing grants for therapeutic vaccines?
- What kind of partnership models are commonly adopted by industry and non-industry stakeholders?
- What are the different initiatives undertaken by start-up players for the development of therapeutic vaccines in the recent past?
- How is the current and future market opportunity likely to be distributed across key market segments?
Chapter Outlines
Chapter 2 is an executive summary of the key insights captured during our research. It offers a high-level view on the current state of the therapeutic vaccines market and its likely evolution in the mid to long term.
Chapter 3 provides a general introduction to therapeutic vaccines, including information on their types, characterized by the method of composition and mechanism of action. Additionally, the chapter provides information on the various disease indications for which therapeutic vaccines are being investigated / developed. Further, the chapter features a brief overview of clinical development and approval processes for vaccines and the future perspectives.
Chapter 4 provides a detailed assessment of the current market landscape of over 300 therapeutic vaccines that are currently being evaluated across different stages of development. It features a comprehensive analysis of the pipeline molecules based on several relevant parameters, such as, phase of development (clinical and preclinical) , type of vaccine (antigen vaccine, dendritic vaccine, DNA vaccine, peptide vaccine), type of vaccine by method of composition (autologous vaccine, allogeneic vaccine), type of therapy (monotherapy and combination therapy), dosage (weekly, biweekly, monthly, bimonthly, triweekly), target disease indication, route of administration (intramuscular, intranasal, oral, intradermal, subcutaneous, intravenous and others) and dosage frequency.
Chapter 5 includes detailed profiles of key players engaged in the development of therapeutic vaccines, based across North America, Europe and Asia Pacific. Each profile features a brief overview of the company, its financial information (if available) , details on its clinical-stage vaccines candidates, recent developments and an informed future outlook.
Chapter 6 provides information on more than 790 completed, ongoing and planned clinical trials of therapeutic vaccines, based on different parameters, such as trial registration year, trial phase, trial recruitment status, study design, trial focus area, target disease indication(s), type of sponsor / collaborator, leading industry sponsors / collaborators (in terms of number of trials conducted), enrolled patients population and regional distribution.
Chapter 7 provides an in-depth analysis of more than 500 grants that have been awarded to various research institutes for research related to therapeutic vaccines, during the period, 2016-2022, on the basis of different parameters, such year of grant award, amount awarded, administering institute center, support period, type of grant application, purpose of grant award, activity code, focus area, study section involved, type of recipient organizations and focus area. In addition, it highlights the geographical distribution of recipient organizations, popular NIH departments, prominent program officers, and popular recipient organizations.
Chapter 8 provides a detailed analysis of the recent collaborations established since 2016. It includes analysis based on relevant parameters, such as year of agreement, type of agreement, therapeutic area, type of partner and regional distribution of partnerships.
Chapter 9 features an analysis of the various start-ups engaged in development of therapeutic vaccines, based on relevant parameters, such as number of candidates in discovery, preclinical and clinical phases of development, number of partnerships, number of patents, amount raised, number of investors, types of funding and number of deals inked.
Chapter 10 includes an analysis of the big pharma players engaged in the field of therapeutic vaccines, featuring different insightful representations, such as spider web analysis, Harvey ball analysis and wind rose chart, based on parameters, such as number of vaccines under development, type of vaccine, type of vaccine (by method of composition), type of therapy, number of therapeutic areas, number of partnerships, and years of experience.
Chapter 11 presents an insightful market forecast analysis, highlighting the likely growth of the therapeutic vaccines market, till 2035. In order to provide a detailed future outlook, our projections have been segmented across across different types of vaccines (antigen vaccine, dendritic vaccine, DNA vaccine and peptide vaccine), types of vaccines by method of composition (autologous vaccine and allogeneic vaccine), types of therapies (monotherapy and combination), target disease indications, routes of administration (intramuscular, subcutaneous, oral, intranasal, intradermal and others) and key geographical regions (North America, Europe and Asia Pacific).
Chapter 12 features a case study of preventive vaccines, along with information on marketed as well as clinical-stage candidates, based on parameters, such as phase of development, route of administration (intramuscular, subcutaneous, oral, intranasal, intradermal and others), type of vaccine API (live attenuated vaccine, inactivated vaccine, conjugate vaccine, subunit vaccine, toxoid vaccine and others), dosage form (ready to use liquid, lyophilized powder, nasal spray, capsule, and tablet) and target disease indication.
Chapter 13 presents a case study on contract manufacturing for vaccines, featuring a comprehensive list of active CMOs and analyses based on a number of parameters, such as year of establishment, company size, scale of operation (preclinical, clinical and commercial), geographical location, number of vaccine manufacturing facilities, types of services offered (cell / virus banking, analytical development / testing, formulation, process development, fill / finish and regulatory filings), type of expression systems used for vaccine production (mammalian, microbial and others) and type of vaccine manufactured.
Chapter 14 is a summary of the overall report, which presents insights on the contemporary market trends and the likely evolution of the therapeutics vaccines market.
Chapter 15 is an appendix that contains tabulated data and numbers for all the figures in the report.
Chapter 16 is an appendix that provides the list of companies and organizations mentioned in the report.
TABLE OF CONTENTS
1. PREFACE
- 1.1. Scope of the Report
- 1.2. Research Methodology
- 1.3. Key Questions Answered
- 1.4. Chapter Outlines
2. EXECUTIVE SUMMARY
3. INTRODUCTION
- 3.1. Chapter Overview
- 3.2. Introduction to Therapeutic Vaccines
- 3.2.1. Classification of Vaccines by Method of Composition
- 3.2.1.1. Autologous Vaccines
- 3.2.1.2. Allogeneic Vaccines
- 3.2.1. Classification of Vaccines by Method of Composition
- 3.3. Classification of Vaccines by Mechanism of Action
- 3.3.1. Antigen Vaccines
- 3.3.2. Dendritic Vaccines
- 3.3.3. DNA Vaccines
- 3.3.4. Peptide Vaccines
- 3.4 Key Target Indications
- 3.4.1. Cancer
- 3.4.2. HIV Infection
- 3.4.3. HPV Infection
- 3.4.4. Herpes
- 3.5. Clinical Development and Approval of Vaccines
- 3.6. Concluding Remarks
4. MARKET LANDSCAPE
- 4.1. Chapter Overview
- 4.2. Therapeutic Vaccines: Pipeline Analysis
- 4.2.1. Analysis by Phase of Development
- 4.2.2. Analysis by Type of Vaccine
- 4.2.3. Analysis by Type of Vaccine (by Method of Composition)
- 4.2.4. Analysis by Type of Therapy
- 4.2.5. Analysis by Target Disease Indication
- 4.2.6. Analysis by Route of Administration
- 4.2.7. Analysis by Dosage
- 4.3. Therapeutic Vaccines: Analysis by Vaccine Developers
- 4.3.1. Analysis by Year of Establishment
- 4.3.2. Analysis by Company Size
- 4.3.3. Analysis by Location of Headquarters
- 4.3.4. Leading Developers
- 4.3.5. Grid Analysis: Distribution by Phase of Development, Company Size and Location of Headquarters
5. COMPANY PROFILES
- 5.1. Chapter Overview
- 5.2. BioNTech
- 5.2.1. Company Overview
- 5.2.2. Financial Information
- 5.2.3. Therapeutic Vaccines Portfolio
- 5.2.4. Recent Developments and Future Outlook
- 5.3 Brii Biosciences
- 5.3.1. Company Overview
- 5.3.2. Financial Information
- 5.3.3. Therapeutic Vaccines Portfolio
- 5.3.4. Recent Developments and Future Outlook
- 5.4 GlobeImmune
- 5.4.1. Company Overview
- 5.4.2. Financial Information
- 5.4.3. Therapeutic Vaccines Portfolio
- 5.4.4. Recent Developments and Future Outlook
- 5.5 Immatics
- 5.5.1. Company Overview
- 5.5.2. Financial Information
- 5.5.3. Therapeutic Vaccines Portfolio
- 5.5.4. Recent Developments and Future Outlook
- 5.6. Immune Response Biopharma
- 5.6.1. Company Overview
- 5.6.2. Financial Information
- 5.6.3. Therapeutic Vaccines Portfolio
- 5.6.4. Recent Developments and Future Outlook
- 5.7. Immunitor
- 5.7.1. Company Overview
- 5.7.2. Financial Information
- 5.7.3. Therapeutic Vaccines Portfolio
- 5.7.4. Recent Developments and Future Outlook
- 5.8. Inovio Pharmaceuticals
- 5.8.1. Company Overview
- 5.8.2. Financial Information
- 5.8.3. Therapeutic Vaccines Portfolio
- 5.8.4. Recent Developments and Future Outlook
- 5.9. Moderna
- 5.9.1. Company Overview
- 5.9.2. Financial Information
- 5.9.3. Therapeutic Vaccines Portfolio
- 5.9.4. Recent Developments and Future Outlook
6. CLINICAL TRIAL ANALYSIS
- 6.1. Chapter Overview
- 6.2. Scope and Methodology
- 6.3. Therapeutic Vaccines: Clinical Trial Analysis
- 6.3.1. Analysis by Trial Registration Year
- 6.3.2. Analysis by Trial Registration Year and Enrolled Patient Population
- 6.3.3. Analysis by Trial Phase
- 6.3.4. Analysis by Trial Recruitment Status
- 6.3.5. Analysis by Study Design
- 6.3.6. Analysis by Trial Focus Area
- 6.3.7. Analysis by Target Disease Indication
- 6.3.8. Analysis by Type of Sponsor / Collaborator
- 6.3.9. Most Active Players: Analysis by Number of Registered Trials
- 6.3.10. Geographical Analysis by Number of Registered Trials
- 6.3.11. Geographical Analysis by Enrolled Patient Population
7. ACADEMIC GRANT ANALYSIS
- 7.1. Chapter Overview
- 7.2. Scope and Methodology
- 7.3. Therapeutic Vaccines: Academic Grant Analysis
- 7.3.1. Analysis by Year of Grant Award
- 7.3.2. Analysis by Amount Awarded
- 7.3.3. Analysis by Administering Institute Center
- 7.3.4. Analysis by Support Period
- 7.3.5. Analysis by Administering Institute Center and Support Period
- 7.3.6. Analysis by Type of Grant Application
- 7.3.7. Analysis by Purpose of Grant Award
- 7.3.8. Analysis by Activity Code
- 7.3.9. Analysis by Study Section Involved
- 7.3.10. Analysis by Type of Recipient Organization
- 7.3.11. Word Cloud Analysis: Emerging Focus Areas
- 7.3.12. Geographical Distribution of Recipient Organizations
- 7.3.13. Popular NIH Departments: Analysis by Number of Grants
- 7.3.14. Prominent Program Officers: Analysis by Number of Grants
- 7.3.15. Popular Recipient Organizations: Analysis by Number of Grants
8. PARTNERSHIPS AND COLLABORATIONS
- 8.1. Chapter Overview
- 8.2. Partnership Models
- 8.3. Therapeutic Vaccines: Partnerships and Collaborations
- 8.3.1. Analysis by Year of Partnership
- 8.3.2. Analysis by Type of Partnership
- 8.3.3. Analysis by Year of Partnership and Type of Partner
- 8.3.4. Analysis by Type of Partnership and Type of Partner
- 8.3.5. Analysis by Focus Area
- 8.3.6. Analysis by Therapeutic Area
- 8.3.7. Most Active Players: Analysis by Number of Partnerships
- 8.3.8. Regional Analysis
- 8.3.8.1. Intercontinental and Intracontinental Agreements
9. START-UP HEALTH INDEXING
- 9.1. Chapter Overview
- 9.2. Start-ups in Therapeutic Vaccines Market
- 9.2.1. Analysis by Location of Headquarters
- 9.3. Benchmarking of Start-ups
- 9.3.1. Analysis by Supplier Strength
- 9.3.2. Analysis by Pipeline Strength
- 9.3.3. Analysis by Pipeline Maturity
- 9.3.4. Analysis by Financial Investment
- 9.3.5. Analysis by Partnership Activity
- 9.3.6. Start-ups Health Indexing: Roots Analysis Perspective
10. MARKET FORECAST AND OPPORTUNITY ANALYSIS
- 10.1. Chapter Overview
- 10.2. Forecast Methodology and Key Assumptions
- 10.3. Global Therapeutic Vaccines Market, 2022-2035
- 10.4. Global Therapeutic Vaccines Market, 2022-2035: Distribution by Type of Vaccine
- 10.5. Global Therapeutic Vaccines Market, 2022-2035: Distribution by Method of Vaccine Composition
- 10.6. Global Therapeutic Vaccines Market, 2022-2035: Distribution by Type of Therapy
- 10.7. Global Therapeutic Vaccines Market, 2022-2035: Distribution by Target Disease Indication
- 10.8. Global Therapeutic Vaccines Market, 2022-2035: Distribution by Route of Administration
- 10.9. Global Therapeutic Vaccines Market, 2022-2035: Geographical Distribution
- 10.9.1. Therapeutic Vaccines Market in US, 2022-2035
- 10.9.2. Therapeutic Vaccines Market in Canada, 2022-2035
- 10.9.3. Therapeutic Vaccines Market in UK, 2022-2035
- 10.9.4. Therapeutic Vaccines Market in Germany, 2022-2035
- 10.9.5. Therapeutic Vaccines Market in France, 2022-2035
- 10.9.6. Therapeutic Vaccines Market in Italy, 2022-2035
- 10.9.7. Therapeutic Vaccines Market in Spain, 2022-2035
- 10.9.8. Therapeutic Vaccines Market in Australia, 2022-2035
- 10.9.9. Therapeutic Vaccines Market in Japan, 2022-2035
- 10.9.10. Therapeutic Vaccines Market in Korea, 2022-2035
- 10.9.11. Therapeutic Vaccines Market in Brazil, 2022-2035
- 10.9.12. Therapeutic Vaccines Market in Israel, 2022-2035
- 10.10. Global Therapeutic Vaccines Market, 2022-2035: Individual Product Sales Forecast
- 10.10.1. ASP0113
- 10.10.1.1. Target Patient Population
- 10.10.1.2. Sales Forecast
- 10.10.2. Copaxone
- 10.10.2.1. Target Patient Population
- 10.10.2.2. Sales Forecast
- 10.10.3. Galinpepimut-S
- 10.10.3.1. Target Patient Population
- 10.10.3.2. Sales Forecast
- 10.10.4. Hepcortespenlisimut-L
- 10.10.4.1. Target Patient Population
- 10.10.4.2. Sales Forecast
- 10.10.5. ICT-107
- 10.10.5.1. Target Patient Population
- 10.10.5.2. Sales Forecast
- 10.10.6. IR103
- 10.10.6.1. Target Patient Population
- 10.10.6.2. Sales Forecast
- 10.10.7. MGN1703
- 10.10.7.1. Target Patient Population
- 10.10.7.2. Sales Forecast
- 10.10.8. Neuronata-R
- 10.10.8.1. Target Patient Population
- 10.10.8.2. Sales Forecast
- 10.10.9. OncoVax
- 10.10.9.1. Target Patient Population
- 10.10.9.2. Sales Forecast
- 10.10.10. OSE2101
- 10.10.10.1. Target Patient Population
- 10.10.10.2. Sales Forecast
- 10.10.11. Provenge
- 10.10.11.1. Target Patient Population
- 10.10.11.2. Sales Forecast
- 10.10.12. REMUNE
- 10.10.12.1. Target Patient Population
- 10.10.12.2. Sales Forecast
- 10.10.13. RIAVAX
- 10.10.13.1. Target Patient Population
- 10.10.13.2. Sales Forecast
- 10.10.14. V503
- 10.10.14.1. Target Patient Population
- 10.10.14.2. Sales Forecast
- 10.10.15. V7
- 10.10.15.1. Target Patient Population
- 10.10.15.2. Sales Forecast
- 10.10.16. VGX-3100
- 10.10.16.1. Target Patient Population
- 10.10.16.2. Sales Forecast
- 10.10.17. Vigil
- 10.10.17.1. Target Patient Population
- 10.10.17.2. Sales Forecast
- 10.10.1. ASP0113
11. CASE STUDY: GLOBAL PREVENTIVE VACCINES
- 11.1. Chapter Overview
- 11.2. Preventive Vaccines: Overall Market Landscape
- 11.2.1. Marketed Vaccines Landscape
- 11.2.2. Clinical-Stage Vaccines Landscape
- 11.2.3. Analysis by Phase of Development
- 11.2.4. Analysis by Route of Administration
- 11.2.5. Analysis by Type of Vaccine API
- 11.2.6. Analysis by Dosage Form
- 11.2.7. Analysis by Target Disease Indication
- 11.2.8. Key Industry Players: Analysis by Number of Vaccines in Clinical Development
- 11.2.9. Key Non-Industry Players: Analysis by Number of Vaccines in Clinical Development
12. CASE STUDY: VACCINE CONTRACT MANUFACTURING MARKET
- 12.1 Chapter Overview
- 12.2. Vaccine Contract Manufacturers: Overall Market Landscape
- 12.2.1 Analysis by Year of Establishment
- 12.2.2. Analysis by Company Size and Geographical Location
- 12.2.3. Analysis by Geography
- 12.2.4. Analysis by Type of Service(s) Offered
- 12.2.5. Analysis by Scale of Operation
- 12.2.6. Analysis by Type of Expression System(s) Used
- 12.2.7. Analysis by Type of Vaccines Manufactured
13. CONCLUDING REMARKS
14. APPENDIX 1: TABULATED DATA
15. APPENDIX 2: LIST OF COMPANIES AND ORGANIZATIONS
List OfFigures
- Figure 3.1 Difference between Preventive Vaccines and Therapeutic Vaccines
- Figure 3.2 Different Routes of Vaccine Administration
- Figure 4.1 Therapeutic Vaccines: Distribution by Phase of Development
- Figure 4.2 Therapeutic Vaccines: Distribution by Type of Vaccine
- Figure 4.3 Therapeutic Vaccines: Distribution by Type of Vaccine (by Method of Composition)
- Figure 4.4 Therapeutic Vaccines: Distribution by Type of Therapy
- Figure 4.5 Therapeutic Vaccines: Distribution by Target Disease Indication
- Figure 4.6 Therapeutic Vaccines: Distribution by Route of Administration
- Figure 4.7 Therapeutic Vaccines: Distribution by Dosage
- Figure 4.8 Therapeutic Vaccines Developers: Distribution by Type of Developers
- Figure 4.9 Therapeutic Vaccines Developers: Distribution by Year of Establishment
- Figure 4.10 Therapeutic Vaccines Developers: Distribution by Company Size
- Figure 4.11 Therapeutic Vaccines Developers: Distribution by Location of Headquarters
- Figure 4.12 Leading Developers
- Figure 4.13 Grid Analysis: Distribution by Phase of Development, Company Size and Location of Headquarters
- Figure 5.1 BioNTech: Annual Revenues, 2016-2021 (USD Million)
- Figure 5.2 Brii Biosciences: Annual Revenues, 2016-2021 (USD Million)
- Figure 5.3 GlobeImmune: Annual Revenues, 2016-2021 (USD Million)
- Figure 5.4 Immatics: Annual Revenues, 2016-2021 (USD Million)
- Figure 5.5 Immune Response Biopharma: Annual Revenues, 2016-2021 (USD Million)
- Figure 5.6 Inovio Pharmaceuticals: Annual Revenues, 2016-2021 (USD Million)
- Figure 5.7 Moderna: Annual Revenues, 2016-2021 (USD Million)
- Figure 6.1 Clinical Trial Analysis: Scope and Methodology
- Figure 6.2 Clinical Trial Analysis: Cumulative Distribution by Trial Registration Year, Pre-2010-2022
- Figure 6.3 Clinical Trial Analysis: Distribution by Trial Registration Year and Enrolled Patient Population, Pre-2010-2022
- Figure 6.4 Clinical Trial Analysis: Distribution by Trial Phase
- Figure 6.5 Clinical Trial Analysis: Distribution by Trial Recruitment Status
- Figure 6.6 Clinical Trial Analysis: Cumulative Year-wise Trend by Trial Recruitment Status
- Figure 6.7 Clinical Trial Analysis: Distribution by Study Design
- Figure 6.8 Clinical Trial Analysis: Distribution by Trial Focus Area
- Figure 6.9 Clinical Trial Analysis: Distribution by Target Disease Indication
- Figure 6.10 Clinical Trial Analysis: Distribution by Type of Sponsor / Collaborator
- Figure 6.11 Most Active Players: Distribution by Number of Registered Trials
- Figure 6.12 Clinical Trial Analysis: Geographical Distribution by Number of Registered Trials
- Figure 6.13 Clinical Trial Analysis: Geographical Distribution by Enrolled Patient Population
- Figure 7.1 Grant Analysis: Cumulative Year-wise Trend, 2016-2022
- Figure 7.2 Grant Analysis: Cumulative Distribution by Amount Awarded (USD Million) 2016-2022
- Figure 7.3 Grant Analysis: Distribution by Administering Institute Center
- Figure 7.4 Grant Analysis: Distribution by Support Period
- Figure 7.5 Grant Analysis: Distribution by Administering Institute Center and Support Period
- Figure 7.6 Grant Analysis: Distribution by Type of Grant Application
- Figure 7.7 Grant Analysis: Distribution by Purpose of Grant Award
- Figure 7.8 Grant Analysis: Distribution by Activity Code
- Figure 7.9 Grant Analysis: Distribution by Study Section Involved
- Figure 7.10 Grant Analysis: Distribution by Type of Recipient Organization
- Figure 7.11 Word Cloud Analysis: Emerging Focus Areas
- Figure 7.12 Grant Analysis: Geographical Distribution of Recipient Organizations
- Figure 7.13 Popular NIH Departments: Distribution by Number of Grants
- Figure 7.14 Prominent Program Officers: Distribution by Number of Grants
- Figure 7.15 Popular Recipient Organizations: Distribution by Number of Grants
- Figure 8.1 Partnerships and Collaborations: Cumulative Year-wise Trend, 2016-2022
- Figure 8.2 Partnerships and Collaborations: Distribution by Type of Partnership
- Figure 8.3 Partnerships and Collaborations: Distribution by Type of Partnership and Therapeutic Area
- Figure 8.4 Partnerships and Collaborations: Distribution by Year of Partnership and Type of Partner
- Figure 8.5 Partnerships and Collaborations: Distribution by Type of Partnership and Type of Partner
- Figure 8.6 Partnerships and Collaborations: Distribution by Focus Areas
- Figure 8.7 Partnerships and Collaborations: Distribution by Therapeutic Area
- Figure 8.8 Most Active Players: Distribution by Number of Partnerships
- Figure 8.9 Partnerships and Collaborations: Regional Distribution
- Figure 8.9.1 Partnerships and Collaborations: Intercontinental and Intracontinental Agreements
- Figure 9.1 Startup-Health Indexing: Distribution by Location of Headquarters
- Figure 9.2 Startup-Health Indexing: Distribution by Supplier Strength
- Figure 9.3 Startup-Health Indexing: Distribution by Pipeline Strength
- Figure 9.4 Startup-Health Indexing: Distribution by Pipeline Maturity
- Figure 9.5 Startup-Health Indexing: Distribution by Financial Investment
- Figure 9.6 Startup-Health Indexing: Distribution by Partnership Activity
- Figure 9.7 Startup-Health Indexing: Roots Analysis Perspective
- Figure 9.8 Spider Web Analysis: Leading Companies
- Figure 10.1 Global Therapeutic Vaccines Market, 2022-2035 (USD Million)
- Figure 10.2 Global Therapeutic Vaccines Market: Distribution by Type of Vaccine, 2022-2035
- Figure 10.3 Global Therapeutic Vaccines Market: Distribution by Method of Vaccine Composition, 2022-2035
- Figure 10.4 Global Therapeutic Vaccines Market: Distribution by Type of Therapy, 2022-2035
- Figure 10.5 Global Therapeutic Vaccines Market: Distribution by Target Disease Indication, 2022-2035
- Figure 10.6 Global Therapeutic Vaccines Market: Distribution by Route of Administration, 2022-2035
- Figure 10.7 Therapeutic Vaccines Market in US, 2022-2035
- Figure 10.8 Therapeutic Vaccines Market in Canada, 2022-2035
- Figure 10.9 Therapeutic Vaccines Market in UK, 2022-2035
- Figure 10.10 Therapeutic Vaccines Market in Germany, 2022-2035
- Figure 10.11 Therapeutic Vaccines Market in France, 2022-2035
- Figure 10.12 Therapeutic Vaccines Market in Italy, 2022-2035
- Figure 10.13 Therapeutic Vaccines Market in Spain, 2022-2035
- Figure 10.14 Therapeutic Vaccines Market in Australia, 2022-2035
- Figure 10.15 Therapeutic Vaccines Market in Japan, 2022-2035
- Figure 10.16 Therapeutic Vaccines Market in Korea, 2022-2035
- Figure 10.17 Therapeutic Vaccines Market in Brazil, 2022-2035
- Figure 10.18 Therapeutic Vaccines Market in Israel, 2022-2035
- Figure 10.19 ASP0113 (Astellas Pharma): Estimated Sales, 2022-2035 (USD Million)
- Figure 10.20 Copaxone (Teva Pharmaceuticals): Estimated Sales, 2022-2035 (USD Million)
- Figure 10.21 Galinpeptimut-S (Sellas Life Sciences): Estimated Sales, 2024-2035 (USD Million)
- Figure 10.22 Hepcortespenlisimut-L (Immunitor): Estimated Sales, 2022-2035 (USD Million)
- Figure 10.23 ICT-107 (Precision Life Sciences): Estimated Sales, 2022-2035 (USD Million)
- Figure 10.24 IR103 (Immune Response Biopharma): Estimated Sales, 2022-2035 (USD Million)
- Figure 10.25 MGN1703 (Mologen): Estimated Sales, 2022-2035 (USD Million)
- Figure 10.26 Neuronata-R (OptiNose): Estimated Sales, 2027-2035 (USD Million)
- Figure 10.27 OncoVax (Corestem): Estimated Sales, 2023-2035 (USD Million)
- Figure 10.28 OSE2101 (OSE Immunotherapeutics): Estimated Sales, 2022-2035 (USD Million)
- Figure 10.29 Provenge (Dendreon Pharmaceuticals): Estimated Sales, 2022-2035 (USD Million)
- Figure 10.30 REMUNE (Immune Response Biopharma): Estimated Sales, 2022-2035 (USD Million)
- Figure 10.31 RIAVAX (Kael-GemVax): Estimated Sales, 2024-2035 (USD Million)
- Figure 10.32 V503 (Merck): Estimated Sales, 2027-2035 (USD Million)
- Figure 10.33 V7 (Immunitor): Estimated Sales, 2022-2035 (USD Million)
- Figure 10.34 VGX-3100 (Inovio Pharmaceuticals): Estimated Sales, 2023-2035 (USD Million)
- Figure 10.35 Vigil (Gradalis): Estimated Sales, 2025-2035 (USD Million)
- Figure 11.1 Clinical-Stage Preventive Vaccines: Distribution by Phase of Development
- Figure 11.2 Clinical-Stage Preventive Vaccines: Distribution by Route of Administration
- Figure 11.3 Clinical-Stage Preventive Vaccines: Distribution by Type of Vaccine API
- Figure 11.4 Clinical-Stage Preventive Vaccines: Distribution by Type of Vaccine API and Phase of Development
- Figure 11.5 Clinical-Stage Preventive Vaccines: Distribution by Dosage Form
- Figure 11.6 Clinical-Stage Preventive Vaccines: Distribution by Target Disease Indication
- Figure 11.7 Key Industry Players: Distribution by Number of Vaccines in Clinical Development
- Figure 11.8 Key Non-Industry Players: Distribution by Number of Vaccines in Clinical Development
- Figure 12.1 Vaccine CMOs: Distribution by Year of Establishment
- Figure 12.2 Vaccine CMOs: Distribution by Company Size and Geographical Location
- Figure 12.3 World Map Representation: Distribution by Geography
- Figure 12.4 Vaccine CMOs: Distribution by Types of Service(s) Offered
- Figure 12.5 Vaccine CMOs: Distribution by Additional Services Offered and Location of Headquarters
- Figure 12.6 Vaccine CMOs: Distribution by Scale of Operation
- Figure 12.7 Vaccine CMOs: Distribution by Type of Expression System(s) Used
- Figure 12.8 Vaccine CMOs: Distribution by Type of Vaccine Manufactured
- Figure 13.1 Concluding Remarks: Overall Market Landscape
- Figure 13.2 Concluding Remarks: Clinical Trial Analysis
- Figure 13.3 Concluding Remarks: Academic Grant Analysis
- Figure 13.4 Concluding Remarks: Partnerships and Collaborations
- Figure 13.5 Concluding Remarks: Start-up Health Indexing
- Figure 13.6 Concluding Remarks: Market Forecast
List OfTables
- Table 3.1 Vaccines for Cancer Treatment
- Table 3.2 Vaccines for HIV Treatment
- Table 3.3 Vaccines for HPV Treatment
- Table 3.4 Vaccines for Herpes Treatment
- Table 4.1 List of Therapeutic Vaccines
- Table 5.1 Global Therapeutic Vaccines: List of Companies Profiled
- Table 5.2 BioNTech: Company Snapshot
- Table 5.3 Vaccine Profile: BNT-111
- Table 5.4 Vaccine Profile: BNT-112
- Table 5.5 Vaccine Profile: BNT-113
- Table 5.6 Vaccine Profile: BNT-115
- Table 5.7 Vaccine Profile: BNT-116
- Table 5.8 Vaccine Profile: BNT-122
- Table 5.9 Vaccine Profile: W_pro1
- Table 5.10 Vaccine Profile: HPV Vaccine
- Table 5.11 Vaccine Profile: IVAC MUTANOME
- Table 5.12 Vaccine Profile: RBL001/RBL002
- Table 5.13 Vaccine Profile: NEO-PV-01
- Table 5.14 BioNTech: Recent Developments and Future Outlook
- Table 5.15 Brii Biosciences: Company Snapshot
- Table 5.16 Vaccine Profile: Bri-179
- Table 5.17 Vaccine Profile: Bri-835
- Table 5.18 Vaccine Profile: Bri-778
- Table 5.19 Vaccine Profile: Bri-732
- Table 5.20 Vaccine Profile: Bri-296
- Table 5.21 Brii Biosciences: Recent Developments and Future Outlook
- Table 5.22 GlobeImmune: Company Snapshot
- Table 5.23 Vaccine Profile: GI-6301
- Table 5.24 Vaccine Profile: GI-6207
- Table 5.25 Vaccine Profile: GI-4000
- Table 5.26 Vaccine Profile: GS-4774
- Table 5.27 Vaccine Profile: GI-5005
- Table 5.28 GlobeImmune: Recent Developments and Future Outlook
- Table 5.29 Immatics: Company Snapshot
- Table 5.30 Vaccine Profile: APVAC
- Table 5.31 Vaccine Profile: IMA901
- Table 5.32 Vaccine Profile: IMA910
- Table 5.33 Vaccine Profile: IMA950
- Table 5.34 Vaccine Profile: IMA970A
- Table 5.35 Immatics: Recent Developments and Future Outlook
- Table 5.36 Immune Response Biopharma: Company Snapshot
- Table 5.37 Vaccine Profile: IR103
- Table 5.38 Vaccine Profile: REMUNE
- Table 5.39 Vaccine Profile: NeuroVax
- Table 5.40 Vaccine Profile: RAVAX
- Table 5.41 Vaccine Profile: Zorcell
- Table 5.42 Immune Response Biopharma: Recent Developments and Future Outlook
- Table 5.43 Immunitor: Company Snapshot
- Table 5.44 Vaccine Profile: Atherosclerosis Vaccine
- Table 5.45 Vaccine Profile: V3-MOMMO
- Table 5.46 Vaccine Profile: Hepcortespenlisimut-L
- Table 5.47 Vaccine Profile: V-Boost
- Table 5.48 Vaccine Profile: V3-OVA
- Table 5.49 Vaccine Profile: V3-Myoma
- Table 5.50 Vaccine Profile: V3-Cervix
- Table 5.51 Vaccine Profile: V7
- Table 5.52 Vaccine Profile: V3-X
- Table 5.53 Vaccine Profile: V3-P
- Table 5.54 Vaccine Profile: V-Endo
- Table 5.55 Vaccine Profile: V8
- Table 5.56 Vaccine Profile: V-SARS
- Table 5.57 Immunitor: Recent Developments and Future Outlook
- Table 5.58 Innovio Pharmaceuticals: Company Snapshot
- Table 5.59 Vaccine Profile: VGX-3100
- Table 5.60 Vaccine Profile: INO-3107
- Table 5.61 Vaccine Profile: INO-5401
- Table 5.62 Vaccine Profile: INO-5151
- Table 5.63 Vaccine Profile: INO-3112
- Table 5.64 Vaccine Profile: INO-5150
- Table 5.65 Vaccine Profile: INO-3106
- Table 5.66 Vaccine Profile: INO-1800
- Table 5.67 Innovio Pharmaceuticals: Recent Developments and Future Outlook
- Table 5.68 Moderna: Company Snapshot
- Table 5.69 Vaccine Profile: mRNA-4157
- Table 5.70 Vaccine Profile: mRNA-3927
- Table 5.71 Vaccine Profile: mRNA-3705
- Table 5.72 Vaccine Profile: mRNA-3745
- Table 5.73 Vaccine Profile: mRNA-5671
- Table 5.74 Vaccine Profile: mRNA-2752
- Table 5.75 Moderna: Recent Developments and Future Outlook
- Table 8.1 Global Therapeutic Vaccines: List of Partnerships and Collaborations, 2016-2022
- Table 9.1 Therapeutic Vaccines Start-ups: Distribution by Location of Headquarters
- Table 10.1 Global Therapeutic Vaccines: Summary of the Competitive Insights
- Table 11.1 List of Marketed Preventive Vaccines
- Table 11.2 List of Clinical-Stage Preventive Vaccines
- Table 12.1 Vaccine Contract Manufacturers: List of Service Providers
- Table 12.2 Vaccine CMOs: Information on Type of Service(s) Offered
- Table 12.3 Vaccine CMOs: Information on Scale of Operation
- Table 12.4 Vaccine CMOs: Information on Type of Expression System(s) Used
- Table 12.5 Vaccine CMOs: Information on Type of Vaccines Manufactured
- Table 14.1 Therapeutic Vaccines: Distribution by Phase of Development
- Table 14.2 Therapeutic Vaccines: Distribution by Type of Vaccine
- Table 14.3 Therapeutic Vaccines: Distribution by Type of Vaccine (by Method of Composition)
- Table 14.4 Therapeutic Vaccines: Distribution by Type of Therapy
- Table 14.5 Therapeutic Vaccines: Distribution by Target Disease Indication
- Table 14.6 Therapeutic Vaccines: Distribution by Route of Administration
- Table 14.7 Therapeutic Vaccines: Distribution by Dosage
- Table 14.8 Therapeutic Vaccines Developers: Distribution by Type of Developers
- Table 14.9 Therapeutic Vaccines Developers: Distribution by Year of Establishment
- Table 14.10 Therapeutic Vaccines Developers: Distribution by Company Size
- Table 14.11 Therapeutic Vaccines Developers: Distribution by Location of Headquarters
- Table 14.12 Leading Developers
- Table 14.13 Grid Analysis: Distribution by Phase of Development, Company Size and Location of Headquarters
- Table 14.14 BioNTech: Annual Revenues, 2016-2021 (USD Million)
- Table 14.15 Brii Biosciences: Annual Revenues, 2016-2021 (USD Million)
- Table 14.16 GlobeImmune: Annual Revenues, 2016-2021 (USD Million)
- Table 14.17 Immatics: Annual Revenues, 2016-2021 (USD Million)
- Table 14.18 Immune Response Biopharma: Annual Revenues, 2016-2021 (USD Million)
- Table 14.19 Inovio Pharmaceuticals: Annual Revenues, 2016-2021 (USD Million)
- Table 14.20 Moderna: Annual Revenues, 2016-2021 (USD Million)
- Table 14.21 Clinical Trial Analysis: Scope and Methodology
- Table 14.22 Clinical Trial Analysis: Cumulative Distribution by Trial Registration Year, Pre-2010-2022
- Table 14.23 Clinical Trial Analysis: Distribution by Trial Registration Year and Enrolled Patient Population, Pre-2010-2022
- Table 14.24 Clinical Trial Analysis: Distribution by Trial Phase
- Table 14.25 Clinical Trial Analysis: Distribution by Trial Recruitment Status
- Table 14.26 Clinical Trial Analysis: Cumulative Year-wise Trend by Trial Recruitment Status
- Table 14.27 Clinical Trial Analysis: Distribution by Study Design
- Table 14.28 Clinical Trial Analysis: Distribution by Trial Focus Area
- Table 14.29 Clinical Trial Analysis: Distribution by Target Disease Indication
- Table 14.30 Clinical Trial Analysis: Distribution by Type of Sponsor / Collaborator
- Table 14.31 Most Active Players: Distribution by Number of Registered Trials
- Table 14.32 Clinical Trial Analysis: Geographical Distribution by Number of Registered Trials
- Table 14.33 Clinical Trial Analysis: Geographical Distribution by Enrolled Patient Population
- Table 14.34 Grant Analysis: Cumulative Year-wise Trend, 2016-2022
- Table 14.35 Grant Analysis: Cumulative Distribution by Amount Awarded (USD Million) 2016-2022
- Table 14.36 Grant Analysis: Distribution by Administering Institute Center
- Table 14.37 Grant Analysis: Distribution by Support Period
- Table 14.38 Grant Analysis: Distribution by Administering Institute Center and Support Period
- Table 14.39 Grant Analysis: Distribution by Type of Grant Application
- Table 14.40 Grant Analysis: Distribution by Purpose of Grant Award
- Table 14.41 Grant Analysis: Distribution by Activity Code
- Table 14.42 Grant Analysis: Distribution by Study Section Involved
- Table 14.43 Grant Analysis: Distribution by Type of Recipient Organization
- Table 14.44 Grant Analysis: Geographical Distribution of Recipient Organizations
- Table 14.45 Popular NIH Departments: Distribution by Number of Grants
- Table 14.46 Prominent Program Officers: Distribution by Number of Grants
- Table 14.47 Popular Recipient Organizations: Distribution by Number of Grants
- Table 14.48 Partnerships and Collaborations: Cumulative Year-wise Trend, 2016-2022
- Table 14.49 Partnerships and Collaborations: Distribution by Type of Partnership
- Table 14.50 Partnerships and Collaborations: Distribution by Type of Partnership and Therapeutic Area
- Table 14.51 Partnerships and Collaborations: Distribution by Year of Partnership and Type of Partner
- Table 14.52 Partnerships and Collaborations: Distribution by Type of Partnership and Type of Partner
- Table 14.53 Partnerships and Collaborations: Distribution by Therapeutic Area
- Table 14.54 Most Active Players: Distribution by Number of Partnerships
- Table 14.55 Partnerships and Collaborations: Regional Distribution
- Table 14.56 Startup-Health Indexing: Distribution by Location of Headquarters
- Table 14.57 Startup-Health Indexing: Distribution by Supplier Strength
- Table 14.58 Startup-Health Indexing: Distribution by Pipeline Strength
- Table 14.59 Startup-Health Indexing: Distribution by Pipeline Maturity
- Table 14.60 Startup-Health Indexing: Distribution by Financial Investment
- Table 14.61 Startup-Health Indexing: Distribution by Partnership Activity
- Table 14.62 Startup-Health Indexing: Roots Analysis Perspective
- Table 14.63 Global Therapeutic Vaccines Market, 2022-2035 (USD Million)
- Table 14.64 Global Therapeutic Vaccines Market: Distribution by Type of Vaccine, 2022-2035
- Table 14.65 Global Therapeutic Vaccines Market: Distribution by Method of Vaccine Composition, 2022-2035
- Table 14.66 Global Therapeutic Vaccines Market: Distribution by Type of Therapy, 2022-2035
- Table 14.67 Global Therapeutic Vaccines Market: Distribution by Target Disease Indication, 2022-2035
- Table 14.68 Global Therapeutic Vaccines Market: Distribution by Route of Administration, 2022-2035
- Table 14.69 Therapeutic Vaccines Market in US, 2022-2035
- Table 14.70 Therapeutic Vaccines Market in Canada, 2022-2035
- Table 14.71 Therapeutic Vaccines Market in UK, 2022-2035
- Table 14.72 Therapeutic Vaccines Market in Germany, 2022-2035
- Table 14.73 Therapeutic Vaccines Market in France, 2022-2035
- Table 14.74 Therapeutic Vaccines Market in Italy, 2022-2035
- Table 14.75 Therapeutic Vaccines Market in Spain, 2022-2035
- Table 14.76 Therapeutic Vaccines Market in Australia, 2022-2035
- Table 14.77 Therapeutic Vaccines Market in Japan, 2022-2035
- Table 14.78 Therapeutic Vaccines Market in Korea, 2022-2035
- Table 14.79 Therapeutic Vaccines Market in Brazil, 2022-2035
- Table 14.80 Therapeutic Vaccines Market in Israel, 2022-2035
- Table 14.81 ASP0113 (Astellas Pharma): Estimated Sales, 2022-2035 (USD Million)
- Table 14.82 Copaxone (Teva Pharmaceuticals): Estimated Sales, 2022-2035 (USD Million)
- Table 14.83 Galinpeptimut-S (Sellas Life Sciences): Estimated Sales, 2024-2035 (USD Million)
- Table 14.84 Hepcortespenlisimut-L (Immunitor): Estimated Sales, 2022-2035 (USD Million)
- Table 14.85 ICT-107 (Precision Life Sciences): Estimated Sales, 2022-2035 (USD Million)
- Table 14.86 IR103 (Immune Response Biopharma): Estimated Sales, 2022-2035 (USD Million)
- Table 14.87 MGN1703 (Mologen): Estimated Sales, 2022-2035 (USD Million)
- Table 14.88 Neuronata-R (OptiNose): Estimated Sales, 2027-2035 (USD Million)
- Table 14.89 OncoVax (Corestem): Estimated Sales, 2023-2035 (USD Million)
- Table 14.90 OSE2101 (OSE Immunotherapeutics): Estimated Sales, 2022-2035 (USD Million)
- Table 14.91 Provenge (Dendreon Pharmaceuticals): Estimated Sales, 2022-2035 (USD Million)
- Table 14.92 REMUNE (Immune Response Biopharma): Estimated Sales, 2022-2035 (USD Million)
- Table 14.93 RIAVAX (Kael-GemVax): Estimated Sales, 2024-2035 (USD Million)
- Table 14.94 V503 (Merck): Estimated Sales, 2027-2035 (USD Million)
- Table 14.95 V7 (Immunitor): Estimated Sales, 2022-2035 (USD Million)
- Table 14.96 VGX-3100 (Inovio Pharmaceuticals): Estimated Sales, 2023-2035 (USD Million)
- Table 14.97 Vigil (Gradalis): Estimated Sales, 2025-2035 (USD Million)
- Table 14.98 Clinical-Stage Preventive Vaccines: Distribution by Phase of Development
- Table 14.99 Clinical-Stage Preventive Vaccines: Distribution by Route of Administration
- Table 14.100 Clinical-Stage Preventive Vaccines: Distribution by Type of Vaccine API
- Table 14.101 Clinical-Stage Preventive Vaccines: Distribution by Type of Vaccine API and Phase of Development
- Table 14.102 Clinical-Stage Preventive Vaccines: Distribution by Dosage Form
- Table 14.103 Clinical-Stage Preventive Vaccines: Distribution by Target Disease Indication
- Table 14.104 Key Industry Players: Distribution by Number of Vaccines in Clinical Development
- Table 14.105 Key Non-Industry Players: Distribution by Number of Vaccines in Clinical Development
- Table 14.106 Vaccine CMOs: Distribution by Year of Establishment
- Table 14.107 Vaccine CMOs: Distribution by Company Size and Geographical Location
- Table 14.108 Vaccine CMOs: Distribution by Types of Service(s) Offered
- Table 14.109 Vaccine CMOs: Distribution by Additional Services Offered and Location of Headquarters
- Table 14.110 Vaccine CMOs: Distribution by Scale of Operation
- Table 14.111 Vaccine CMOs: Distribution by Type of Expression System(s) Used
- Table 14.112 Vaccine CMOs: Distribution by Type of Vaccine Manufactured
List OfCompanies
The following companies and organizations have been mentioned in the report:
- 1. 3D Medicines
- 2. Abivax
- 3. AC Immune
- 4. Adaptive Biotechnologies
- 5. Aduro Biotech
- 6. Advaxis
- 7. AFFiRiS
- 8. Altimmune
- 9. ApolloBio
- 10. Arbutus Biopharma
- 11. Archivel Farma
- 12. Argos Therapeutics
- 13. Astellas Pharma
- 14. Aston Sci.
- 15. AstraZeneca
- 16. AVAX Technologies
- 17. Axon Neuroscience
- 18. Bavarian Nordic
- 19. Beijing Genomics Institute
- 20. Bellicum Pharmaceuticals
- 21. Bionor Immuno
- 22. BioNTech
- 23. Biosantech
- 24. Brii Biosciences
- 25. Bristol Myers Squibb
- 26. Cancer Insight
- 27. Cancer Vaccines
- 28. Chinook Therapeutics
- 29. Chongqing Jiachen Biotechnology
- 30. Corestem
- 31. CuraVac
- 32. Cure&Sure Biotech
- 33. CureVac
- 34. CYTLIMIC
- 35. Dana-Farber Cancer Institute
- 36. DCPrime
- 37. Dendreon Pharmaceuticals
- 38. Dynavax Technologies
- 39. EMD Serono
- 40. Enterome
- 41. Epimmune
- 42. eTheRNA immunotherapies
- 43. European Oncology Clinical Trial Group
- 44. European Network of Gynaecological Oncological Trial Groups (ENGOT)
- 45. FIT Biotech
- 46. Frame Therapeutics
- 47. Frontier Biotechnologies
- 48. Galena Biopharma
- 49. GeneCure Biotechnologies
- 50. Genentech
- 51. Geneos Therapeutics
- 52. Genexine
- 53. Genocea Biosciences
- 54. Genticel
- 55. Gilead Sciences
- 56. GlaxoSmithKline
- 57. GlobeImmune
- 58. Gradalis
- 59. Gritstone bio
- 60. Hangzhou Neoantigen Therapeutics
- 61. Helocyte
- 62. Ichor Medical Systems
- 63. Immatics Biotechnologies
- 64. Immune Design
- 65. Immune Response BioPharma
- 66. Immunicum
- 67. Immunitor
- 68. ImmunityBio
- 69. ImmunoCellular Therapeutics
- 70. Immunomic Therapeutics
- 71. Immunor
- 72. ImmunoVaccine Technologies
- 73. Immunovative Therapies
- 74. ImmusanT
- 75. Immutep
- 76. Incyte
- 77. InnaVirVax
- 78. Inovio Pharmaceuticals
- 79. Invectys
- 80. iOncologi
- 81. ISA Pharmaceuticals
- 82. Janssen Pharmaceuticals (a subsidiary of Johnson & Johnson)
- 83. Janssen Vaccines & Prevention (a subsidiary of Johnson & Johnson)
- 84. GemVax & KAEL
- 85. Kun Tuo
- 86. Laboratorios Silanes
- 87. LG Life Sciences
- 88. Eli Lilly
- 89. MabVax Therapeutics
- 90. Madison Vaccines
- 91. Marker Therapeutics
- 92. Medigene
- 93. MedImmune
- 94. Memorial Sloan Kettering Cancer Center
- 95. Merck
- 96. Ministry of Health and Family Welfare (MoHFW)
- 97. Moderna
- 98. MOLOGEN
- 99. Morphogenesis
- 100. Mymetics
- 101. NantBioScience (a subsidiary of NantWorks)
- 102. National Heart, Lung, and Blood Institute (NHLBI)
- 103. NEC OncoImmunity
- 104. Nektar Therapeutics
- 105. NewLink Genetics
- 106. Nobelpharma
- 107. Nordic Society of Gynaecological Oncology (NSGO)
- 108. Nouscom
- 109. Novartis Pharmaceuticals
- 110. NovaRx
- 111. NuGenerex Immuno-Oncology
- 112. Nykode Therapeutics
- 113. OncBioMune Pharmaceuticals
- 114. OncoPep
- 115. OncoTherapy Science
- 116. Origimm Biotechnology (acquired by Sanofi)
- 117. OSE Immunotherapeutics
- 118. Oxford Vacmedix
- 119. PapiVax Biotech
- 120. Parker Institute for Cancer Immunotherapy
- 121. PCI Biotech
- 122. PDC*line Pharma
- 123. Peptinov
- 124. Pfizer
- 125. Precision BioSciences
- 126. Precision Life Sciences
- 127. Profectus BioSciences
- 128. QIAGEN
- 129. Quantoom Biosciences
- 130. Regeneron Pharmaceuticals
- 131. ReiThera
- 132. Replicate Bioscience
- 133. RhoVac
- 134. Rigontec (acquired by Merck)
- 135. ROVI Pharmaceuticals
- 136. Sanofi
- 137. SciVac Therapeutics
- 138. Selecta Biosciences
- 139. SELLAS Life Sciences
- 140. Shenzhen BioScien Pharmaceuticals
- 141. Stemirna Therapeutics
- 142. Stemline Therapeutics
- 143. Teva Pharmaceuticals
- 144. Themis Medicare
- 145. Thyas
- 146. Translate Bio (acquired by Sanofi)
- 147. UConn Health
- 148. Ultimovacs
- 149. University of Oxford
- 150. University of Pennsylvania
- 151. Vaccinogen
- 152. Vaccitech
- 153. VaxEquity
- 154. VAXIMM
- 155. Vaxine
- 156. VAXON Biotech
- 157. VBI Vaccines
- 158. Vertex
- 159. Vical
- 160. ViciniVax
- 161. Wistar Institute
- 162. XEME Biopharma


