


 |
市場調查報告書
商品編碼
1444456
全球有機過氧化物市場:市場佔有率分析、產業趨勢/統計、成長預測(2024-2029)Organic Peroxide - Market Share Analysis, Industry Trends & Statistics, Growth Forecasts (2024 - 2029) |
||||||
※ 本網頁內容可能與最新版本有所差異。詳細情況請與我們聯繫。
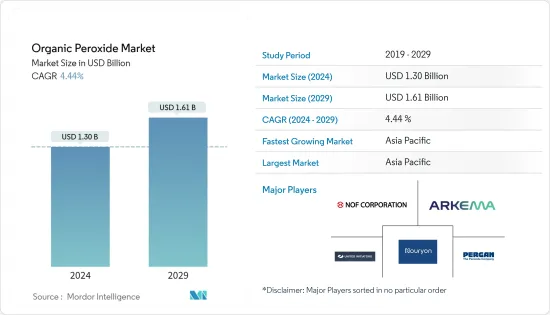
預計2024年全球有機過氧化物市場規模將達到13億美元,2024-2029年預測期間年複合成長率為4.44%,到2029年將達到16.1億美元。
2020 年,有機過氧化物市場受到 COVID-19 大流行的阻礙。國家封鎖、社交距離措施和全球供應鏈網路的中斷已經關閉了大多數工廠和工業,影響了有機過氧化物的供應需求。塑膠相關材料的下降、紙張和紙漿產品的下降影響了有機過氧化物的市場需求。然而,各行業的需求將在 2021 年恢復,並預計在預測期內大幅成長。
主要亮點
- 短期內,各個最終用戶產業對聚合物的需求不斷增加以及塗料應用中聚合物的利用率激增是推動所研究市場成長的關鍵因素。
- 有機過氧化物的儲存、運輸和處理方面的困難預計將阻礙市場的成長。
- 對輕質材料不斷成長的需求可能會在未來幾年創造市場機會。
- 預計亞太地區將主導市場,並且在預測期內也可能呈現最高的年複合成長率。
有機過氧化物市場趨勢
聚合物橡膠主導市場
- 有機過氧化物在塑膠、固化劑、合成橡膠、熱塑性塑膠交聯劑的生產以及聚合物的合成和改性中用作引發劑。
- 有機過氧化物在飽和和不飽和橡膠中用作交聯劑。過氧化物在聚合物鏈上分解,釋放自由基。過氧化物自由基與相鄰的聚合物鏈一起形成碳-碳鍵。過氧化物交聯聚合物/合成橡膠具有更高的機械和物理品質以及優異的耐溫度、氧化、老化和應力裂紋腐蝕能力。它還具有更明亮的顏色,並且在與金屬或聚氯乙烯(PVC) 接觸時不易變色。
- 聚合物,特別是聚丙烯,使用有機過氧化物組合物產生的自由基改性。改質聚合物在成型作業中流動更順暢,更容易製造食品和化妝品瓶蓋等產品。英國是歐盟第五大塑膠消費量。
- 根據馬來西亞橡膠理事會的數據,2021 年前 9 個月全球橡膠產量增加 8.9%,達到 2,160 萬噸,而 2020 年同期為 1,980 萬噸。生產的天然橡膠(NR)和合成橡膠(SR)的比例為46:54。
- 根據國際橡膠研究組織(IRSG)的數據,2021年全球天然橡膠產量為1,377萬噸,較2020年的1,306.5萬噸成長5.4%。根據天然橡膠生產國協會(ANRPC)統計,2021年泰國、印尼、越南、象牙海岸共和國、中國和印度等主要生產國的天然橡膠產量增加。然而,與2020年相比,馬來西亞的產量有所下降。
- 此外,2021年上半年出口成長13%,進口成長41%。這一趨勢可能有利於橡膠產品的需求,從而促進橡膠硬化劑的消費並推動所研究市場的需求。
- 台塑公司位於路易斯安那州巴吞魯日的513,000噸/年工廠正在進行聚氯乙烯(PVC)擴建計劃,預計到年終年底將增產130,077噸/年,併計劃開始運作。 2021 年,該公司宣布投資 3.32 億美元,擴大巴吞魯日工廠的聚氯乙烯(PVC) 生產。由於 COVID-19 爆發,該公司將 PVC 擴建推遲至 2022 年第四季。
- 因此,所有上述因素都可能促進聚合物的使用,並導致聚合應用中有機過氧化物的消費量顯著增加,從而推動所研究市場的成長。
亞太地區主導市場
- 亞太地區主導全球市場佔有率,其中中國主導市場。
- 中國是全球最大的塑膠生產國,擁有15,000多家塑膠生產企業,約佔全球塑膠產量的30%。 2020年我國初級塑膠產量約10,542萬噸,較2019年的9,743萬噸增加8.2%。 2021年,全國初級塑膠產量約1,1,039萬噸,與前一年同期比較增加4.7%。
- 根據中國橡膠工業協會統計,2021年1月至8月,中國共進口合成橡膠總合,較2020年同期成長10%。 2021年前8個月,中國合成橡膠出口量約775噸。合成橡膠190千噸,較2020年同期成長89%。
- 2020年中國合成橡膠產量增加0.99%至7,513.2千噸,而2019年為7,439.6千噸。 2021年,我國合成橡膠產量8,117萬噸,較2020年成長9.1%。根據中國橡膠工業協會統計,2021年1月至8月,中國共進口合成橡膠總合,較2020年同期成長10%。合成橡膠產量約190噸,較2020年同期成長89%。
- 根據中國國家統計局數據,2020年全國輪胎產量8,0747萬條,低於2019年的8,4445萬條。 2021年1-8月全國輪胎產量59,604萬條,年增22.1%。國內合成橡膠產量的增加預計將推動聚合物加工中使用的有機過氧化物市場。
- 2021年,我國合成橡膠產量8,117萬噸,較2020年成長9.1%。根據中國橡膠工業協會統計,2021年1月至8月,中國總合進口合成橡膠775萬噸。 2021年前8個月,中國合成橡膠出口量約190萬噸,較2020年同期成長89%。
- 印度是僅次於中國的亞太地區最大的橡膠生產國和消費國之一。儘管是最大的橡膠生產國之一,該國仍從各國進口很大一部分橡膠以滿足當地需求。印度約有 6,000 個製造單位,其中大型製造單位 30 個,中型製造單位 300 個,小型微型產業製造單位約 5,600 個。所有這些部門在該國生產超過 35,000 種橡膠產品。
- 印度在 2020-2021 會計年度生產了約 12,143.62 千噸聚合物(PVC、PP 和 PE 等 5 種基本塑膠),比 2019-20 會計年度的 12,403.69 千噸下降了 2.1%。截至2021年10月,該國2021-2022會計年度聚合物產量為7,075.30千噸,與前一年同期比較增加4.01%。 2020-21年功能塑膠產量下降9.1%至1,519.57千噸。產量將在2021-2022年恢復,到2021-2022年10月該國產量為918.7千噸,成長14.6%。
- 在印度,生產的橡膠 65% 以上用於製造汽車 (50%) 和自行車輪胎和內胎 (15%),12% 用於鞋類,6% 用於皮帶和軟管,17% 用於其他產品。它一直。此外,全國約有66家輪胎生產工廠和41家輪胎生產公司,銷售額約85億美元,出口額約12.8億美元。
- 由於上述所有因素,預計亞太地區將在未來幾年佔據市場主導地位。
有機過氧化物產業概況
有機過氧化物市場本質上是部分整合的。市場主要參與者包括(排名不分先後)諾力昂(Nouryon)、阿科瑪集團(Arkema Group)、United Initiators、NOF Corporation、Pergan GmbH等。
其他福利
- Excel 格式的市場預測 (ME) 表
- 3 個月分析師支持
目錄
第1章簡介
- 調查先決條件
- 調查範圍
第2章調查方法
第3章執行摘要
第4章市場動態
- 促進因素
- 各個最終用戶產業對聚合物的需求不斷增加
- 塗料應用的使用量迅速增加
- 抑制因素
- 儲存、運輸和處理有機過氧化物的困難
- 產業價值鏈分析
- 波特五力分析
- 供應商的議價能力
- 買方議價能力
- 新進入者的威脅
- 替代產品和服務的威脅
- 競爭程度
第5章市場區隔:市場規模(以金額為準)
- 類型
- 過氧化二醯基
- 過氧化酮
- 過碳酸鹽
- 過氧化苯甲醯
- 二烷基過氧化物
- 氫過氧化物
- 過氧酯
- 其他類型
- 目的
- 聚合物/橡膠
- 塗料/黏劑
- 紙張/纖維
- 化妝品
- 衛生保健
- 其他用途
- 地區
- 亞太地區
- 中國
- 印度
- 日本
- 韓國
- 其他亞太地區
- 北美洲
- 美國
- 加拿大
- 墨西哥
- 歐洲
- 德國
- 英國
- 義大利
- 法國
- 西班牙
- 歐洲其他地區
- 南美洲
- 巴西
- 阿根廷
- 南美洲其他地區
- 中東/非洲
- 沙烏地阿拉伯
- 南非
- 其他中東/非洲
- 亞太地區
第6章 競爭形勢
- 合併、收購、合資、合作和協議
- 市場排名分析
- 主要企業採取的策略
- 公司簡介
- ACE CHEMICAL CORP.
- AKPA KIMYA
- Arkema Group
- Chinasun Specialty Products Co. Ltd
- Kawaguchi Chemical Co. Ltd
- Lianyungang Hualun Chemical Co. Ltd
- MPI Chemie BV
- NOF CORPORATION
- Nouryon
- Novichem Spzoo
- PERGAN GmbH
- Plasti Pigments Pvt. Ltd
- United Initiators
第7章市場機會與未來趨勢
The Organic Peroxide Market size is estimated at USD 1.30 billion in 2024, and is expected to reach USD 1.61 billion by 2029, growing at a CAGR of 4.44% during the forecast period (2024-2029).
The organic peroxide market is hampered by the COVID-19 pandemic in 2020. Due to nationwide lockdowns, social distancing measures, and disruption in the global supply chain network, most of the factories and industries were shut down, which affected the supply-demand of plastic-related materials and witnessed a decline in pulp and paper products which in turn affected the market demand for organic peroxide. However, the demand from various industries recovered in 2021 and is expected to grow significantly during the forecast period.
Key Highlights
- Over the short term, increasing demand for polymers from various end-user Industries and surging utilization in coating applications are major factors driving the growth of the market studied.
- Difficulty in the storage, transport and handling of organic peroxides is expected to hinder the market's growth.
- Growing demand for lightweight materials will likely create opportunities for the market in the coming years.
- The Asia-Pacific region is expected to dominate the market and is also likely to witness the highest CAGR during the forecast period.
Organic Peroxides Market Trends
Polymers and Rubbers to Dominate the Market
- Organic peroxides are used as an initiator in plastics manufacturing, curing agents, elastomers, thermoplastics cross-linking agents, and synthesis and modification of polymers.
- Organic peroxides are used as cross-linking agents for saturated and unsaturated rubbers. On the polymer chain, the peroxide decomposes, releasing a free radical. With neighboring polymer chains, the peroxide radical forms a carbon-carbon bond. Peroxidic cross-linked polymers/elastomers offer higher mechanical and physical qualities and better resistance to temperature, oxidation, aging, and stress crack corrosion. They also have a brighter color and are less susceptible to discoloration when in contact with metals or polyvinyl chloride (PVC).
- Polymers, specifically polypropylene, are modified using free radicals produced by organic peroxide compositions. The modified polymer flows more smoothly in molding operations, making items like caps for food and cosmetic jars easier to create.rope, the United Kingdom is the fifth-largest consumer of plastics in the European Union.
- According to the Malaysian Rubber Council, the global production of rubber climbed by 8.9% to 21.6 million metric tons in the first nine months of 2021, compared to 19.8 million tonnes in the same period of 2020. For the first nine months of 2021, the ratio of natural rubber (NR) to synthetic rubber (SR) produced was 46:54.
- According to the International Rubber Study Group (IRSG), world natural rubber production accounted for 13.770 million tonnes in 2021, registering a growth rate of 5.4%, compared to 13.065 million tonnes produced in 2020. As per Association of Natural Rubber producing Countries (ANRPC), during 2021, natural rubber production in main producing countries such asThailand, Indonesia, Vietnam, Cote d'Ivoire, China and India increased. However, production in Malaysia decreased when compared to 2020.
- Moreover, the exports for the first half of 2021 increased by 13% and imports by 41%. This trend is likely to benefit the demand for rubber products, thereby, driving the rubber curing agents consumption, which is likely to propel the demand for the market studied.
- Formosa Plastics Corporation has a Polyvinyl chloride (PVC) expansion project underway at its 513,000 mt/year unit in Baton Rouge, Louisiana, which will add another 130,077 mt/year in output that is slated to come online by the end of 2021. In July 2021, the company announced its investment of USD 332 million to expand the production of polyvinyl chloride (PVC) at its Baton Rouge site. Due to the COVID-19 outbreak, the company has delayed its PVC expansion to Q4 2022.
- Therefore, all the factors mentioned above are likely to enhance polymers' usage, leading to a significant increase in the consumption of organic peroxides for polymerization applications, augmenting the growth of the market studied.
Asia-Pacific Region to Dominate the Market
- The Asia-Pacific region dominated the global market share, with China dominating the market.
- China is the largest producer of plastics in the world, with over 15,000 plastic manufacturers, and has around 30% share in global plastic production. The country produced around 105.42 million tons of primary-form plastics in 2020, which increased by 8.2% compared to 97.43 million tons in 2019. In 2021, the country produced around 110.39 million tons of primary-form plastics which increased by 4.7% compared to the previous year.
- According to China Rubber Industry Association, China imported a total of 775-kilo metric tons of synthetic rubber from January to August 2021, which increased by 10% compared to the same period in 2020. In the first eight months of 2021, China exported around 190-kilo metric tons of synthetic rubber, which increased by 89% compared to the same period in 2020.
- The synthetic rubber production in the country increased by 0.99% to 7,513.2 kilo metric tons in 2020 compared to 7,439.6 kilos metric tons produced in 2019. In 2021, China produced 8,117-kilo metric tons of synthetic rubber, which increased by 9.1% compared to 2020. According to China Rubber Industry Association, China imported a total of 775-kilo metric tons of synthetic rubber from January to August 2021, which increased by 10% compared to the same period in 2020. In the first eight months of 2021, China exported around 190-kilo metric tons of synthetic rubber, which increased by 89% compared to the same period in 2020.
- According to the National Bureau of Statistics China, the country produced 807.47 million units of tires in 2020 which declined from 844.45 million units produced in 2019. From January to August 2021, the country produced 596.04 million tires which increased by 22.1% compared to the same period in 2020. The increasing synthetic rubber production in the country is estimated to drive the market for organic peroxides, as they are used for the processing of polymers.
- In 2021, China produced 8,117-kilo metric tons of synthetic rubber, which increased by 9.1% compared to 2020. According to China Rubber Industry Association, China imported a total of 775-kilo metric tons of synthetic rubber from January to August 2021, which increased by 10% compared to the same period in 2020. In the first eight months of 2021, China exported around 190-kilo metric tons of synthetic rubber, which increased by 89% compared to the same period in 2020.
- India is one of the largest producers and consumers of rubber after China in the Asia-Pacific region. Despite being one of the largest producers of rubber, the country imports a noticeable portion of the rubber from various countries to meet the local demand. In India, there are about 6000 manufacturing units comprising 30 large-scale manufacturing units, 300 medium manufacturing scale, and around 5,600 small-scale and tiny sector manufacturing units. All these units are manufacturing more than 35,000 rubber products in the country.
- India produced around 12,143.62 kilos metric tons of polymers (five basic plastics - PVC, PP, PE, and others) in FY2020-21, which declined by 2.1% compared to 12,403.69 kilo metric tons in FY2019-20. The country produced 7,075.30 kilos metric tons of polymers till October 2021 in FY2021-22, which increased by 4.01% compared to the previous year. The production of performance plastics declined by 9.1% to 1,519.57 kilos metric tons in FY2020-21. The production recovered in FY2021-22 as the country produced 918.7-kilo metric tons till October FY2021-22, which increased by 14.6%.
- In India, over 65% of the rubber produced is used for the manufacturing of automotive (50%) and bicycle tires and tubes (15%), 12% for footwear, 6% for belts and hoses, and 17% for other products. Moreover, there are almost 66 tire-producing plants in the country and about 41 tire-producing companies with a turnover of around USD 8.5 billion and exports of approximately USD 1.28 billion.
- Owing to all the above factors, Asia-Pacific is expected to dominate the market in the upcoming years.
Organic Peroxides Industry Overview
The organic peroxide market is partially consolidated in nature. Some of the major players in the market include (not in any particular order) Nouryon, Arkema Group, United Initiators, NOF Corporation, and Pergan GmbH, among others.
Additional Benefits:
- The market estimate (ME) sheet in Excel format
- 3 months of analyst support
TABLE OF CONTENTS
1 INTRODUCTION
- 1.1 Study Assumptions
- 1.2 Scope of the Study
2 RESEARCH METHODOLOGY
3 EXECUTIVE SUMMARY
4 MARKET DYNAMICS
- 4.1 Drivers
- 4.1.1 Increasing Demand for Polymers from Various End-user Industries
- 4.1.2 Surging Utilization in Coating Applications
- 4.2 Restraints
- 4.2.1 Difficulty in Storage, Transport, and Handling Organic Peroxides
- 4.3 Industry Value-Chain Analysis
- 4.4 Porter's Five Forces Analysis
- 4.4.1 Bargaining Power of Suppliers
- 4.4.2 Bargaining Power of Buyers/Consumers
- 4.4.3 Threat of New Entrants
- 4.4.4 Threat of Substitute Products and Services
- 4.4.5 Degree of Competition
5 MARKET SEGMENTATION (Market Size in Value)
- 5.1 Type
- 5.1.1 Diacyl Peroxides
- 5.1.2 Ketone Peroxides
- 5.1.3 Percarbonates
- 5.1.4 Benzoyl Peroxide
- 5.1.5 Dialkyl Peroxides
- 5.1.6 Hydro-Peroxides
- 5.1.7 Peroxyesters
- 5.1.8 Other Types
- 5.2 Application
- 5.2.1 Polymers and Rubber
- 5.2.2 Coatings and Adhesives
- 5.2.3 Paper and Textile
- 5.2.4 Cosmetics
- 5.2.5 Healthcare
- 5.2.6 Other Applications
- 5.3 Geography
- 5.3.1 Asia-Pacific
- 5.3.1.1 China
- 5.3.1.2 India
- 5.3.1.3 Japan
- 5.3.1.4 South Korea
- 5.3.1.5 Rest of Asia-Pacific
- 5.3.2 North America
- 5.3.2.1 United States
- 5.3.2.2 Canada
- 5.3.2.3 Mexico
- 5.3.3 Europe
- 5.3.3.1 Germany
- 5.3.3.2 United Kingdom
- 5.3.3.3 Italy
- 5.3.3.4 France
- 5.3.3.5 Spain
- 5.3.3.6 Rest of Europe
- 5.3.4 South America
- 5.3.4.1 Brazil
- 5.3.4.2 Argentina
- 5.3.4.3 Rest of South America
- 5.3.5 Middle-East and Africa
- 5.3.5.1 Saudi Arabia
- 5.3.5.2 South Africa
- 5.3.5.3 Rest of Middle-East and Africa
- 5.3.1 Asia-Pacific
6 COMPETITIVE LANDSCAPE
- 6.1 Mergers, Acquisitions, Joint Ventures, Collaborations, and Agreements
- 6.2 Market Ranking Analysis
- 6.3 Strategies Adopted by Leading Players
- 6.4 Company Profiles
- 6.4.1 ACE CHEMICAL CORP.
- 6.4.2 AKPA KIMYA
- 6.4.3 Arkema Group
- 6.4.4 Chinasun Specialty Products Co. Ltd
- 6.4.5 Kawaguchi Chemical Co. Ltd
- 6.4.6 Lianyungang Hualun Chemical Co. Ltd
- 6.4.7 MPI Chemie BV
- 6.4.8 NOF CORPORATION
- 6.4.9 Nouryon
- 6.4.10 Novichem Spzoo
- 6.4.11 PERGAN GmbH
- 6.4.12 Plasti Pigments Pvt. Ltd
- 6.4.13 United Initiators
7 MARKET OPPORTUNITIES AND FUTURE TRENDS
- 7.1 Growing Demand for Light-Weight Materials
 有機過氧化物市場:按類型、應用分類 - 2024-2030 年全球預測
 全球有機過氧化物市場:按類型、應用和地區分類 – 預測(截至 2030 年)
 全球有機過氧化物市場:預測(2023-2028)
 全球有機過氧化物市場
 2030 年有機過氧化物市場預測 - 按類型、用途、最終用戶和地區分類的全球分析
 有機過氧化物全球市場規模研究與預測,按類型、應用和地區分析,2022-2029
 有機過氧化物市場 2022-2028
 有機過氧化物的全球市場:2016年~2032年
 異丙苯過氧化氫的全球市場-產業分析,規模,佔有率,成長,趨勢,2022年~2028年前的預測