


 |
市場調查報告書
商品編碼
1444103
農業生技藥品:市場佔有率分析、產業趨勢與統計、成長預測(2024-2029)Agricultural Biologicals - Market Share Analysis, Industry Trends & Statistics, Growth Forecasts (2024 - 2029) |
||||||
※ 本網頁內容可能與最新版本有所差異。詳細情況請與我們聯繫。
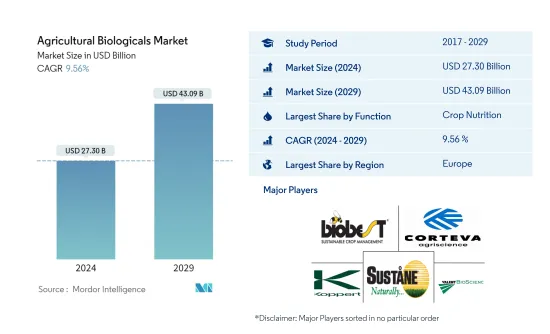
農業生技藥品市場規模預計到2024年為273億美元,預計到2029年將達到430.9億美元,在預測期內(2024-2029年)成長9.56%,年複合成長率成長。
主要亮點
- 用餐肥料是最大的型態。骨粉主要用於解決作物種植對磷的需求,而血粉主要用於補充作物的氮素。
- 有機肥料是最常見的類型。以金額為準,粉狀肥料在全球有機肥料市場中佔據主導地位,到 2022 年將佔市場佔有率 43.2%,同年緊隨其後的是化肥。
- 中耕作物是最大的作物類型。歐洲在生物製藥市場的原料作物市場價值中佔據主導地位。到 2022 年,玉米、水稻、高粱和小麥將成為世界各地種植的最重要的中耕作物。
- 歐洲是最大的地區。隨著有機作物面積的增加,該地區的農業生技藥品市場在2017年至2022年間也增加了約40.6%。
農業生技藥品市場趨勢
作物營養最重要的功能
- 2022年,作物營養領域在全球農業生技藥品市場中佔據最高佔有率,金額計算佔64.6%,按數量計算佔98.1%。由於可用性高、成本低,有機肥料在 2022 年約佔作物營養市場的 58.8%。
- 全球有機肥料市場以粉基肥料為主,2022年佔43.2%。骨粉主要用於滿足作物生產對磷的需求,而作物主要用於供應氮氮。
- 至2022年,中耕作物佔作物營養部分的72.2%,其次是園藝作物和經濟作物,佔有率分別為17.5%和10.3%。中耕作物佔主導地位的部分原因是其種植面積大。
- 微生物佔作物保護領域的大部分,2022 年佔 310 萬美元。如此高的佔有率是由於它能夠控制多種害蟲。與其他生物防治生物相比,大型細菌是貪婪的飼養者。
- 到 2022 年,由於捕食者攻擊各種害蟲物種及其生命階段的能力,以金額為準計算,捕食者約佔大型動物市場的 91.0%。
- 消費者對合成肥料負面影響的了解不斷增加,國內外對有機產品的需求不斷增加。因此,預計市場在預測期內將會成長。
歐洲是最大的地區
- 歐洲地區是世界領先的有機作物生產國之一,也是有機產品的最大消費國。德國和法國是該地區主要的有機農產品生產國,也是該地區市場上有機農產品消費量最高的國家。由於有機作物總面積的增加,區域市場擴大了約 22.9%。預計該市場在預測期內將成長約 63.4%,到預測期結束時將達到 141.1 億美元。
- 亞太地區是有機產品生產大國,市場價值排名第二。中國和印度是該地區有機作物的主要生產國,也是該地區最大的有機產品消費者。 2017年至2021年,該地區有機農業面積大幅增加,從2017年的490萬公頃增加到2021年的690萬公頃。
- 2022年,北美佔全球生物肥料市場的19.8%。該地區有機作物從2017年的140萬公頃增加到2021年的160萬公頃,增加了13.5%。該地區對有機食品的需求正在快速成長,2021年北美人均有機食品支出將達到109.7美元。
- 有機作物種植面積的擴大以及對有機產品和生物肥料需求的增加正在減少化肥的整體使用和作物生產成本。政府鼓勵有機農業的舉措預計將在預測期內推動全球農業生物製品市場的發展,年複合成長率為 9.4%。
農業生技藥品產業概況
農業生技藥品市場較為分散,前五名企業佔比為4.07%。市場的主要企業包括(按字母順序排列)Biobest Group NV、Corteva Agriscience、Koppert Biological Systems Inc.、Sustane Natural Fertilizer Inc. 和 Valent Biosciences LLC。
其他福利
- Excel 格式的市場預測 (ME) 表
- 3 個月分析師支持
目錄
第1章執行摘要和主要發現
第2章 提供報告
第3章簡介
- 研究假設和市場定義
- 調查範圍
- 調查方法
第4章 產業主要趨勢
- 有機種植面積
- 人均有機產品支出
- 法律規範
- 價值鍊和通路分析
第5章市場區隔
- 功能
- 作物營養
- 生物肥料
- 固氮螺菌
- 固氮菌
- 菌根
- 解磷細菌
- 根瘤菌
- 其他生物肥料
- 生物刺激劑
- 胺基酸
- 富裡酸
- 腐植酸
- 蛋白質水解物
- 海藻萃取物
- 其他生物刺激劑
- 有機肥
- 肥料
- 用餐基肥料
- 油餅
- 其他有機肥
- 作物保護
- 生物防治劑
- 宏觀的
- 微生物
- 生物農藥
- 生物殺菌劑
- 生物除草劑
- 生物殺蟲劑
- 其他生物農藥
- 作物營養
- 作物類型
- 經濟作物
- 園藝作物
- 中耕作物
- 地區
- 非洲
- 埃及
- 奈及利亞
- 南非
- 其他非洲
- 亞太地區
- 澳洲
- 中國
- 印度
- 印尼
- 日本
- 菲律賓
- 泰國
- 越南
- 其他亞太地區
- 歐洲
- 法國
- 德國
- 義大利
- 荷蘭
- 俄羅斯
- 西班牙
- 土耳其
- 英國
- 其他歐洲國家
- 中東
- 伊朗
- 沙烏地阿拉伯
- 其他中東地區
- 北美洲
- 加拿大
- 墨西哥
- 美國
- 北美其他地區
- 南美洲
- 阿根廷
- 巴西
- 南美洲其他地區
- 非洲
第6章 競爭形勢
- 重大策略舉措
- 市場佔有率分析
- 公司形勢
- 公司簡介
- Agriculture Solutions Inc.
- Biobest Group NV
- Bioworks Inc.
- California Organic Fertilizers Inc.
- Cascade Agronomics LLC
- Corteva Agriscience
- Indogulf BioAg LLC(Biotech Division of Indogulf Company)
- Koppert Biological Systems Inc.
- Lallemand Inc.
- Samriddhi Crops India Pvt Ltd
- Sigma Agriscience LLC
- Sustane Natural Fertilizer Inc.
- Symborg Inc.
- The Espoma Company
- Valent Biosciences LLC
第7章 CEO 面臨的關鍵策略問題
第8章附錄
The Agricultural Biologicals Market size is estimated at USD 27.30 billion in 2024, and is expected to reach USD 43.09 billion by 2029, growing at a CAGR of 9.56% during the forecast period (2024-2029).
Key Highlights
- Meal Based Fertilizers is the Largest Form. Bone meal is predominantly utilized to address the crop cultivation requirement for phosphorous, while blood meal is deployed primarily for supplementing nitrogen in crops.
- Organic Fertilizer is the Largest Type. Meal-based fertilizers dominated the global organic fertilizer market interms of value which accounted for 43.2% of the market in 2022, followed by manures in the same year.
- Row Crops is the Largest Crop Type. Europe dominates the market value for row crops in biologicals market. In 2022, maize, rice, sorghum, and wheat are among the most important row crops cultivated globally.
- Europe is the Largest Region. With the increasing trend in organic crop area, the agricultural biologicals market in the region has also increased by about 40.6 percent during period of 2017 to 2022.
Agricultural Microbials Market Trends
Crop Nutrition is the largest Function
- The crop nutrition segment held the highest share of the global agricultural biologicals market in 2022, accounting for 64.6% by value and 98.1% by volume. Organic fertilizers accounted for about 58.8% of the crop nutrition market in 2022, owing to their vast availability and inexpensive cost.
- The global organic fertilizer market was dominated by meal-based fertilizers, which accounted for 43.2% in 2022. Bone meal is largely used to meet the phosphorus requirements of crop production, whereas blood meal is mostly used to supply nitrogen in crops.
- Row crops accounted for 72.2% of the crop nutrition segment in 2022, followed by horticultural and cash crops, which held shares of 17.5% and 10.3%, respectively. The dominance of row crops was partly due to their large cultivation area.
- Macrobials dominated the crop protection segment, accounting for USD 3.10 million in 2022. This high share was due to their ability to control a wide range of pests. When compared to other biocontrol organisms, macrobials are voracious feeders.
- In 2022, predators accounted for about 91.0% of the macrobial market by value due to their ability to attack various pest species and their life stages.
- Consumers' growing knowledge of the detrimental effects of synthetic fertilizers is boosting the demand for organic products both internationally and domestically. As a result, the market is expected to grow during the forecast period.
Europe is the largest Region
- The European region is one of the world's major producers of organic crops and the largest consumer of organic products. Germany and France are some of the major organic crop producers in the region, and they account for the highest organic product consumption in the regional market. Due to the rise in the overall organic crop area, the regional market has expanded by about 22.9%. The market is expected to grow by about 63.4% during the forecast period, reaching USD 14.11 billion by the end of the forecast period.
- The Asia-Pacific region is a large producer of organic products, ranking second in terms of market value. China and India are the region's leading organic crop producers and the region's largest organic product consumers as well. The region's organic agricultural area increased significantly from 2017 to 2021, growing from 4.9 million hectares in 2017 to 6.9 million hectares in 2021.
- North America accounted for 19.8% of the global biofertilizers market in 2022. The area under cultivation of organic crops in the region increased by 13.5% from 1.4 million hectares in 2017 to 1.6 million hectares in 2021. The demand for organic food in the region is growing rapidly, with an average per capita spending on organic food products in North America valued at USD 109.7 in 2021.
- The expanding organic crop areas and the rising demand for organic products and biological fertilizers lower the overall chemical fertilizer usage and crop production costs. The governments' efforts to encourage organic farming are expected to drive the global agricultural biologicals market during the forecast period, registering a CAGR of 9.4%.
Agricultural Microbials Industry Overview
The Agricultural Biologicals Market is fragmented, with the top five companies occupying 4.07%. The major players in this market are Biobest Group NV, Corteva Agriscience, Koppert Biological Systems Inc., Sustane Natural Fertilizer Inc. and Valent Biosciences LLC (sorted alphabetically).
Additional Benefits:
- The market estimate (ME) sheet in Excel format
- 3 months of analyst support
TABLE OF CONTENTS
1 EXECUTIVE SUMMARY & KEY FINDINGS
2 REPORT OFFERS
3 INTRODUCTION
- 3.1 Study Assumptions & Market Definition
- 3.2 Scope of the Study
- 3.3 Research Methodology
4 KEY INDUSTRY TRENDS
- 4.1 Area Under Organic Cultivation
- 4.2 Per Capita Spending On Organic Products
- 4.3 Regulatory Framework
- 4.4 Value Chain & Distribution Channel Analysis
5 MARKET SEGMENTATION
- 5.1 Function
- 5.1.1 Crop Nutrition
- 5.1.1.1 Biofertilizer
- 5.1.1.1.1 Azospirillum
- 5.1.1.1.2 Azotobacter
- 5.1.1.1.3 Mycorrhiza
- 5.1.1.1.4 Phosphate Solubilizing Bacteria
- 5.1.1.1.5 Rhizobium
- 5.1.1.1.6 Other Biofertilizers
- 5.1.1.2 Biostimulants
- 5.1.1.2.1 Amino Acids
- 5.1.1.2.2 Fulvic Acid
- 5.1.1.2.3 Humic Acid
- 5.1.1.2.4 Protein Hydrolysates
- 5.1.1.2.5 Seaweed Extracts
- 5.1.1.2.6 Other Biostimulants
- 5.1.1.3 Organic Fertilizer
- 5.1.1.3.1 Manure
- 5.1.1.3.2 Meal Based Fertilizers
- 5.1.1.3.3 Oilcakes
- 5.1.1.3.4 Other Organic Fertilizers
- 5.1.2 Crop Protection
- 5.1.2.1 Biocontrol Agents
- 5.1.2.1.1 Macrobials
- 5.1.2.1.2 Microbials
- 5.1.2.2 Biopesticides
- 5.1.2.2.1 Biofungicides
- 5.1.2.2.2 Bioherbicides
- 5.1.2.2.3 Bioinsecticides
- 5.1.2.2.4 Other Biopesticides
- 5.1.1 Crop Nutrition
- 5.2 Crop Type
- 5.2.1 Cash Crops
- 5.2.2 Horticultural Crops
- 5.2.3 Row Crops
- 5.3 Region
- 5.3.1 Africa
- 5.3.1.1 Egypt
- 5.3.1.2 Nigeria
- 5.3.1.3 South Africa
- 5.3.1.4 Rest of Africa
- 5.3.2 Asia-Pacific
- 5.3.2.1 Australia
- 5.3.2.2 China
- 5.3.2.3 India
- 5.3.2.4 Indonesia
- 5.3.2.5 Japan
- 5.3.2.6 Philippines
- 5.3.2.7 Thailand
- 5.3.2.8 Vietnam
- 5.3.2.9 Rest of Asia-Pacific
- 5.3.3 Europe
- 5.3.3.1 France
- 5.3.3.2 Germany
- 5.3.3.3 Italy
- 5.3.3.4 Netherlands
- 5.3.3.5 Russia
- 5.3.3.6 Spain
- 5.3.3.7 Turkey
- 5.3.3.8 United Kingdom
- 5.3.3.9 Rest of Europe
- 5.3.4 Middle East
- 5.3.4.1 Iran
- 5.3.4.2 Saudi Arabia
- 5.3.4.3 Rest of Middle East
- 5.3.5 North America
- 5.3.5.1 Canada
- 5.3.5.2 Mexico
- 5.3.5.3 United States
- 5.3.5.4 Rest of North America
- 5.3.6 South America
- 5.3.6.1 Argentina
- 5.3.6.2 Brazil
- 5.3.6.3 Rest of South America
- 5.3.1 Africa
6 COMPETITIVE LANDSCAPE
- 6.1 Key Strategic Moves
- 6.2 Market Share Analysis
- 6.3 Company Landscape
- 6.4 Company Profiles
- 6.4.1 Agriculture Solutions Inc.
- 6.4.2 Biobest Group NV
- 6.4.3 Bioworks Inc.
- 6.4.4 California Organic Fertilizers Inc.
- 6.4.5 Cascade Agronomics LLC
- 6.4.6 Corteva Agriscience
- 6.4.7 Indogulf BioAg LLC (Biotech Division of Indogulf Company)
- 6.4.8 Koppert Biological Systems Inc.
- 6.4.9 Lallemand Inc.
- 6.4.10 Samriddhi Crops India Pvt Ltd
- 6.4.11 Sigma Agriscience LLC
- 6.4.12 Sustane Natural Fertilizer Inc.
- 6.4.13 Symborg Inc.
- 6.4.14 The Espoma Company
- 6.4.15 Valent Biosciences LLC
7 KEY STRATEGIC QUESTIONS FOR AGRICULTURAL BIOLOGICALS CEOS
8 APPENDIX
- 8.1 Global Overview
- 8.1.1 Overview
- 8.1.2 Porter's Five Forces Framework
- 8.1.3 Global Value Chain Analysis
- 8.1.4 Market Dynamics (DROs)
- 8.2 Sources & References
- 8.3 List of Tables & Figures
- 8.4 Primary Insights
- 8.5 Data Pack
- 8.6 Glossary of Terms
 2024-2032 年農業生物製品市場報告(按類型、來源、應用方式、應用和地區)
 農業生技藥品市場規模、佔有率、趨勢分析報告:按作物類型、產品類型、應用方法、地區和細分市場預測,2024-2030 年
 農業生物製藥市場:按類型、來源、申請型態、用途分類 - 全球預測 2024-2030
 2024 年農業生技藥品全球市場報告
 農業生物製品市場:按產品類型、產品來源、應用方法、處理作物類型和主要地區分佈:產業趨勢和全球預測,2023-2035
 全球農業生物製品市場研究報告 - 2023 年至 2030 年產業分析、規模、佔有率、成長、趨勢與預測
 農業與生物市場情報中心
 全球農業生物學市場
 農業生物市場到 2030 年的主要趨勢和預測:按趨勢和地區分類的全球分析
 全球農業生物市場 - 2023-2030 年