


 |
市場調查報告書
商品編碼
1443896
生物殺菌劑:市場佔有率分析、產業趨勢與統計、成長預測(2024-2029)Biofungicides - Market Share Analysis, Industry Trends & Statistics, Growth Forecasts (2024 - 2029) |
||||||
價格
※ 本網頁內容可能與最新版本有所差異。詳細情況請與我們聯繫。
簡介目錄
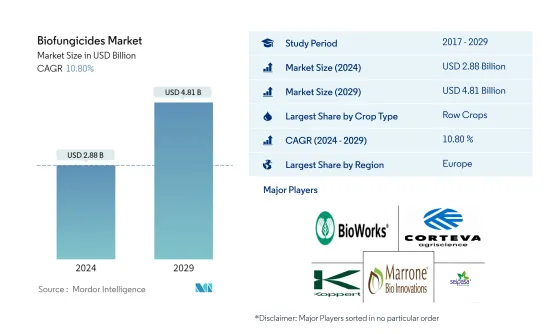
生物殺菌劑市場規模預計到 2024 年為 28.8 億美元,預計到 2029 年將達到 48.1 億美元,預測期內(2024-2029 年)年複合成長率為 10.80%。
主要亮點
- 中耕作物是最大的作物。全球種植的主要中耕作物為大麥、玉米、小麥、油菜籽、黑麥、向日葵、大豆和水稻,2022年將佔全球生物殺菌劑市場的84.8%。
- 園藝作物是生長最快的作物。現代溫室中水果和蔬菜作物的保護性種植被認為是一種永續的糧食生產系統,其使用正在增加。
- 歐洲是最大的地區。 2022年歐洲佔全球生物殺菌劑市場的41.1%。歐洲農藥行動網致力於大幅減少整個歐洲農藥的使用。
- 美國已成為最大的國家。 2022年美國生物殺菌劑市值為7.816億美元,是消費最多的生物農藥類型,2022年市場佔有率為49.5%。
生物殺菌劑市場趨勢
中耕作物是最大的作物類型
- 2022年全球生物殺菌劑市場主要由中作物生產所驅動,主要作物為大麥、玉米、小麥、油菜籽、黑麥、向日葵、大豆和水稻。以金額為準計算,這些作物約佔全球生物殺菌劑市場的 84.1%。此細分市場以北美為主,其中美國為主要國家,佔整個市場的71.4%。由於美國大作物種植行間作物,預計生物殺菌劑的消費量將持續增加。
- 園藝作物,包括香蕉、蘋果、葡萄、番茄、洋蔥、黃瓜和高麗菜等水果和蔬菜,到2022年將佔全球生物殺菌劑市場的12.3%。歐洲地區在該子區隔市場中佔據主導地位,佔有率為 68.4%。義大利、法國和西班牙是該地區的主要國家,其中義大利佔39.7%的佔有率。
- 2022年,咖啡、茶葉、可可、棉花、菸草、橡膠和甘蔗等經濟作物佔全球生物殺菌劑消費量總量的4.0%。歐洲地區在該子區隔市場中佔據主導地位,佔 42.1%。法國、德國和義大利是該地區的主要國家,其中法國佔34.2%的佔有率。
- 在健康問題的背景下,對有機生產的水果和蔬菜的需求不斷增加,預計在預測期內(2023-2029年)將進一步增加市場作物領域生物殺菌劑的消費量。
歐洲是最大的地區
- 在農業中,芽孢桿菌屬、木黴屬、鏈黴菌屬和假單胞菌屬是最常用的生物殺菌劑微生物。這些已被證明可有效對抗腐黴屬、絲核菌屬、鐮刀菌屬、菌核屬、擬黴屬、葡萄孢屬和白粉病等病原體。
- 歐洲是最大的生物殺菌劑市場,到2022年將佔41.1%的以金額為準。法國是歐盟主要農業生產國。小麥、黑麥、大麥、玉米、甜菜和燕麥是該國種植的主要作物。 2022年,法國佔歐洲生物殺菌劑市場以金額為準的27.5%佔有率。這一高佔有率主要是由於該國有機種植面積巨大,2022年佔該地區有機種植總面積的17.4%。
- 北美是生物殺菌劑的第二大消費國。 2022 年,其市佔率為 37.7%,價值為 8.912 億美元,預計到預測期結束時將達到 8.912 億美元。美國和其他北美國家的政府舉措,例如有機認證成本分攤計劃,為建立成本分攤緩衝提供財政援助,並向有機農民提供低利率貸款,對加速生物殺菌劑的使用很有幫助。預計生物殺菌劑市場在預測期內的年複合成長率為 11.4%。
- 多種生物殺菌劑的多種作用模式和在生物防治和促進植物生長方面的作用預計將推動全球生物殺菌劑市場的發展。預計在預測期內(2023-2029 年),市場將以 10.8% 的年複合成長率發展。
生物殺菌劑產業概況
殺菌劑市場較為分散,前五家企業佔比為1.40%。市場的主要企業是(按字母順序排列)Bioworks Inc.、Corteva Agriscience、Koppert Biological Systems Inc.、Marrone Bio Innovations Inc. 和 Seipasa SA。
其他福利
- Excel 格式的市場預測 (ME) 表
- 3 個月分析師支持
目錄
第1章執行摘要和主要發現
第2章 提供報告
第3章簡介
- 研究假設和市場定義
- 調查範圍
- 調查方法
第4章 產業主要趨勢
- 有機種植面積
- 人均有機產品支出
- 法律規範
- 價值鍊和通路分析
第5章市場區隔
- 作物類型
- 經濟作物
- 園藝作物
- 中耕作物
- 地區
- 非洲
- 按國家/地區
- 埃及
- 奈及利亞
- 南非
- 其他非洲
- 亞太地區
- 按國家/地區
- 澳洲
- 中國
- 印度
- 印尼
- 日本
- 菲律賓
- 泰國
- 越南
- 其他亞太地區
- 歐洲
- 按國家/地區
- 法國
- 德國
- 義大利
- 荷蘭
- 俄羅斯
- 西班牙
- 土耳其
- 英國
- 其他歐洲國家
- 中東
- 按國家/地區
- 伊朗
- 沙烏地阿拉伯
- 其他中東地區
- 北美洲
- 按國家/地區
- 加拿大
- 墨西哥
- 美國
- 北美其他地區
- 南美洲
- 按國家/地區
- 阿根廷
- 巴西
- 南美洲其他地區
- 非洲
第6章 競爭形勢
- 重大策略舉措
- 市場佔有率分析
- 公司形勢
- 公司簡介
- Andermatt Group AG
- Biolchim SPA
- Bioworks Inc.
- Certis USA LLC
- Corteva Agriscience
- Indogulf BioAg LLC(Biotech Division of Indogulf Company)
- Koppert Biological Systems Inc.
- Lallemand Inc.
- Marrone Bio Innovations Inc.
- Seipasa SA
第7章 CEO 面臨的關鍵策略問題
第8章附錄
- 全球概覽
- 概述
- 波特的五力框架
- 全球價值鏈分析
- 市場動態(DRO)
- 來源和參考文獻
- 表格和圖形列表
- 重要見解
- 資料包
- 詞彙表
簡介目錄
Product Code: 48617
The Biofungicides Market size is estimated at USD 2.88 billion in 2024, and is expected to reach USD 4.81 billion by 2029, growing at a CAGR of 10.80% during the forecast period (2024-2029).
Key Highlights
- Row Crops is the Largest Crop Type : The major row crops farmed globally are barley, corn, wheat, rapeseed, rye, sunflower, soybean, and rice, accounting for 84.8% of the global biofungicides market in 2022.
- Horticultural Crops is the Fastest-growing Crop Type : The protected cultivation of fruit and vegetable crops in modern greenhouses is considered as highly sustainable food production system that is increasingly being used.
- Europe is the Largest Region : Europe accounted for 41.1% of the global biofungicides market in 2022. Pesticide Action Network Europe is dedicated to significantly reducing pesticide use across Europe.
- United States is the Largest Country : The market for biofungicides in the United States is valued at USD 781.6 million in 2022 and is the most consumed biopesticide type with a market share of 49.5% in 2022.
Biofungicides Market Trends
Row Crops is the largest Crop Type
- The global biofungicides market in 2022 was primarily driven by the production of row crops, with the main crops being barley, corn, wheat, rapeseed, rye, sunflower, soybean, and rice. These crops accounted for approximately 84.1% of the global biofungicides market in terms of value. North America dominates this segment of the market, with the United States being the leading country, accounting for 71.4% of the total market value. The consumption of biofungicides in row crops is expected to continue to grow due to the considerable extent of area under the cultivation of these crops in the United States.
- Horticultural crops, including fruits and vegetables such as bananas, apples, grapes, tomatoes, onions, cucumbers, and cabbages, accounted for 12.3% of the global biofungicides market in 2022. The European region dominates this sub-segment of the market, accounting for a share of 68.4%. Italy, France, and Spain are the leading countries in this region, with Italy accounting for a share of 39.7%.
- Cash crops, including coffee, tea, cocoa, cotton, tobacco, rubber, and sugarcane, accounted for 4.0% of the total global consumption of biofungicides in 2022. The European region dominates this sub-segment of the market, accounting for a share of 42.1%. France, Germany, and Italy are the leading countries in this region, with France accounting for a share of 34.2%.
- The increased demand for organically produced fruits and vegetables, driven by health concerns, is expected to further boost the consumption of biofungicides in the crop segment of the market during the forecast period (2023-2029).
Europe is the largest Region
- In agriculture, Bacillus, Trichoderma, Streptomyces, and Pseudomonas are the most commonly utilized microorganisms as bio fungicides. They have proven effective against pathogens such as Pythium, Rhizoctonia, Fusarium, Sclerotinia, Thielaviopsis, Botrytis, and powdery mildew.
- Europe is the largest market for biofungicides, accounting for a share of 41.1% in terms of value in 2022. France is the European Union's leading agricultural producer. Wheat, rye, barley, corn, sugar beet, and oats are among the major crops grown in the country. France accounted for a share of 27.5% of the European biofungicides market in terms of value in 2022. The high share percentage was primarily due to the country's extensive area under organic cultivation, accounting for 17.4% of the total organic area in the region in 2022.
- North America is the second-largest consumer of biofungicides; it accounted for a share of 37.7% in 2022, valued at USD 891.2 million, which is expected to reach USD 891.2 million by the end of the forecast period. Government initiatives in North American countries like the United States, such as the Organic Certificate cost-share program, providing financial assistance to establish a cost-share buffer zone, and low-interest loans for organic farmers, help accelerate the use of biofungicides. The biofungicides market is anticipated to register a CAGR of 11.4% during the forecast period.
- The multiple modes of action and the role of a few biofungicides in both biocontrol and stimulating plant growth are expected to drive the market for biofungicides globally. The market is estimated to register a CAGR of 10.8% during the forecast period (2023-2029).
Biofungicides Industry Overview
The Biofungicides Market is fragmented, with the top five companies occupying 1.40%. The major players in this market are Bioworks Inc., Corteva Agriscience, Koppert Biological Systems Inc., Marrone Bio Innovations Inc. and Seipasa SA (sorted alphabetically).
Additional Benefits:
- The market estimate (ME) sheet in Excel format
- 3 months of analyst support
TABLE OF CONTENTS
1 EXECUTIVE SUMMARY & KEY FINDINGS
2 REPORT OFFERS
3 INTRODUCTION
- 3.1 Study Assumptions & Market Definition
- 3.2 Scope of the Study
- 3.3 Research Methodology
4 KEY INDUSTRY TRENDS
- 4.1 Area Under Organic Cultivation
- 4.2 Per Capita Spending On Organic Products
- 4.3 Regulatory Framework
- 4.4 Value Chain & Distribution Channel Analysis
5 MARKET SEGMENTATION
- 5.1 Crop Type
- 5.1.1 Cash Crops
- 5.1.2 Horticultural Crops
- 5.1.3 Row Crops
- 5.2 Region
- 5.2.1 Africa
- 5.2.1.1 By Country
- 5.2.1.1.1 Egypt
- 5.2.1.1.2 Nigeria
- 5.2.1.1.3 South Africa
- 5.2.1.1.4 Rest Of Africa
- 5.2.2 Asia-Pacific
- 5.2.2.1 By Country
- 5.2.2.1.1 Australia
- 5.2.2.1.2 China
- 5.2.2.1.3 India
- 5.2.2.1.4 Indonesia
- 5.2.2.1.5 Japan
- 5.2.2.1.6 Philippines
- 5.2.2.1.7 Thailand
- 5.2.2.1.8 Vietnam
- 5.2.2.1.9 Rest Of Asia-Pacific
- 5.2.3 Europe
- 5.2.3.1 By Country
- 5.2.3.1.1 France
- 5.2.3.1.2 Germany
- 5.2.3.1.3 Italy
- 5.2.3.1.4 Netherlands
- 5.2.3.1.5 Russia
- 5.2.3.1.6 Spain
- 5.2.3.1.7 Turkey
- 5.2.3.1.8 United Kingdom
- 5.2.3.1.9 Rest Of Europe
- 5.2.4 Middle East
- 5.2.4.1 By Country
- 5.2.4.1.1 Iran
- 5.2.4.1.2 Saudi Arabia
- 5.2.4.1.3 Rest Of Middle East
- 5.2.5 North America
- 5.2.5.1 By Country
- 5.2.5.1.1 Canada
- 5.2.5.1.2 Mexico
- 5.2.5.1.3 United States
- 5.2.5.1.4 Rest Of North America
- 5.2.6 South America
- 5.2.6.1 By Country
- 5.2.6.1.1 Argentina
- 5.2.6.1.2 Brazil
- 5.2.6.1.3 Rest Of South America
- 5.2.1 Africa
6 COMPETITIVE LANDSCAPE
- 6.1 Key Strategic Moves
- 6.2 Market Share Analysis
- 6.3 Company Landscape
- 6.4 Company Profiles
- 6.4.1 Andermatt Group AG
- 6.4.2 Biolchim SPA
- 6.4.3 Bioworks Inc.
- 6.4.4 Certis USA LLC
- 6.4.5 Corteva Agriscience
- 6.4.6 Indogulf BioAg LLC (Biotech Division of Indogulf Company)
- 6.4.7 Koppert Biological Systems Inc.
- 6.4.8 Lallemand Inc.
- 6.4.9 Marrone Bio Innovations Inc.
- 6.4.10 Seipasa SA
7 KEY STRATEGIC QUESTIONS FOR AGRICULTURAL BIOLOGICALS CEOS
8 APPENDIX
- 8.1 Global Overview
- 8.1.1 Overview
- 8.1.2 Porter's Five Forces Framework
- 8.1.3 Global Value Chain Analysis
- 8.1.4 Market Dynamics (DROs)
- 8.2 Sources & References
- 8.3 List of Tables & Figures
- 8.4 Primary Insights
- 8.5 Data Pack
- 8.6 Glossary of Terms


