


 |
市場調查報告書
商品編碼
1440531
鉀肥:全球市場佔有率分析、產業趨勢與統計、成長預測(2024-2030)Global Potash Fertilizer - Market Share Analysis, Industry Trends & Statistics, Growth Forecasts (2024 - 2030) |
||||||
價格
※ 本網頁內容可能與最新版本有所差異。詳細情況請與我們聯繫。
簡介目錄
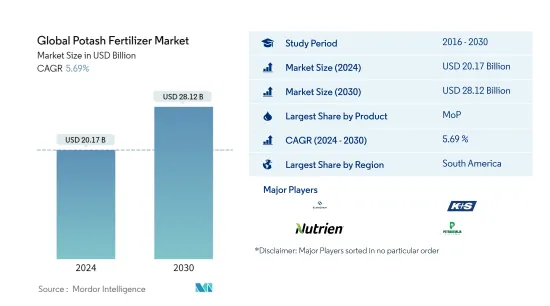
預計2024年全球鉀肥市場規模為201.7億美元,預計2030年將達281.2億美元,在預測期(2024-2030年)成長5.69%,年複合成長率成長。
主要亮點
- 按類型分類,MoP 是成長最快的部分:鉀鹽 (MoP) 的鉀含量最高,為 60.0%,最常用作相對便宜的鉀肥。
- 按作物類型分類最大的部分是田間作物:田間作物在世界各地廣泛種植,並且是世界許多地區的主食。在大多數農業國家,它們在單位面積中所佔的佔有率最大。
- 依使用量最大的部分是土壤:土壤施用是一種無需設備的便捷施肥方法。這種施用方法有助於改善植物健康和土壤肥力。
- 最大的國家是巴西:巴西的土壤本質上是酸性的,因此鉀的可用性有限。巴西擁有約7461萬公頃耕地,需要大量鉀。
鉀肥市場趨勢
按產品分類,MoP 是最大的細分市場。
- 鉀肥(MoP)是鉀含量最高的鉀肥,鉀含量為60.0%。 2021年全球鉀鹽市場價值135.6億美元,同年消費量量達3,460萬噸。此外,它還佔世界鉀肥消費量總量的90.6%。
- 鉀含量50.0%的硫酸鉀是全球第二受歡迎的鉀肥。 2021年全球SoP肥料市場價值12億美元,消費量180萬噸。
- 南美洲是最大的鉀肥市場,2022年將佔41.0%的市場佔有率。這是由於巴西等南美國家鉀肥產量增加以及鉀肥需求旺盛所致。
- 其他重要的鉀肥包括鉀鎂鉀肥和光鹵石。這些肥料佔全球鉀肥消費量總量的1.7%。 2021年,其他化肥領域的價值為2.618億美元,消費量為51.46萬噸。
- 此外,與MoP和其他鉀肥相比,硫酸鉀的價格昂貴。例如,自2017年以來,SoP的價格幾乎是氯化鉀的兩倍,2021年更是增加了一倍以上。儘管價格較高,但 SoP 肥料的高價格導致市場佔有率低於 MoP。品質.
- 由於提高作物生產力的需求不斷增加等因素,鉀肥市場預計在預測期內將成長。
南美洲是最大的區域部分。
- 南美洲在全球鉀肥市場佔據主導地位,2021年佔市場價值的34.2%。據分析,2021年南美洲鉀肥市場價值為51億美元。從肥料種類來看,常規鉀肥佔肥料的大部分。約佔市場71.1%,其次是特種鉀肥,2021年將貢獻28.8%。
- 由於南美洲作物對鉀肥的需求量大,鉀肥佔了國內市場的最大佔有率。南美洲大量進口化肥,2017 年至 2018 年進口了 700 萬噸鉀肥(糧農組織)。
- 歐洲佔全球第二大市場佔有率,2021年市場佔有率為23.0%。在歐洲,消耗大部分化肥的其他歐洲國家包括波蘭、比利時和東南歐國家,佔化肥產量的70.5%。歐洲化肥市場價值巨大,預計在預測期內年複合成長率為 3.6%。
- 北美是第三大鉀肥市場,佔21.3%,其中美國占主導地位,約佔北美鉀肥市場總量的84.3%,2021年價值約27億美元。約佔北美農業用地總量的69.0%。
- 新興市場的大多數土壤普遍存在缺鉀現象。因此,農民正在使用鉀肥來最大限度地減少鉀缺乏並提高生產力,這進一步推動了市場的成長。
鉀肥業概況
全球鉀肥市場較為集中,前五名企業佔比達67.38%。該市場的主要企業包括(按字母順序排列)Eurochem、K+S AKTIENGESELLSCHAFT、Nutrien Limited、Petrokemija DD Fertilizer Factory 和 The Mosaic Co。
其他福利
- Excel 格式的市場預測 (ME) 表
- 3 個月分析師支持
目錄
第1章執行摘要和主要發現
第2章 報告條款
第3章簡介
- 研究假設和市場定義
- 調查範圍
- 調查方法
第4章 產業主要趨勢
- 主要作物種植面積
- 平均養分施用量
- 法律規範
- 價值鍊和通路分析
第5章市場區隔
- 類型
- 直的
- 鉀
- 拖把
- SoP
- 其他
- 直的
- 如何使用
- 施肥
- 葉子
- 土壤
- 作物類型
- 田裡的作物
- 園藝作物
- 草坪和裝飾
- 地區
- 亞太地區
- 澳洲
- 孟加拉
- 中國
- 印度
- 印尼
- 日本
- 巴基斯坦
- 菲律賓
- 泰國
- 越南
- 其他亞太地區
- 歐洲
- 法國
- 德國
- 義大利
- 荷蘭
- 俄羅斯
- 西班牙
- 烏克蘭
- 英國
- 其他歐洲國家
- 中東和非洲
- 奈及利亞
- 沙烏地阿拉伯
- 南非
- 土耳其
- 其他中東和非洲
- 北美洲
- 加拿大
- 墨西哥
- 美國
- 北美其他地區
- 南美洲
- 阿根廷
- 巴西
- 南美洲其他地區
- 亞太地區
第6章 競爭形勢
- 重大策略舉措
- 市場佔有率分析
- 公司形勢
- 公司簡介
- Coromandel International Ltd.
- Eurochem
- Intrepid Potash Inc.
- K+S AKTIENGESELLSCHAFT
- Nutrien Limited
- Petrokemija DD Fertilizer Factory
- Sinofert Holdings Ltd.
- Sociedad Quimica y Minera(SQM)
- The Mosaic Co.
第7章 CEO 面臨的關鍵策略問題
第8章附錄
- 世界概況
- 概述
- 波特的五力框架
- 全球價值鏈分析
- 市場動態(DRO)
- 來源和參考文獻
- 表格和圖形列表
- 重要見解
- 資料包
- 詞彙表
簡介目錄
Product Code: 92583
The Global Potash Fertilizer Market size is estimated at USD 20.17 billion in 2024, and is expected to reach USD 28.12 billion by 2030, growing at a CAGR of 5.69% during the forecast period (2024-2030).
Key Highlights
- Fastest growing segment by Type - MoP : Muriate of potash (MoP) is a potassic fertilizer with the highest potash content of 60.0%, with a comparatively less price making it most used potassic fertilizer.
- Largest Segment by Crop Type - Field Crops : Field crops are widely cultivated worldwide and are a staple food in many parts of the world. They account for a maximum share by area in most agricultural countries.
- Largest Segment by Application Mode - Soil : Soil application is a convenient way of applying fertilizers without any equipment. This method of application helps in improving both plant health and soil fertility.
- Largest segment by Country - Brazil : The soils of Brazil are mostly acidic in nature, thus limiting the availability of K. Brazil has around 74.61 million ha of cropland, requiring a large amount of potassium.
Potash Fertilizer Market Trends
MoP is the largest segment by Product.
- Muriate of potash (MoP) is a potassic fertilizer with the highest potash content of 60.0%. The global market for Muriate of Potash is valued at USD 13.56 billion in the year 2021 with a volume consumption of 34.6 million metric tons in the same year. Moreover, it accounts for 90.6% of the total potassium fertilizer consumption globally.
- Sulphate of potash with 50.0% of potassium content, is the second most preferred potassium fertilizer globally. The global SoP fertilizer market is valued at USD 1.20 billion in the year 2021. with a volume consumption of 1.8 million metric tons.
- South America is the largest market for potassic fertilizer, and it accounts for a market share of 41.0% in the year 2022. This is attributed to the higher production of potassic fertilizers in the South American countries like Brazil, along with high demand for Potassic fertilizers by the crops grown in the region.
- Other important potassic fertilizers include Langbeinite and Carnallite. These fertilizers account for 1.7% of the total potassic fertilizer consumption in the world. In the year 2021, the other fertilizer segment is valued at USD 261.8 million, with a volume consumption of 514.6 thousand metric tons.
- Moreover, the price of Sulphate of Potash is higher compared to MoP and other potassic fertilizers. For instance, the price of SoP has been close to double the price of Muriate of Potash since 2017 and it was more than double in the year 2021. The high price of SoP fertilizer has given it the less market share over MoP despite of the higher quality.
- The market for potassic fertilizers is anticipated to grow during the forecast period, owing tot the factors like the increased need for higher crop productivity.
South America is the largest segment by Region.
- South America dominates the global potash fertilizers market, accounting for 34.2% of the market value in 2021. According to the analysis, the South American potash fertilizer market was valued at USD 5.10 billion in 2021. By fertilizer type, conventional potash fertilizers dominate the fertilizer market accounting for about 71.1% followed by specialty potash fertilizers contributing to 28.8% in 2021.
- Owing to the high demand for potash for South American crops, the potassic fertilizer, occupies the largest share of the domestic market. South America imports fertilizers extensively, in between 2017-2018, it imported 7.0 million metric ton of potash fertilizes (FAO).
- Europe accounts for the second largest market share globally accounting for 23.0% market share in 2021. in europe, the rest of European countries that consume the majority of fertilizers include Poland, Belgium, and South-eastern European countries and it accounts for 70.5 % of the value of Europe fertilizer market and anticipated to grow at a CAGR of 3.6% during the forecast period.
- North America is the third largest potash fertilizer market accounted for 21.3%, the United States dominates the market, and it accounts for about 84.3% of the total North America potassic fertilizer market value, valued at about USD 2.70 billion in 2021. This is because it occupied about 69.0% of total agricultural land in North America.
- Potassium deficiency is commonly noticed in most soils across developing markets; Therefore, farmers are using potash fertilizers to minimize potassium deficiencies and increase their productivity, which is further driving the growth of the market.
Potash Fertilizer Industry Overview
The Global Potash Fertilizer Market is fairly consolidated, with the top five companies occupying 67.38%. The major players in this market are Eurochem, K+S AKTIENGESELLSCHAFT, Nutrien Limited, Petrokemija DD Fertilizer Factory and The Mosaic Co. (sorted alphabetically).
Additional Benefits:
- The market estimate (ME) sheet in Excel format
- 3 months of analyst support
TABLE OF CONTENTS
1 EXECUTIVE SUMMARY & KEY FINDINGS
2 REPORT OFFERS
3 INTRODUCTION
- 3.1 Study Assumptions & Market Definition
- 3.2 Scope of the Study
- 3.3 Research Methodology
4 KEY INDUSTRY TRENDS
- 4.1 Acreage Of Major Crop Types
- 4.2 Average Nutrient Application Rates
- 4.3 Regulatory Framework
- 4.4 Value Chain & Distribution Channel Analysis
5 MARKET SEGMENTATION
- 5.1 Type
- 5.1.1 Straight
- 5.1.1.1 Potassic
- 5.1.1.1.1 MoP
- 5.1.1.1.2 SoP
- 5.1.1.1.3 Others
- 5.1.1 Straight
- 5.2 Application Mode
- 5.2.1 Fertigation
- 5.2.2 Foliar
- 5.2.3 Soil
- 5.3 Crop Type
- 5.3.1 Field Crops
- 5.3.2 Horticultural Crops
- 5.3.3 Turf & Ornamental
- 5.4 Region
- 5.4.1 Asia-Pacific
- 5.4.1.1 Australia
- 5.4.1.2 Bangladesh
- 5.4.1.3 China
- 5.4.1.4 India
- 5.4.1.5 Indonesia
- 5.4.1.6 Japan
- 5.4.1.7 Pakistan
- 5.4.1.8 Philippines
- 5.4.1.9 Thailand
- 5.4.1.10 Vietnam
- 5.4.1.11 Rest Of Asia-Pacific
- 5.4.2 Europe
- 5.4.2.1 France
- 5.4.2.2 Germany
- 5.4.2.3 Italy
- 5.4.2.4 Netherlands
- 5.4.2.5 Russia
- 5.4.2.6 Spain
- 5.4.2.7 Ukraine
- 5.4.2.8 United Kingdom
- 5.4.2.9 Rest Of Europe
- 5.4.3 Middle East & Africa
- 5.4.3.1 Nigeria
- 5.4.3.2 Saudi Arabia
- 5.4.3.3 South Africa
- 5.4.3.4 Turkey
- 5.4.3.5 Rest Of Middle East & Africa
- 5.4.4 North America
- 5.4.4.1 Canada
- 5.4.4.2 Mexico
- 5.4.4.3 United States
- 5.4.4.4 Rest Of North America
- 5.4.5 South America
- 5.4.5.1 Argentina
- 5.4.5.2 Brazil
- 5.4.5.3 Rest Of South America
- 5.4.1 Asia-Pacific
6 COMPETITIVE LANDSCAPE
- 6.1 Key Strategic Moves
- 6.2 Market Share Analysis
- 6.3 Company Landscape
- 6.4 Company Profiles
- 6.4.1 Coromandel International Ltd.
- 6.4.2 Eurochem
- 6.4.3 Intrepid Potash Inc.
- 6.4.4 K+S AKTIENGESELLSCHAFT
- 6.4.5 Nutrien Limited
- 6.4.6 Petrokemija DD Fertilizer Factory
- 6.4.7 Sinofert Holdings Ltd.
- 6.4.8 Sociedad Quimica y Minera (SQM)
- 6.4.9 The Mosaic Co.
7 KEY STRATEGIC QUESTIONS FOR FERTILIZER CEOS
8 APPENDIX
- 8.1 Global Overview
- 8.1.1 Overview
- 8.1.2 Porter's Five Forces Framework
- 8.1.3 Global Value Chain Analysis
- 8.1.4 Market Dynamics (DROs)
- 8.2 Sources & References
- 8.3 List of Tables & Figures
- 8.4 Primary Insights
- 8.5 Data Pack
- 8.6 Glossary of Terms
