


 |
市場調查報告書
商品編碼
1440530
氮肥:全球市場佔有率分析、產業趨勢與統計、成長預測(2024-2030)Global Nitrogenous Fertilizer - Market Share Analysis, Industry Trends & Statistics, Growth Forecasts (2024 - 2030) |
||||||
價格
※ 本網頁內容可能與最新版本有所差異。詳細情況請與我們聯繫。
簡介目錄
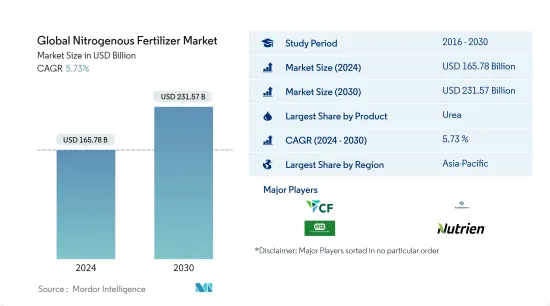
2024年全球氮肥市場規模估計為1657.8億美元,預計到2030年將達到2315.7億美元,在預測期間(2024-2030年)以5.73%的複合年增長率增長。
主要亮點
- 依類型分類為成長最快的部分 - 無水氨:無水氨的氮含量為 82%,是所有氮肥中最高的。本產品非常適合氮消費量高的作物。
- 依作物類型分類的最大區隔市場 -田間作物:田間作物在世界各地廣泛種植,並且是世界許多地區的主食。在大多數農業國家,它們在單位面積中所佔的佔有率最大。
- 以施用方式分類的最大部分 - 土壤:土壤施用是一種無需設備的便捷施肥方法。這種施用方法有助於改善植物健康和土壤肥力。
- 最大區隔國家-印度:印度是全球第二大化肥消費國,2021年消費量為7,000萬噸,其中尿素佔總消費量的60%。
氮肥市場趨勢
尿素是最大的產品領域。
- 尿素是最重要、使用最多的氮肥。 2022年,佔全球氮肥消費量總量的62.5%。 2021年全球尿素市場價值455億美元,同年消費量量1.147億噸。
- 無水氨是所有氮肥中氮含量最高的(82.0%),氮以NH3的形式很容易取得。 2021年全球無水氨市場價值13.6億美元,消費量280萬噸。然而,無水氨作為肥料的使用僅限於北美國家,由於氮消費量較高,該地區的玉米作物普遍使用無水氨。
- 2021年氮肥中,硝酸銨以以金額為準佔6.8%,以消費量量計算佔10.0%。消費量比重由2017年的11.0%下降1.0%至2022年的10.0%。這可能是由於嚴格的規定。世界各地管理硝酸銨運輸、處理和銷售的法規。
- 此外,2022年,亞太地區成為氮肥最大市場,佔70.0%的市場佔有率。在亞太地區,中國和印度由於人口成長和耕地面積大,已成為兩個最大的消費國。
- 全球氮肥市場預計將在預測期內成長,因為它是需求量最大的養分。
亞太地區是最大的地區。
- 2021年全球氮肥市場價值634億美元,同年消費量量為1.834億噸。
- 亞太地區是氮肥最大的消費地區,2021年市場佔有率為56.7%。中國和印度是亞太地區主要農業生產國,豐富的耕地增加了糧食需求。隨著人口成長和政府的大力財政支持,亞太地區的氮肥消費量預計將增加。
- 歐洲是市場第二大地區,2021年佔19.0%的市佔率。在其他歐洲國家,消耗大部分化肥的國家包括波蘭、比利時和東南歐國家。該區隔市場佔歐洲氮肥市場的36.9%,2021年市場規模約48.4億美元。預計在預測期內複合年成長率為 3.7%。
- 緊隨歐洲之後的是北美和南美,市場佔有率分別為 12% 和 11%。在北美,美國約佔北美氮肥市場總量的82.2%,2021年達到約74.2億美元。常規肥料佔市場價值佔有率的63%,特種肥料約佔37.0%。 2021 年。
- 氮肥是農業生產中最重要的肥料。此外,儘管由於集約化種植和增加化肥施用導致耕地面積減少,但提高產量和生產力的嘗試預計將在預測期內提振全球氮肥市場。
氮肥業概況
全球氮肥市場適度整合,前5名企業佔48.47%。該市場的主要企業包括(依字母順序排列)CF Industries、Eurochem、IFFCO、Nutrien Limited 和 Yara International。
其他福利
- Excel 格式的市場預測 (ME) 表
- 3 個月分析師支持
目錄
第1章執行摘要和主要發現
第2章 提供報告
第3章簡介
- 研究假設和市場定義
- 調查範圍
- 調查方法
第4章 產業主要趨勢
- 主要作物種植面積
- 平均養分施用量
- 法律規範
- 價值鍊和通路分析
第5章市場區隔
- 產品
- 硝酸銨
- 無水氨
- 尿素
- 其他
- 型態
- 傳統的
- 特別的
- CRF
- 液體肥料
- SRF
- 水溶性
- 如何使用
- 施肥
- 葉子
- 土壤
- 作物類型
- 田裡的作物
- 園藝作物
- 草坪和裝飾
- 地區
- 亞太地區
- 澳洲
- 孟加拉
- 中國
- 印度
- 印尼
- 日本
- 巴基斯坦
- 菲律賓
- 泰國
- 越南
- 其他亞太地區
- 歐洲
- 法國
- 德國
- 義大利
- 荷蘭
- 俄羅斯
- 西班牙
- 烏克蘭
- 英國
- 其他歐洲國家
- 中東和非洲
- 奈及利亞
- 沙烏地阿拉伯
- 南非
- 土耳其
- 其他中東和非洲
- 北美洲
- 加拿大
- 墨西哥
- 美國
- 北美其他地區
- 南美洲
- 阿根廷
- 巴西
- 南美洲其他地區
- 亞太地區
第6章 競爭形勢
- 重大策略舉措
- 市場佔有率分析
- 公司形勢
- 公司簡介
- CF Industries
- Compo Expert
- Coromandel International Ltd.
- Eurochem
- IFFCO
- Koch Industries
- Nutrien Limited
- SABIC
- Sociedad Quimica y Minera(SQM)
- Yara International
第7章 CEO 面臨的關鍵策略問題
第8章附錄
- 世界概況
- 概述
- 波特的五力框架
- 全球價值鏈分析
- 市場動態(DRO)
- 來源和參考文獻
- 表格和圖形列表
- 重要見解
- 資料包
- 詞彙表
簡介目錄
Product Code: 92582
The Global Nitrogenous Fertilizer Market size is estimated at USD 165.78 billion in 2024, and is expected to reach USD 231.57 billion by 2030, growing at a CAGR of 5.73% during the forecast period (2024-2030).
Key Highlights
- Fastest growing segment by Type - Anhydrous Ammonia : Anhydrous ammonia has a nitrogen content of 82%, which is the highest among all nitrogenous fertilizers. This product is most suitable for high nitrogen-consuming crops.
- Largest Segment by Crop Type - Field Crops : Field crops are widely cultivated worldwide and are a staple food in many parts of the world. They account for a maximum share by area in most agricultural countries.
- Largest Segment by Application Mode - Soil : Soil application is a convenient way of applying fertilizers without any equipment. This method of application helps in improving both plant health and soil fertility.
- Largest segment by Country - India : India is the 2nd largest consumer of fertilizers globally with a consumption volume of 70 million metric ton in 2021 of which Urea accounts for 60% of the overall consumption.
Nitrogenous Fertilizer Market Trends
Urea is the largest segment by Product.
- Urea is the most important and most used nitrogenous fertilizer. In the year 2022, it accounted for 62.5% of the total consumption of nitrogenous fertilizers globally. The global urea market was valued at USD 45.5 billion in 2021, with a volume consumption of 114.7 million metric tons in the same year.
- Anhydrous ammonia has the highest percentage of nitrogen content (82.0%) among all nitrogenous fertilizers, with readily available nitrogen in the form of NH3. The global market for anhydrous ammonia was valued at USD 1.36 billion in the year 2021, with a volume consumption of 2.8 million metric tons. However, the usage of anhydrous ammonia as a fertilizer is restricted to the countries in North America and is commonly used in the region's corn belts since it is a high nitrogen-consuming crop.
- Ammonium nitrate accounted for 6.8% (by value) and 10.0% (by volume consumption) among nitrogenous fertilizers in 2021. The share in consumption volume decreased by 1.0% from 11.0% in 2017 to 10.0% in 2022, which can be attributed to stringent regulations regarding the transportation, handling, and sale of ammonium nitrate in various parts of the world.
- Moreover, Asia-Pacific was the largest market for nitrogenous fertilizers in 2022. It accounted for a market share of 70.0%. In the Asia-Pacific region, China and India are the two largest consumers owing to their increasing population and large areas under cultivation.
- The global nitrogenous fertilizer market is anticipated to grow during the forecast period as it is the most demanded nutrient.
Asia-Pacific is the largest segment by Region.
- The global nitrogenous fertilizer market was valued at USD 63.4 billion in 2021, with a volume consumption of 183.4 million metric tons in the same year.
- Asia-Pacific is the largest nitrogenous fertilizer-consuming region and held a market share of 56.7% in 2021. China and India are the major agricultural producers in the Asia-Pacific region, and with a large availability of arable land, growing demand for food in line with increasing population, and substantial government financial assistance, the Asia-Pacific nitrogenous fertilizer consumption is expected to increase.
- Europe is the second-largest region for the market and accounted for a share of 19.0% in 2021. In the Rest of Europe regional segment, countries that consume the majority of fertilizers include Poland, Belgium, and Southeastern European countries. The segment accounted for 36.9% in the European nitrogenous fertilizer market, valued at about USD 4.84 billion in 2021. It is anticipated to record a CAGR of 3.7% during the forecast period.
- Europe, is followed by North America and South America with market shares of 12% and 11%, respectively. In North America, the United States accounted for about 82.2% of the total North American nitrogenous fertilizer market, valued at about USD 7.42 billion in 2021. Conventional fertilizers accounted for 63% and specialty fertilizers accounted for about 37.0% of the market value share in 2021.
- Nitrogenous fertilizers are the most important fertilizers in agricultural production. Moreover, an attempt to increase the yield and productivity, despite diminishing cultivated area through intensive cultivation and increased fertilizer application, is expected to boost the global nitrogenous fertilizers market during the forecast period.
Nitrogenous Fertilizer Industry Overview
The Global Nitrogenous Fertilizer Market is moderately consolidated, with the top five companies occupying 48.47%. The major players in this market are CF Industries, Eurochem, IFFCO, Nutrien Limited and Yara International (sorted alphabetically).
Additional Benefits:
- The market estimate (ME) sheet in Excel format
- 3 months of analyst support
TABLE OF CONTENTS
1 EXECUTIVE SUMMARY & KEY FINDINGS
2 REPORT OFFERS
3 INTRODUCTION
- 3.1 Study Assumptions & Market Definition
- 3.2 Scope of the Study
- 3.3 Research Methodology
4 KEY INDUSTRY TRENDS
- 4.1 Acreage Of Major Crop Types
- 4.2 Average Nutrient Application Rates
- 4.3 Regulatory Framework
- 4.4 Value Chain & Distribution Channel Analysis
5 MARKET SEGMENTATION
- 5.1 Product
- 5.1.1 Ammonium Nitrate
- 5.1.2 Anhydrous Ammonia
- 5.1.3 Urea
- 5.1.4 Others
- 5.2 Form
- 5.2.1 Conventional
- 5.2.2 Speciality
- 5.2.2.1 CRF
- 5.2.2.2 Liquid Fertilizer
- 5.2.2.3 SRF
- 5.2.2.4 Water Soluble
- 5.3 Application Mode
- 5.3.1 Fertigation
- 5.3.2 Foliar
- 5.3.3 Soil
- 5.4 Crop Type
- 5.4.1 Field Crops
- 5.4.2 Horticultural Crops
- 5.4.3 Turf & Ornamental
- 5.5 Region
- 5.5.1 Asia-Pacific
- 5.5.1.1 Australia
- 5.5.1.2 Bangladesh
- 5.5.1.3 China
- 5.5.1.4 India
- 5.5.1.5 Indonesia
- 5.5.1.6 Japan
- 5.5.1.7 Pakistan
- 5.5.1.8 Philippines
- 5.5.1.9 Thailand
- 5.5.1.10 Vietnam
- 5.5.1.11 Rest Of Asia-Pacific
- 5.5.2 Europe
- 5.5.2.1 France
- 5.5.2.2 Germany
- 5.5.2.3 Italy
- 5.5.2.4 Netherlands
- 5.5.2.5 Russia
- 5.5.2.6 Spain
- 5.5.2.7 Ukraine
- 5.5.2.8 United Kingdom
- 5.5.2.9 Rest Of Europe
- 5.5.3 Middle East & Africa
- 5.5.3.1 Nigeria
- 5.5.3.2 Saudi Arabia
- 5.5.3.3 South Africa
- 5.5.3.4 Turkey
- 5.5.3.5 Rest Of Middle East & Africa
- 5.5.4 North America
- 5.5.4.1 Canada
- 5.5.4.2 Mexico
- 5.5.4.3 United States
- 5.5.4.4 Rest Of North America
- 5.5.5 South America
- 5.5.5.1 Argentina
- 5.5.5.2 Brazil
- 5.5.5.3 Rest Of South America
- 5.5.1 Asia-Pacific
6 COMPETITIVE LANDSCAPE
- 6.1 Key Strategic Moves
- 6.2 Market Share Analysis
- 6.3 Company Landscape
- 6.4 Company Profiles
- 6.4.1 CF Industries
- 6.4.2 Compo Expert
- 6.4.3 Coromandel International Ltd.
- 6.4.4 Eurochem
- 6.4.5 IFFCO
- 6.4.6 Koch Industries
- 6.4.7 Nutrien Limited
- 6.4.8 SABIC
- 6.4.9 Sociedad Quimica y Minera (SQM)
- 6.4.10 Yara International
7 KEY STRATEGIC QUESTIONS FOR FERTILIZER CEOS
8 APPENDIX
- 8.1 Global Overview
- 8.1.1 Overview
- 8.1.2 Porter's Five Forces Framework
- 8.1.3 Global Value Chain Analysis
- 8.1.4 Market Dynamics (DROs)
- 8.2 Sources & References
- 8.3 List of Tables & Figures
- 8.4 Primary Insights
- 8.5 Data Pack
- 8.6 Glossary of Terms


