


 |
市場調查報告書
商品編碼
1440323
共享辦公空間:市場佔有率分析、產業趨勢與統計、成長預測(2024-2029)Shared Office Spaces - Market Share Analysis, Industry Trends & Statistics, Growth Forecasts (2024 - 2029) |
||||||
※ 本網頁內容可能與最新版本有所差異。詳細情況請與我們聯繫。
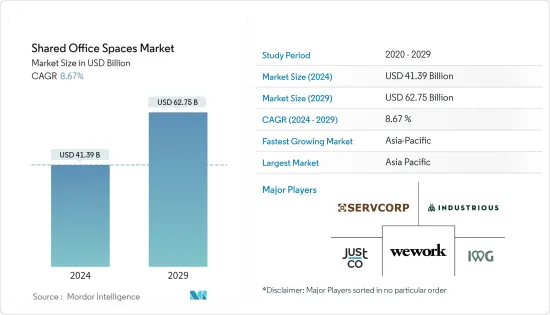
2024年共享辦公空間市場規模預計為413.9億美元,預計到2029年將達到627.5億美元,在預測期內(2024-2029年)成長8.67%,年複合成長率成長。
主要亮點
- 儘管雇主採取各種哄騙、安撫和勒索手段讓員工重返辦公室,但大流行時代的遠距工作熱潮本質上仍將持續下去。曾經熙熙攘攘的商業建築中的員工越來越少,而隨時隨地工作的動態對傳統辦公產業來說是不健康的。相較之下,共用工作空間產業的整體前景相對光明。大量客戶正在離開長期租賃空間。在後疫情時代,共享辦公空間應該會繼續蓬勃發展,特別是在傳統辦公室失寵和大型物業建設下降的情況下。
- 根據2018年至2022年的歷史資料,預計到年終,全球共享辦公空間總數將達到約42,000個。這意味著未來幾年將會出現更多的共享辦公室業務,從而加劇現有公司和公司的競爭。新的市場參與者。這項關鍵統計數據對於評估當前的共享辦公室形勢至關重要,並為該行業的未來前景提供了寶貴的見解。這凸顯了共享辦公室作為適應多樣化工作要求的可行選擇擴大被採用,並凸顯了它重塑人們職業生涯方式的潛力。
- 在整個共同工作形勢,全球這些動態工作空間的平均容量約為 83 人。深入挖掘地區差異,美國的共同工作空間平均可容納 105 人,這表明有容納更大社區的潛力。亞洲在平均入住率方面處於領先地位,每個共享辦公空間達到驚人的 114 人,而南美洲的平均入住率相對較低,為 54 人,整個非洲大陸的聯合辦公空間反映了趨勢的多樣化形勢。
- 亞太地區擁有 11,000 個共享辦公空間,位居世界領先地位。亞太地區佔全球共享辦公空間的三分之一以上。目前,共同工作企業最大的市場是亞太地區,但共享辦公空間在英國(尤其是倫敦)最受歡迎,在北美等地區也越來越受歡迎。北美擁有最多的共享辦公空間,平均面積為 9,799 平方英尺,其次是亞洲(8,101 平方英尺)和歐洲(7,244 平方英尺)。
共享辦公空間市場趨勢
共享辦公空間成員數量增加
當人們離開家時,他們正在尋找有吸引力且更高品質的職場體驗。共享辦公空間的表現非常好,因為人們明確表示他們更喜歡這種工作方式。共享辦公空間提供了一個靈活的工作環境,讓人們可以在方便的時候工作。與傳統辦公室不同,共享辦公空間提供 24/7 全天候訪問,允許成員按照自己的意願隨時隨地工作。預計到 2023 年,將有約 507 萬人成為共享辦公空間的成員。越來越多的人利用共享辦公,證明了它所提供的眾多好處,並證實了它有潛力深刻塑造未來的工作方式。
共享辦公空間的使用是由不同的使用者群體推動的,其中自由工作者佔使用者的 37%,其次是企業家(24%)和小型企業(21%)。在這些群體中,自由工作者已成為最主要的用戶,凸顯了他們對共享辦公空間的強烈親和性。多年來,從事共享辦公室的女性人數穩定增加,性別差距正逐漸縮小。儘管目前的比例仍低於50%的目標,但令人鼓舞的消息是,這一趨勢繼續呈現積極勢頭,加入共享辦公室運動的女性人數逐年增加。
美國引領共享辦公空間產業
美國擁有全球 18.3% 的共同工作空間。過去十年,美國共享辦公空間的數量穩定增加。 2007年,美國祇有14個共享辦公空間,而2017年有4,000個,預計到2022年將有超過6,200個共享辦公空間。 2015年,美國約有33.1萬人使用共享辦公空間,到2022年這數字將增加約108萬人。空間最常見於紐約或洛杉磯等大城市,或舊金山或西雅圖等科技或創新產業突出的城市。曼哈頓是迄今為止最大的共享辦公空間單一市場,而哥倫比亞特區是成長最快的州。洛杉磯是美國共享辦公空間價格最高的城市。
根據 Coworking Resources 的數據,美國的平均空間面積約為 14,000 平方英尺。 International Workplace Group (IWG) 和 WeWork 是美國辦公空間的兩大主要提供者。 2022 年 8 月,WeWork 報告運轉率達到 72%,最終與年終大流行前的數字持平。 IWG 是全球彈性工作空間網路,其客戶包括思科、Uber 和微軟,宣布運轉率人數增加 200 萬人。隨著許多遠距工作人員離開大城市,IWG 擴大了工作地點列表,將田納西州柯達和新罕布什爾州貝德福德等美國較小城鎮涵蓋其中。該公司已計劃於 2022 年在美國開設 50 多家店,並計劃於 2023 年再增加 1,000 家門市。
研究表明,美國70% 的共同工作空間都以有趣的職場環境作為賣點。職場氛圍作為共享辦公空間的賣點至少在美國是獨一無二的,70% 的國家的共同工作空間將此作為賣點,高於全球平均水平。優越的位置、有吸引力的設計和設施、充滿活力的社區、優質的服務、低廉的價格、眾多的活動、免費停車、可通往多個地點、網際網路速度以及對健康的重視,使美國成為您工作空間的另一個賣點。
共享辦公空間產業概況
股權辦公空間市場本質上是分散的,市場上有多個參與者。 WeWork、IWG Group、JustCo、Servcorp Limited、Industrious 是市場上的一些主要企業。由於一二線城市的租金上漲,許多小型企業和企業家開始選擇共享辦公空間,以便以更便宜的價格獲得更好的設施。全球對共享辦公空間的需求正在迅速成長。
雖然像 WeWork 這樣的行業領導者蓬勃發展,但對共享辦公空間的需求熱潮正在蔓延到其他行業,任何以設計為中心的空間都可以成為共享辦公空間。這是有可能的。例如,Serendipity Labs 與飯店合作開發共同工作特許經營專利權。圖書館、咖啡館和傳統商業建築也擴大提供共享辦公設施和空間。此外,傳統共同工作企業和辦公室套件企業不斷擴張,競爭將加劇。
這種競爭將以多種方式影響共享辦公室產業,但最顯著的影響將是空間正常運作的壓力增加。在不斷發展的產業中,競爭加劇是很自然的。缺點是一些行業參與者受傷或倒閉。未來幾年我們可能會看到更多的共享辦公空間失敗。
其他福利
- Excel 格式的市場預測 (ME) 表
- 3 個月分析師支持
目錄
第1章 簡介
- 研究假設和市場定義
- 調查範圍
第2章調查方法
第3章執行摘要
第4章市場洞察
- 市場概況
- 政府法規和舉措
- 產業價值鏈/供應鏈分析
- 科技趨勢
- 深入了解共享辦公空間的成本
- 對共享辦公室Start-Ups的見解
- COVID-19 對市場的影響
第5章市場動態
- 促進因素
- 更多採用遠距和混合工作模式
- 抑制因素
- 缺乏隱私
- 機會
- 利基共享辦公空間
- 產業吸引力-波特五力分析
- 供應商的議價能力
- 買家/消費者的議價能力
- 新進入者的威脅
- 替代品的威脅
- 競爭公司之間的敵意強度
第6章市場區隔
- 按類型
- 傳統的
- 公司
- 奢華
- 其他類型
- 按最終用途
- 資訊科技(IT 和 ITES)
- 法律服務
- BFSI(銀行、金融服務和保險)
- 諮詢
- 其他服務
- 按用戶
- 自由工作者
- 公司
- 其他用戶
- 按地區
- 北美洲
- 美國
- 加拿大
- 墨西哥
- 亞太地區
- 印度
- 中國
- 新加坡
- 日本
- 韓國
- 越南
- 澳洲
- 其他亞太地區
- 歐洲
- 德國
- 英國
- 西班牙
- 法國
- 義大利
- 其他歐洲國家
- 中東和非洲
- 阿拉伯聯合大公國
- 沙烏地阿拉伯
- 埃及
- 其他中東和非洲
- 世界其他地區
- 北美洲
第7章 競爭形勢
- 公司簡介
- WeWork
- IWG Group
- JustCo
- Servcorp Limited
- Industrious
- The Great Room
- Regus
- Simpliwork
- Distrii
- District Cowork
- Convene*
第8章市場的未來
第9章 附錄
The Shared Office Spaces Market size is estimated at USD 41.39 billion in 2024, and is expected to reach USD 62.75 billion by 2029, growing at a CAGR of 8.67% during the forecast period (2024-2029).
Key Highlights
- The pandemic-era boom in remote work is fundamentally intact, despite all manner of coaxing, cajoling and threatening by employers to get workers back into the office. The work from anywhere dynamic is unhealthy for the traditional office sector, with fewer employees utilizing once-bustling commercial buildings. In contrast, the future is relatively bright for the shared workspace sector as a whole. Enormous numbers of customers are moving out of the long-term lease space. Co-working spaces should continue to flourish in the post-pandemic era, especially as traditional offices fall out of favor, and fewer large-scale properties get built.
- Based on historical data from 2018 through 2022, the total number of coworking spaces is set to reach nearly 42,000 worldwide by the end of 2024. This means that more and more coworking businesses will appear in the next years, bringing in more competition for incumbents and new market players. This significant statistic holds great significance in assessing the present landscape of coworking, offering valuable foresight into the industry's promising future prospects. It underscores the increasing adoption of coworking as a viable choice for diverse work requirements and highlights its potential to reshape the way people approach their professional endeavors.
- Across the coworking landscape, the average capacity of these dynamic workspaces stands at approximately 83 individuals worldwide. Delving deeper into regional variations, coworking spaces in the United States boast an average capacity of 105 people, signalling their potential to accommodate larger communities. While Asia takes the lead in terms of average capacity, accommodating an impressive 114 people per coworking space, South America showcases a comparatively lower average of 54 individuals, reflecting the diverse landscape of coworking trends in different continents.
- Asia-Pacific region has become a global leader with 11,000 co-working spaces. Asia-Pacific accounts for more than one-third of all global coworking spaces. Although the biggest market for coworking businesses is currently the APAC region, coworking spaces are most popular in the U.K., London in particular, and are becoming increasingly popular in regions like North America. North America has the largest coworking space area with an average size of 9,799 sq. ft. followed by Asia (8,101 sq. ft.) and Europe (7,244 sq. ft.).
Shared Office Spaces Market Trends
Increasing Number of Co-working Space Members
If people are leaving their house, they're looking for somewhere engaging, higher quality workplace experience. Shared office space is doing really well because people have revealed a preference for working this way. Coworking spaces offer a flexible work environment, allowing people to work on their own terms. Unlike traditional offices, coworking spaces offer 24/7 access, allowing members to work when they want, how they want. In the year 2023, it is projected that approximately 5.07 million individuals will join the ranks of coworking space members. The rising number of people embracing coworking is a testament to the numerous advantages it offers, underscoring its potential to shape the future of work significantly.
The utilization of coworking spaces is driven by distinct user groups, with freelancers accounting for 37% of the users, followed by entrepreneurs comprising 24%, and SMEs representing 21%. Among these groups, freelancers emerge as the most predominant users, highlighting their strong affinity towards coworking spaces. Over the years, there has been a steady rise in the number of women engaging in coworking, gradually bridging the gender gap. While the current percentage remains below the desired 50%, the encouraging news is that the trend continues to show positive momentum, welcoming an increasing number of women to the coworking movement with each passing year.
United States Leads the Shared Office Space Industry
The US has 18.3% of the world's coworking spaces. The number of coworking spaces in the United States has been steadily increasing over the last decade. There were only 14 coworking spaces in the U.S. in 2007, 4000 in 2017, and over 6,200 estimated coworking spaces by 2022. In 2015, there were about 331,000 people using coworking spaces in the U.S. This number grew to approximately 1.08 million in 2022. Coworking spaces are most common in the very large cities, such as New York and Los Angeles, or cities with prominent technology and creative industries, such as San Francisco and Seattle. Manhattan is by far the largest single market for coworking spaces, while District of Columbia was the fastest growing state. Los Angeles is the most expensive U.S. city for coworking space.
According to Coworking Resources, the average space size in the US is about 14,000 sq ft. International Workplace Group (IWG) and WeWork are the two main providers of coworking space in the United States. In August 2022, WeWork reported its occupancy levels reached 72%, finally matching pre-pandemic numbers from the end of 2019. IWG, a global flexible-workspace network whose customers include Cisco, Uber, Microsoft, and more, says it added 2 million new members in 2021. Since many remote workers have ventured away from big cities, IWG is expanding its list of locations to include smaller U.S. towns like Kodak, Tennessee, and Bedford, New Hampshire. The company has already signed deals for more than 50 upcoming locations in the U.S. in 2022 and plans to add another 1,000 locations in 2023.
An enjoyable work atmosphere is a selling point for 70% of coworking spaces in the U.S., according to a survey. Work atmosphere as a selling point for a coworking space is at least somewhat unique to the U.S., as 70% of the country's coworking spaces that reported this as a selling point is at or above the global average. Well-situated location, attractive design and fit-out, thriving community, good service, low prices, many events, free parking, multi-location access, internet speed, wellness emphasis are some additional selling points for U.S. coworking spaces.
Shared Office Spaces Industry Overview
The shares office space market is fragmented in nature with a presence of several players in the market. WeWork, IWG Group, JustCo, Servcorp Limited, Industrious are some of the major players in the market. With the rising cost of rents in tier 1 and tier 2 cities, many SMEs and entrepreneurs are choosing coworking spaces to gain access to better facilities at a cheaper cost. There is a booming demand for shared office spaces globally.
While industry leaders like WeWork are thriving, the boom in demand for co-working spaces is spilling over into other industries, where any design-focused space can become a co-working venue. Serendipity Labs, for example, is working with hotels on coworking franchises. Libraries, coffee shops and traditional commercial buildings are also adding more coworking like amenities and spaces. And, of course, the traditional coworking and office suite companies continue to expand. The result of all this is increased competition.
This competition will impact the coworking industry in a variety of ways, with a big one being increased pressure on spaces to execute well. Increasing competition is normal in growing industries. The downside is some industry participants get hurt or even go out of business. We will likely see more coworking space failures over the next couple years.
Additional Benefits:
- The market estimate (ME) sheet in Excel format
- 3 months of analyst support
TABLE OF CONTENTS
1 INTRODUCTION
- 1.1 Study Assumptions and Market Definition
- 1.2 Scope of the Study
2 RESEARCH METHODOLOGY
3 EXECUTIVE SUMMARY
4 MARKET INSIGHTS
- 4.1 Market Overview
- 4.2 Government Regulations and Initiatives
- 4.3 Industry Value Chain/Supply Chain Analysis
- 4.4 Technological Trends
- 4.5 Insights on Shared Office Spaces Cost
- 4.6 Insights on Co-working Startups
- 4.7 Impact of COVID-19 on the Market
5 MARKET DYNAMICS
- 5.1 Drivers
- 5.1.1 Increasing Adoption of Remote and Hybrid Work Model
- 5.2 Restraints
- 5.2.1 Lack of Privacy
- 5.3 Opportunities
- 5.3.1 Niche Coworking Spaces
- 5.4 Industry Attractiveness - Porter's Five Forces Analysis
- 5.4.1 Bargaining Power of Suppliers
- 5.4.2 Bargvaining Power of Buyers/Consumers
- 5.4.3 Threat of New Entrants
- 5.4.4 Threat of Substitutes
- 5.4.5 Intensity of Competitive Rivalry
6 MARKET SEGMENTATION
- 6.1 By Type
- 6.1.1 Conventional
- 6.1.2 Corporate
- 6.1.3 Luxury
- 6.1.4 Other Types
- 6.2 By End Use
- 6.2.1 Information Technology (IT and ITES)
- 6.2.2 Legal Services
- 6.2.3 BFSI (Banking, Financial Services, and Insurance)
- 6.2.4 Consulting
- 6.2.5 Other Services
- 6.3 By User
- 6.3.1 Freelancers
- 6.3.2 Enterprises
- 6.3.3 Other Users
- 6.4 By Geography
- 6.4.1 North America
- 6.4.1.1 United States
- 6.4.1.2 Canada
- 6.4.1.3 Mexico
- 6.4.2 Asia-Pacific
- 6.4.2.1 India
- 6.4.2.2 China
- 6.4.2.3 Singapore
- 6.4.2.4 Japan
- 6.4.2.5 South Korea
- 6.4.2.6 Vietnam
- 6.4.2.7 Australia
- 6.4.2.8 Rest of Asia-Pacific
- 6.4.3 Europe
- 6.4.3.1 Germany
- 6.4.3.2 United Kingdom
- 6.4.3.3 Spain
- 6.4.3.4 France
- 6.4.3.5 Italy
- 6.4.3.6 Rest of Europe
- 6.4.4 Middle East & Africa
- 6.4.4.1 United Arab Emirates
- 6.4.4.2 Saudi Arabia
- 6.4.4.3 Egypt
- 6.4.4.4 Rest of Middle East and Africa
- 6.4.5 Rest of the world
- 6.4.1 North America
7 COMPETITIVE LANDSCAPE
- 7.1 Overview (Market Concentration and Major Players)
- 7.2 Company Profiles
- 7.2.1 WeWork
- 7.2.2 IWG Group
- 7.2.3 JustCo
- 7.2.4 Servcorp Limited
- 7.2.5 Industrious
- 7.2.6 The Great Room
- 7.2.7 Regus
- 7.2.8 Simpliwork
- 7.2.9 Distrii
- 7.2.10 District Cowork
- 7.2.11 Convene*
8 FUTURE OF THE MARKET
9 APPENDIX
 2024 年共享辦公空間世界市場報告
 共享辦公空間管理軟體市場報告:2030 年趨勢、預測與競爭分析
 共享辦公空間市場、份額、規模、趨勢、產業分析報告:按類型、應用、產業、地區、細分市場預測,2024-2032年
 共享辦公空間市場規模、佔有率、趨勢分析報告:按類型、用途、產業、地區和細分市場預測,2023-2030 年
 辦公空間市場:按類型、銷售類型和最終用戶分類:2023-2032 年全球機會分析和產業預測
 聯合辦公空間市場:按業務類型、最終用戶分類 - 2023-2030 年全球預測
 全球辦公空間市場 - COVID-19 的增長、趨勢、影響和預測 (2023-2028)
 共享辦公空間的全球市場 2023-2027