


 |
市場調查報告書
商品編碼
1438335
氰化鈉:市場佔有率分析、產業趨勢與統計、成長預測(2024-2029)Sodium Cyanide - Market Share Analysis, Industry Trends & Statistics, Growth Forecasts (2024 - 2029) |
||||||
※ 本網頁內容可能與最新版本有所差異。詳細情況請與我們聯繫。
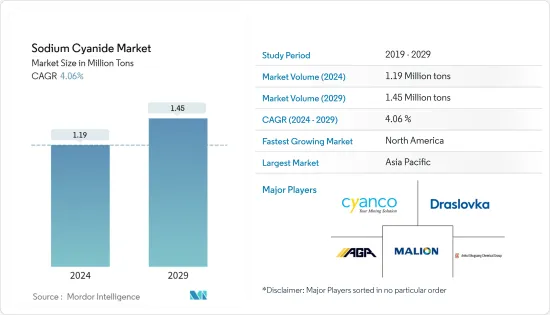
氰化鈉市場規模預計2024年為119萬噸,預計2029年將達到145萬噸,在預測期間(2024-2029年)複合年成長率為4.06%。
COVID-19對全球氰化鈉市場的影響幾乎被抵消,市場已達到疫情前的水平。
主要亮點
- 從中期來看,推動所研究市場成長的主要因素是加拿大和墨西哥採礦活動的增加以及金礦開採業的需求。
- 另一方面,氰化鈉的毒性和金提取替代品的開發正在阻礙所研究市場的成長。
- 預計新礦山的發現將在預測期內為市場參與者提供利潤豐厚的機會。
- 由於該地區採礦活動的擴張,以及最終用戶行業的強勁需求推動了成長,亞太地區主導了市場。
氰化鈉市場趨勢
採礦業主導市場需求
- 全世界生產的大部分氰化鈉用於採礦和冶金,特別是金銀的提取。它是最經濟可行、易於加工且環境永續的黃金加工技術之一。
- 通常透過使用氰化鈉浸出從礦石中提取金。使用工業機械將礦石磨成細粉。然後將粉塵加入氰化鈉溶液 (NaCN) 中進行處理。
- 2022年,加拿大躋身四大黃金生產國之列,落後中國、澳洲和俄羅斯。根據美國地質調查局統計,該國2022年產量約220噸,約佔全球產量的7%。產量增加主要是由於 Detour Lake、Canadian Malartic、Meadowbank Complex、Meliadine、Eagle Gold 和 Young Davidson 礦的產量增加。
- 多家主要礦業公司都在尋求在加拿大擴張,加拿大正在進行一些高級計劃,並進行可行性研究,為未來的投資做準備。此外,加拿大政府正在採取各種措施吸引更多投資者開發未開發的礦產資源。
- 除北美外,非洲礦產資源豐富,是世界礦業之都。除礦業大國南非外,加納、馬利共和國、布吉納法索等國礦業發展迅速。
- 所有上述原因將促使採礦業在預測期內主導氰化鈉市場。
亞太地區主導市場
- 亞太地區主導了全球市場佔有率。黃金開採和化學工業的強勁需求促使亞太地區(主要是中國)對氰化鈉的需求快速成長。
- 中國是最大的黃金生產國,約佔全球黃金產量的9%。根據世界黃金協會的數據,中國的礦場產量增加了 42 噸(13%),達到 374 噸。在此之際,山東省的採礦業在 2021 年大部分時間出現大規模安全停電後已恢復正常。
- 此外,中國也是第二大銅、礬土、錳、鈷和銀生產國。它還生產寶石鑽石、鉻和木材。
- 這些因素可能會增加預測期內中國對氰化鈉的需求。
- 根據美國地質調查局報告,2022年澳洲黃金產業生產了320噸礦金,與前一年同期比較增1.5%。據估計,該國的產量將很快超過中國,這主要是由於擴張計劃。
- 此外,由於印尼持有豐富的礦產資源,政府正在透過為國內外投資者提供有吸引力的機會來促進投資。目標礦物包括金、礬土、銅、銀和錫,但主要是鎳(由於其在電池技術中的使用越來越多)。
- 因此,由於該地區的所有此類應用和強勁的需求,預計亞太地區將成為預測期內最大的市場。
氰化鈉產業概況
氰化鈉市場整合,前10家企業產能佔有率佔比超過60%。市場上著名的參與者包括(排名不分先後)Cyanco International LLC、Malion New Materials、Draslovka、Australian Gold Reagents Pty Ltd 和安徽曙光化工集團。
其他福利
- Excel 格式的市場預測 (ME) 表
- 3 個月分析師支持
目錄
第1章簡介
- 調查先決條件
- 調查範圍
第2章調查方法
第3章執行摘要
第4章市場動態
- 促進因素
- 金礦開採業的高需求
- 加拿大和墨西哥的採礦活動增加
- 其他司機
- 抑制因素
- 氰化鈉毒性
- 開發金提取替代品
- 產業價值鏈分析
- 波特五力分析
- 供應商的議價能力
- 消費者議價能力
- 新進入者的威脅
- 替代產品和服務的威脅
- 競爭程度
第5章市場區隔
- 最終用戶產業
- 礦業
- 化學品
- 其他最終用戶產業
- 地區
- 亞太地區
- 中國
- 澳洲和紐西蘭
- 印尼
- 其他亞太地區
- 北美洲
- 美國
- 加拿大
- 墨西哥
- 歐洲
- 俄羅斯
- 獨立國協國家(不包括俄羅斯)
- 其他歐洲國家
- 南美洲
- 巴西
- 阿根廷
- 秘魯
- 南美洲其他地區
- 中東和非洲
- 迦納
- 蘇丹
- 南非
- 其他中東和非洲
- 亞太地區
第6章 競爭形勢
- 併購、合資、合作與協議
- 市場佔有率(%)**/排名分析
- 主要企業採取的策略
- 公司簡介
- Anhui Shuguang Chemical Group
- Australian Gold Reagents Pty Ltd
- Changsha Hekang Chemical Co. Ltd
- Cyanco International LLC
- Cyplus Gmbh
- Draslovka
- Hebei Chengxin Group Co. Ltd
- Jincheng Hongsheng Chemical Co. Ltd
- Orica Limited
- Taekwang Industrial Co. Ltd
- Tongsuh Petrochemical Corp. Ltd(Asahi Kasei Corporation)
- Unigel
- Ynnovate Sanzheng(Yingkou)Fine Chemicals Co. Ltd
第7章市場機會與未來趨勢
- 發現新礦
The Sodium Cyanide Market size is estimated at 1.19 Million tons in 2024, and is expected to reach 1.45 Million tons by 2029, growing at a CAGR of 4.06% during the forecast period (2024-2029).
The impact of COVID-19 on the global sodium cyanide market was largely negated, and the market now reached the pre-pandemic levels.
Key Highlights
- Over the medium term, the major factors driving the studied market's growth are the increasing mining activities in Canada and Mexico and the demand from the gold mining industry.
- On the flip side, the toxicity of sodium cyanide and the development of substitutes for gold extraction hampers the growth of the market studied.
- The discovery of new mines is projected to offer lucrative opportunities to the market players during the forecast period.
- Due to the growing mining activities in the region, Asia-Pacific dominated the market, and robust demand from the end-user industry fuelled the growth.
Sodium Cyanide Market Trends
Mining Segment to Dominate the Market Demand
- A major portion of the sodium cyanide produced worldwide is used in mining and metallurgy, especially in extracting gold and silver. It is one of the most economically viable, easily processable, and environmentally sustainable technologies for gold processing.
- Typically, gold is extracted from its ore using sodium cyanide through leeching. The ore is crushed into a fine powder using industrial machinery. Then, the dust is added to a sodium cyanide solution (NaCN) and allowed to process.
- Canada is among the top four gold producers in 2022, behind China, Australia, and Russia. As per the USGS statistics, the country's production stood at around 220 tons in 2022, representing around 7% of global production. The production growth was mainly due to increased output at the Detour Lake, Canadian Malartic, Meadowbank Complex, Meliadine, Eagle Gold, and Young-Davidson mines.
- Various large mining companies are seeking exposure in Canada, and several advanced projects with feasibility studies are taking place in the country for future investment. Moreover, the Government of Canada is taking various initiatives to attract more investors to develop untapped mineral resources.
- Apart from the North American region, Africa contains abundant mineral sources, making it a hub for the global mining industry. Apart from South Africa, a major mining industry, countries like Ghana, Mali, and Burkina Faso, include rapidly growing mining industries.
- All the above reasons are responsible for the mining segment to dominate the sodium cyanide market in the forecast period.
Asia-Pacific Region to Dominate the Market
- The Asia-Pacific region dominated the global market share. With the robust demand from the gold extraction and chemical industry, the demand for sodium cyanide in Asia-Pacific, primarily in China, increased faster.
- China is the largest producer of gold, with a share of about 9% of the total gold produced worldwide. According to the World Gold Council, mine production in China increased by 42 tons (13%) to 374 tons. It is because mining in Shandong province returned to normal following widespread safety stoppages for most of 2021.
- Besides, China is the second-largest producer of copper, bauxite, manganese, cobalt, and silver. It also produces gem diamonds, chromium, and timber.
- Such factors will likely boost the demand for sodium cyanide in China during the forecast period.
- According to the USGS Report, Australia's gold industry produced 320 tons of mined gold in 2022, up by 1.5% year-on-year. The country is estimated to overgrow China in production shortly, primarily due to the expansion plans.
- Moreover, as Indonesia holds immense mineral reserves, the government is promoting investments by offering domestic and foreign investors attractive opportunities. Some of the target minerals include gold, bauxite, copper, silver, tin, and, majorly, nickel (owing to its growing applications in battery technology).
- Hence, with all such applications and robust demand in the region, Asia-Pacific is expected to be the largest market during the forecast period.
Sodium Cyanide Industry Overview
The sodium cyanide market is consolidated, with the top 10 players accounting for over 60% of the share in production capacities. Some of the noticeable players in the market (not in any particular order) include Cyanco International LLC, Malion New Materials, Draslovka, Australian Gold Reagents Pty Ltd., and Anhui Shuguang Chemical Group.
Additional Benefits:
- The market estimate (ME) sheet in Excel format
- 3 months of analyst support
TABLE OF CONTENTS
1 INTRODUCTION
- 1.1 Study Assumptions
- 1.2 Scope of the Study
2 RESEARCH METHODOLOGY
3 EXECUTIVE SUMMARY
4 MARKET DYNAMICS
- 4.1 Drivers
- 4.1.1 High Demand from the Gold Mining Industry
- 4.1.2 Increasing Mining Activities in Canada and Mexico
- 4.1.3 Other Drivers
- 4.2 Restraints
- 4.2.1 Toxicity of Sodium Cyanide
- 4.2.2 Development of Substitute for Gold Extraction
- 4.3 Industry Value Chain Analysis
- 4.4 Porter's Five Forces Analysis
- 4.4.1 Bargaining Power of Suppliers
- 4.4.2 Bargaining Power of Consumers
- 4.4.3 Threat of New Entrants
- 4.4.4 Threat of Substitute Products and Services
- 4.4.5 Degree of Competition
5 MARKET SEGMENTATION
- 5.1 End-user Industry
- 5.1.1 Mining
- 5.1.2 Chemical
- 5.1.3 Other End-user Industries
- 5.2 Geography
- 5.2.1 Asia-Pacific
- 5.2.1.1 China
- 5.2.1.2 Australia & New Zealand
- 5.2.1.3 Indonesia
- 5.2.1.4 Rest of Asia-Pacific
- 5.2.2 North America
- 5.2.2.1 United States
- 5.2.2.2 Canada
- 5.2.2.3 Mexico
- 5.2.3 Europe
- 5.2.3.1 Russia
- 5.2.3.2 CIS Countries (Excluding Russia)
- 5.2.3.3 Rest of Europe
- 5.2.4 South America
- 5.2.4.1 Brazil
- 5.2.4.2 Argentina
- 5.2.4.3 Peru
- 5.2.4.4 Rest of South America
- 5.2.5 Middle-East and Africa
- 5.2.5.1 Ghana
- 5.2.5.2 Sudan
- 5.2.5.3 South Africa
- 5.2.5.4 Rest of Middle-East and Africa
- 5.2.1 Asia-Pacific
6 COMPETITIVE LANDSCAPE
- 6.1 Mergers and Acquisitions, Joint Ventures, Collaborations, and Agreements
- 6.2 Market Share(%)**/Ranking Analysis
- 6.3 Strategies Adopted by Leading Players
- 6.4 Company Profiles
- 6.4.1 Anhui Shuguang Chemical Group
- 6.4.2 Australian Gold Reagents Pty Ltd
- 6.4.3 Changsha Hekang Chemical Co. Ltd
- 6.4.4 Cyanco International LLC
- 6.4.5 Cyplus Gmbh
- 6.4.6 Draslovka
- 6.4.7 Hebei Chengxin Group Co. Ltd
- 6.4.8 Jincheng Hongsheng Chemical Co. Ltd
- 6.4.9 Orica Limited
- 6.4.10 Taekwang Industrial Co. Ltd
- 6.4.11 Tongsuh Petrochemical Corp. Ltd (Asahi Kasei Corporation)
- 6.4.12 Unigel
- 6.4.13 Ynnovate Sanzheng (Yingkou) Fine Chemicals Co. Ltd
7 MARKET OPPORTUNITIES AND FUTURE TRENDS
- 7.1 Discovery of New Mines


