


 |
市場調查報告書
商品編碼
1434286
可變工作技術:市場佔有率分析、產業趨勢/統計、成長預測(2024-2029)Variable Rate Technology - Market Share Analysis, Industry Trends & Statistics, Growth Forecasts (2024 - 2029) |
||||||
※ 本網頁內容可能與最新版本有所差異。詳細情況請與我們聯繫。
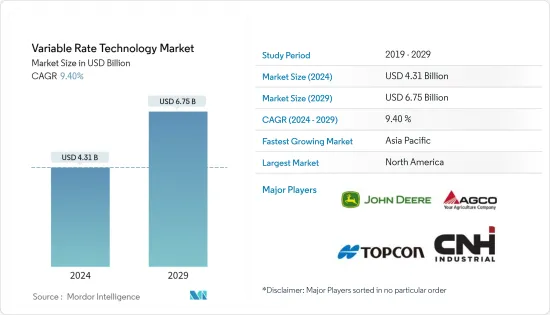
2024年可變工作技術市場規模預計為43.1億美元,預計到2029年將達到67.5億美元,在預測期內(2024-2029年)成長9.40%,以複合年成長率成長。
從目前的產業市場動態來看,即使在美國等已開發國家,可變利率技術的採用率仍然很低。世界各地農學家正在進行的研究表明,可變比率技術對作物產量有正面影響,有助於降低成本、增加產量和提高投入效率。因此,人們對採用浮動利率應用程式的經濟效益的認知不斷提高,可能會在預測期內推動市場發展。
可變工作技術市場趨勢
農業部門更採用數位技術
創新和科技正帶動各領域的重大發展,農業就是其中之一。感測技術、軟體應用、通訊系統、資料分析解決方案、定位技術等是精密農業中使用的一些最新技術。無人機、自動擠乳系統和無人機作物散佈等各種技術為精密農業的發展提供了重要且有吸引力的機會。正如聯合國貿易和發展會議2019年9月指出的那樣,農業數位技術的採用多年來呈現顯著成長。例如,2019年,自動區段控制、可變速率技術、高精度測繪、產量監測、衛星或航空成像、葉綠素感測器的佔有率分別為40%、31%、48%、44%、22%和5 % 。 獲得。各在農業領域。因此,農業部門擴大採用數位技術預計將在預測期內加速可變利率技術市場的成長。
北美引領可變工作技術市場
多年來,數位技術的廣泛採用使得能夠以最低的成本收集大量關鍵資料,使現場工作更具洞察力,並提高生產力和效率。這一點還有待改進。直到最近,可變速率治療應用的影響一直受到所用資料的粒度和及時性以及缺乏日常營運決策支援的限制。然而,根據農業部的數據,超過 60% 的美國農產品分銷商提供某種類型的可變費用技術服務。相較之下,由於收集準確的現場資料的成本相對較高,目前只有不到 20% 的面積採用技術進行管理。因此,美國市場上可變費用處理應用服務的可用性不斷增加可能會在預測期內加速可變費用技術市場的發展。
可變工作技術行業概覽
全球可變工作技術市場是一個利基市場,各種中小企業在全球的佔有率微乎其微。結果,出現了非常激烈的競爭。全球不同地區的區域市場和本土企業的發展是市場區隔的主要驅動力。北美和亞太地區是競爭對手活動最活躍的兩個地區。
其他福利
- Excel 格式的市場預測 (ME) 表
- 3 個月分析師支持
目錄
第1章簡介
- 研究成果
- 研究場所
- 調查範圍
第2章調查方法
第3章執行摘要
第4章市場動態
- 市場概況
- 市場促進因素與市場約束因素介紹
- 市場促進因素
- 市場限制因素
- 產業吸引力-波特五力分析
- 新進入者的威脅
- 買家/消費者的議價能力
- 供應商的議價能力
- 替代品的威脅
- 競爭公司之間敵對關係的強度
第5章市場區隔
- 作物類型
- 穀物/穀類
- 水果和蔬菜
- 油籽和豆類
- 經濟作物
- 目的
- 肥料
- 農藥
- 土壤感
- 產量監控
- 灌溉
- 其他
- 地區
- 北美洲
- 美國
- 加拿大
- 墨西哥
- 其他北美地區
- 歐洲
- 德國
- 英國
- 法國
- 義大利
- 西班牙
- 其他歐洲國家
- 亞太地區
- 中國
- 日本
- 印度
- 韓國
- 其他亞太地區
- 南美洲
- 巴西
- 阿根廷
- 南美洲其他地區
- 中東/非洲
- 南非
- 其他中東和非洲
- 北美洲
第6章 競爭形勢
- 市場佔有率分析
- 最採用的策略
- 公司簡介
- Deere & Company
- Trimble, Inc.
- AGCO Corporation
- Topcon Corporation
- CNH Industrial NV
- Lindsay Corporation
- Ageagle Aerial Systems
- Raven Industries, Inc.
- AG Leader Technology
- Valmont Industries, Inc.
第7章 市場機會及未來趨勢
The Variable Rate Technology Market size is estimated at USD 4.31 billion in 2024, and is expected to reach USD 6.75 billion by 2029, growing at a CAGR of 9.40% during the forecast period (2024-2029).
Referring to the current market dynamics of the industry, the adoption of variable rate technology is still very low even in the developed nations such as the United States. The ongoing studies by the agronomists across the world reveal that variable rate technology can have a positive impact on the crop yield, thereby aiding in the cost reduction, yield enhancement, and enhancement ofinput efficiency. Thus, the increasing awareness of the economic advantages of variable rate application adoption is likely driving the market during the forecast period.
Variable Rate Technology Market Trends
Increasing Adoption of Digital Technologies in the Agricultural Sector
Innovation and technology have led to major developments in various areas and agriculture is one of them. Sensing technologies, software applications, communication systems, data analytics solutions, and positioning technologies are some of the latest technologies used in precision farming. Various technologies, such as driverless machinery, automated milking systems, and drone crop dusters are providing important and attractive opportunities for the growth of precision agriculture. As stated by the United Nations Conference on Trade and Development in September 2019, over the years the adoption status of digital technologies in agriculture has shown a significant rise. For instance, in 2019, automatic section control, variable rate technology, precision maps, yield monitoring, satellite or aerial imaging, and chlorophyll sensors garnered the shares of 40%, 31%, 48%, 44%, 22%, and 5% respectively in the agricultural sector. Thus, the increasing adoption of digital technologies in the agricultural sector is anticipated to accelerate the growth of the variable rate technology market during the forecast period.
North America to Drive the Variable Rate Technology Market
Over the years, the increasing adoption of digital technologies has made it possible to collect huge amounts of critical data at minimal costs, thus making field operations more insight-driven, and potentially more productive and efficient. Until recently, the impact of variable rate treatment application has been limited by the granularity and timeliness of the data they use and their lack of day-to-day operational decision support. However, according to USDA, over 60% of the United States' agricultural input dealers offer some kind of variable-rate technology services. Contrasting to this, less than 20% of the acreage is currently being managed using technology due to the relatively higher costs of gathering precise field data. Thus, the rising availability of the variable rate treatment application services in the United States market is likely to accelerate the variable rate technology market during the forecast period.
Variable Rate Technology Industry Overview
The global variable rate technology market is a niche market, with various small and medium-sized companies coining a very minimal share in the world. This has resulted in very stiff competition. The development of regional markets and local players in different parts of the world is the major factor for the fragmented nature of the market. North America and the Asia Pacific are the two regions showing maximum competitor activities.
Additional Benefits:
- The market estimate (ME) sheet in Excel format
- 3 months of analyst support
TABLE OF CONTENTS
1 INTRODUCTION
- 1.1 Study Deliverables
- 1.2 Study Assumptions
- 1.3 Scope of the Study
2 RESEARCH METHODOLOGY
3 EXECUTIVE SUMMARY
4 MARKET DYNAMICS
- 4.1 Market Overview
- 4.2 Introduction to Market Drivers and Restraints
- 4.3 Market Drivers
- 4.4 Market Restraints
- 4.5 Industry Attractiveness - Porter's Five Force Analysis
- 4.5.1 Threat of New Entrants
- 4.5.2 Bargaining Power of Buyers/Consumers
- 4.5.3 Bargaining Power of Suppliers
- 4.5.4 Threat of Substitute Products
- 4.5.5 Intensity of Competitive Rivalry
5 MARKET SEGMENTATION
- 5.1 Crop Type
- 5.1.1 Cereals & Grains
- 5.1.2 Fruits & Vegetables
- 5.1.3 Oilseeds & Pulses
- 5.1.4 Commercial Crops
- 5.2 Application
- 5.2.1 Fertilizers
- 5.2.2 Crop Protection Chemicals
- 5.2.3 Soil Sensing
- 5.2.4 Yield Monitoring
- 5.2.5 Irrigation
- 5.2.6 Others
- 5.3 Geography
- 5.3.1 North America
- 5.3.1.1 United States
- 5.3.1.2 Canada
- 5.3.1.3 Mexico
- 5.3.1.4 Rest of North America
- 5.3.2 Europe
- 5.3.2.1 Germany
- 5.3.2.2 United Kingdom
- 5.3.2.3 France
- 5.3.2.4 Italy
- 5.3.2.5 Spain
- 5.3.2.6 Rest of Europe
- 5.3.3 Asia Pacific
- 5.3.3.1 China
- 5.3.3.2 Japan
- 5.3.3.3 India
- 5.3.3.4 South Korea
- 5.3.3.5 Rest of Asia-Pacific
- 5.3.4 South America
- 5.3.4.1 Brazil
- 5.3.4.2 Argentina
- 5.3.4.3 Rest of South America
- 5.3.5 Middle East and Africa
- 5.3.5.1 South Africa
- 5.3.5.2 Rest of Middle East and Africa
- 5.3.1 North America
6 COMPETITIVE LANDSCAPE
- 6.1 Market Share Analysis
- 6.2 Most Adopted Strategies
- 6.3 Company Profiles
- 6.3.1 Deere & Company
- 6.3.2 Trimble, Inc.
- 6.3.3 AGCO Corporation
- 6.3.4 Topcon Corporation
- 6.3.5 CNH Industrial N.V.
- 6.3.6 Lindsay Corporation
- 6.3.7 Ageagle Aerial Systems
- 6.3.8 Raven Industries, Inc.
- 6.3.9 AG Leader Technology
- 6.3.10 Valmont Industries, Inc.
7 MARKET OPPORTUNITIES AND FUTURE TRENDS
 可變利率技術 (VRT) 的全球市場
 到 2030 年可變工作技術 (VRT) 市場預測:按類型、作物類型、成分、農場規模、技術、用途和地區進行的全球分析
 可變工作技術市場:按組成部分、按技術、按作物類型、按農場規模、按用途- 2023-2030 年全球預測
 全球可變功技術 (VRT) 市場:市場規模 - 按組件、技術、作物類型、農場規模、應用、地區展望、競爭戰略、細分市場預測 (-2032)
 可變工作技術(VRT)市場規模,份額和趨勢分析2022-2030,按組件(硬件/軟件/服務),技術(基於地圖/基於傳感器),作物類型,農場規模,應用和地區
 可變比率技術的全球市場 (2022-2027年):各用途、技術、解決方案、地區的分析、預測