


 |
市場調查報告書
商品編碼
1431259
生物農藥:市場佔有率分析、產業趨勢與統計、成長預測(2024-2029)Bioinsecticides - Market Share Analysis, Industry Trends & Statistics, Growth Forecasts (2024 - 2029) |
||||||
價格
※ 本網頁內容可能與最新版本有所差異。詳細情況請與我們聯繫。
簡介目錄
生物農藥市場規模預計到2024年為17.3億美元,預計到2029年將達到30.9億美元,在預測期內(2024-2029年)複合年成長率為12.30%。
主要亮點
- 耕作作物是最大的作物類型:世界上種植的主要連作作物有大麥、玉米、小麥、油菜籽、黑麥、向日葵、大豆和水稻。連作作物的主導地位歸因於世界上最大的耕地面積。
- 田間作物是生長最快的作物:生物殺蟲劑是永續的害蟲防治方法。
- 北美是最大的地區:在有機種植增加和化學農藥使用減少的推動下,美國和加拿大主導該地區的生物農藥市場。
- 美國是面積最大的國家:在有機轉型舉措以及對有機和無農藥食品的需求的推動下,可耕作物在 2021 年以 92.6% 的市場佔有率佔據主導地位。
生物殺蟲劑市場趨勢
作物田間作物。
- 生物農藥是從多種來源獲得的天然物質,可有效控制害蟲,同時對非目標生物安全,並且在污水處理廠和自然環境中易於分解。由於這些獨特的特性,生物農藥越來越受到農民和消費者的歡迎。
- 生物農藥市場以連作作物為主,2022年佔全球市場金額的84.0%。大麥、玉米、小麥、油菜籽、黑麥、向日葵、大豆和稻米等主要連作作物是全球種植最廣泛的作物。緊隨其後的是園藝作物,2022 年市場佔有率為 11.8%。
- 全球生物農藥市場以北美為主導,2022年市場佔有率為40.8%,其次是歐洲(33.2%)及亞太地區(17.5%)。全球支持採用生態學和永續農業方法向有機農業過渡,特別著重於減少疫情造成的化肥和農藥的消耗。
- 農藥行動網路 (PAN) 是一個由 600 多個非政府組織、機構和個人組成的全球網路,致力於推廣有害農藥的無害環境和社會公正的普及。 PAN 透過其舉措和計劃,提高人們對農藥有害影響的認知,並促進採用生物農藥作為更安全、更永續的替代品。
- 生物農藥因其獨特的功能和優點,以及消費者對無化學農產品和有機種植食品日益成長的偏好,預計將在全球市場成長,預計市場預測和預測期(2023年~2029年)複合年成長率是12.2%。
北美是最大的地區
- 生物農藥是生物源殺蟲劑,利用真菌、細菌或植物抽取物等微生物對抗抑製作物生長和發育的害蟲。北美、歐洲和亞太地區主導全球生物農藥市場。
- 2022年,北美地區將佔全球生物農藥市場的40.8%(以金額為準計算)。北美國家採取了一定的政策來增加有機農業。例如,在美國,實施了美國的有機農業轉型計畫和區域害蟲綜合防制中心。加拿大透過害蟲管理中心實施了對某些農藥的禁令。在墨西哥,越來越多的人反對使用化學農藥。所有這些努力正在推動該地區的生物農藥市場。
- 歐洲是生物農藥的第二大市場。歐盟(EU)正在推廣有機農業,目標是到2030年該地區25%的農地採用有機農業。作為該策略的一部分,所有成員國必須在 2030 年將化學農藥的使用量減少一半。因此,所有成員國都實施了各自的措施和政策,例如義大利對化學農藥徵收高額稅收。
- 亞太地區是生物農藥的第三大市場。中國和印度佔據亞太生物農藥市場的主要佔有率。中國是全球最大的農藥使用國,計畫在2025年將園藝作物農藥使用量減少10%,水稻、小麥和玉米種植農藥使用量減少5%。全球農藥禁令和有機農業的增加預計將在預測期內推動全球生物農藥市場。
生物農藥產業概況
生物農藥市場較為分散,前五家企業佔比為1.69%。該市場的主要企業為(按字母順序排列)Coromandel International Ltd、Corteva Agriscience、IPL Biologicals Limited、Seipasa SA、Valent Biosciences LLC。
其他福利
- Excel 格式的市場預測 (ME) 表
- 3 個月分析師支持
目錄
第1章執行摘要和主要發現
第2章 檢舉要約
第3章簡介
- 研究假設和市場定義
- 調查範圍
- 調查方法
第4章 產業主要趨勢
- 有機種植面積
- 人均有機產品支出
- 法律規範
- 價值鍊和通路分析
第5章市場區隔
- 作物類型
- 經濟作物
- 園藝作物
- 栽培作物
- 地區
- 非洲
- 按國家/地區
- 埃及
- 奈及利亞
- 南非
- 其他非洲
- 亞太地區
- 按國家/地區
- 澳洲
- 中國
- 印度
- 印尼
- 日本
- 菲律賓
- 泰國
- 越南
- 其他亞太地區
- 歐洲
- 按國家/地區
- 法國
- 德國
- 義大利
- 荷蘭
- 俄羅斯
- 西班牙
- 土耳其
- 英國
- 其他歐洲國家
- 中東
- 按國家/地區
- 伊朗
- 沙烏地阿拉伯
- 其他中東地區
- 北美洲
- 按國家/地區
- 加拿大
- 墨西哥
- 美國
- 北美其他地區
- 南美洲
- 按國家/地區
- 阿根廷
- 巴西
- 南美洲其他地區
- 非洲
第6章 競爭形勢
- 主要策略趨勢
- 市場佔有率分析
- 公司形勢
- 公司簡介
- Andermatt Group AG
- Certis USA LLC
- Coromandel International Ltd
- Corteva Agriscience
- IPL Biologicals Limited
- Jaipur Bio Fertilizers
- Lallemand Inc.
- Seipasa SA
- T.Stanes and Company Limited
- Valent Biosciences LLC
第7章 CEO 面臨的關鍵策略問題
第8章附錄
- 世界概況
- 概述
- 五力分析框架
- 世界價值鏈分析
- 市場動態(DRO)
- 資訊來源和參考文獻
- 圖表列表
- 重要見解
- 資料包
- 詞彙表
簡介目錄
Product Code: 500008
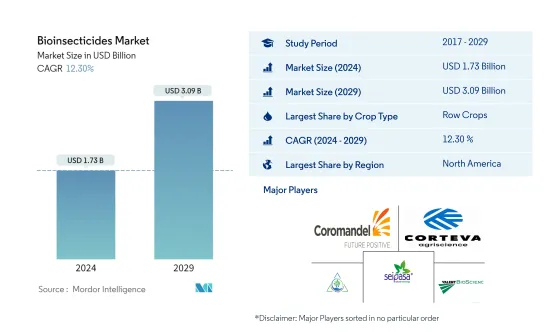
The Bioinsecticides Market size is estimated at USD 1.73 billion in 2024, and is expected to reach USD 3.09 billion by 2029, growing at a CAGR of 12.30% during the forecast period (2024-2029).
Key Highlights
- Row Crops is the Largest Crop Type : The main row crops farmed globally are barley, corn, wheat, rapeseed, rye, sunflower, soybean, and rice. Row crops dominance is due to largest cultivation area globally.
- Row Crops is the Fastest-growing Crop Type : Increased pest pressure is thought to be caused by increasing crop field sizes and decreasing seminatural area; bioinsecticides are a sustainable method of controlling it.
- North America is the Largest Region : United states and Canada are dominating the bioinsecticides market in the region, increased organic cultivation and reducing use of chemical pesticides are driving factors.
- United States is the Largest Country : Row crops are dominating the market with 92.6% in 2021, organic transition initiative and demand for organic and pesticide-free food products driving the market.
Bioinsecticides Market Trends
Row Crops is the largest Crop Type
- Bioinsecticides are natural substances derived from various sources that effectively control insect pests while being safe for non-target organisms and easily degradable in sewage treatment plants and natural environments. These unique features make bioinsecticides an increasingly popular choice for farmers and consumers.
- The bioinsecticides market is dominated by row crops, which accounted for 84.0% of the global market value in 2022. Major row crops such as barley, corn, wheat, rapeseed, rye, sunflower, soybean, and rice are among the most widely farmed globally. Following closely behind are horticulture crops, which had a market share of 11.8% in 2022.
- North America leads the global bioinsecticides market, accounting for 40.8% of the market share in 2022, followed by Europe and Asia-Pacific, with market shares of 33.2% and 17.5%, respectively. The transition to organic agriculture through agroecological and sustainable agricultural practices gained traction globally, focusing on reducing fertilizers and pesticide consumption, particularly due to the pandemic.
- The Pesticide Action Network (PAN) is a global network of over 600 non-governmental organizations, institutions, and individuals working to promote environmentally sound and socially just alternatives to hazardous pesticides. Through its initiatives and programs, PAN is raising awareness about the negative effects of pesticides and driving the adoption of bioinsecticides as a safer and more sustainable alternative.
- With its unique features and benefits and growing consumer preference for chemical-free produce and organically grown food, bioinsecticides are set to experience growth in the global market, with an estimated CAGR of 12.2% during the forecast period (2023-2029).
North America is the largest Region
- Bioinsecticides are biologically-derived pesticides that use microorganisms such as fungi, bacteria, or even plant extracts to combat pest insects that disrupt crop growth and development. North America, Europe, and Asia-Pacific are dominating the global bioinsecticides market.
- The North American region accounted for 40.8%, by value, of the global bioinsecticides market in 2022. North American countries are establishing certain policies to increase organic farming. For instance, the United States implemented USDA's Organic Transition Initiative and a regional integrated pest management center. Canada implemented a ban on certain pesticides through pest management centers. In Mexico, there is growing opposition to the use of chemical pesticides. All these initiatives are driving the bioinsecticides market in the region.
- Europe is the second-largest market for bioinsecticides. The European Union is promoting organic farming by setting the target of achieving 25% of the region's agricultural land under organic farming by 2030. As part of the strategy, all member countries must reduce their use of chemical pesticides by half by 2030. Therefore all the member countries are implementing individual initiatives and policies, including imposing a high tax on chemical pesticides in Italy.
- Asia-Pacific is the third-largest market for bioinsecticides. China and India hold the major share of the Asia-Pacific bioinsecticides market. China, the world's largest pesticide user, intends to reduce pesticide use by 10% in horticultural crops and 5% in rice, wheat, and corn cultivation by 2025. Pesticide bans worldwide and increased organic farming are expected to drive the global bioinsecticides market during the forecast period.
Bioinsecticides Industry Overview
The Bioinsecticides Market is fragmented, with the top five companies occupying 1.69%. The major players in this market are Coromandel International Ltd, Corteva Agriscience, IPL Biologicals Limited, Seipasa SA and Valent Biosciences LLC (sorted alphabetically).
Additional Benefits:
- The market estimate (ME) sheet in Excel format
- 3 months of analyst support
TABLE OF CONTENTS
1 EXECUTIVE SUMMARY & KEY FINDINGS
2 REPORT OFFERS
3 INTRODUCTION
- 3.1 Study Assumptions & Market Definition
- 3.2 Scope of the Study
- 3.3 Research Methodology
4 KEY INDUSTRY TRENDS
- 4.1 Area Under Organic Cultivation
- 4.2 Per Capita Spending On Organic Products
- 4.3 Regulatory Framework
- 4.4 Value Chain & Distribution Channel Analysis
5 MARKET SEGMENTATION
- 5.1 Crop Type
- 5.1.1 Cash Crops
- 5.1.2 Horticultural Crops
- 5.1.3 Row Crops
- 5.2 Region
- 5.2.1 Africa
- 5.2.1.1 By Country
- 5.2.1.1.1 Egypt
- 5.2.1.1.2 Nigeria
- 5.2.1.1.3 South Africa
- 5.2.1.1.4 Rest Of Africa
- 5.2.2 Asia-Pacific
- 5.2.2.1 By Country
- 5.2.2.1.1 Australia
- 5.2.2.1.2 China
- 5.2.2.1.3 India
- 5.2.2.1.4 Indonesia
- 5.2.2.1.5 Japan
- 5.2.2.1.6 Philippines
- 5.2.2.1.7 Thailand
- 5.2.2.1.8 Vietnam
- 5.2.2.1.9 Rest Of Asia-Pacific
- 5.2.3 Europe
- 5.2.3.1 By Country
- 5.2.3.1.1 France
- 5.2.3.1.2 Germany
- 5.2.3.1.3 Italy
- 5.2.3.1.4 Netherlands
- 5.2.3.1.5 Russia
- 5.2.3.1.6 Spain
- 5.2.3.1.7 Turkey
- 5.2.3.1.8 United Kingdom
- 5.2.3.1.9 Rest Of Europe
- 5.2.4 Middle East
- 5.2.4.1 By Country
- 5.2.4.1.1 Iran
- 5.2.4.1.2 Saudi Arabia
- 5.2.4.1.3 Rest Of Middle East
- 5.2.5 North America
- 5.2.5.1 By Country
- 5.2.5.1.1 Canada
- 5.2.5.1.2 Mexico
- 5.2.5.1.3 United States
- 5.2.5.1.4 Rest Of North America
- 5.2.6 South America
- 5.2.6.1 By Country
- 5.2.6.1.1 Argentina
- 5.2.6.1.2 Brazil
- 5.2.6.1.3 Rest Of South America
- 5.2.1 Africa
6 COMPETITIVE LANDSCAPE
- 6.1 Key Strategic Moves
- 6.2 Market Share Analysis
- 6.3 Company Landscape
- 6.4 Company Profiles
- 6.4.1 Andermatt Group AG
- 6.4.2 Certis U.S.A. LLC
- 6.4.3 Coromandel International Ltd
- 6.4.4 Corteva Agriscience
- 6.4.5 IPL Biologicals Limited
- 6.4.6 Jaipur Bio Fertilizers
- 6.4.7 Lallemand Inc.
- 6.4.8 Seipasa SA
- 6.4.9 T.Stanes and Company Limited
- 6.4.10 Valent Biosciences LLC
7 KEY STRATEGIC QUESTIONS FOR AGRICULTURAL BIOLOGICALS CEOS
8 APPENDIX
- 8.1 Global Overview
- 8.1.1 Overview
- 8.1.2 Porter's Five Forces Framework
- 8.1.3 Global Value Chain Analysis
- 8.1.4 Market Dynamics (DROs)
- 8.2 Sources & References
- 8.3 List of Tables & Figures
- 8.4 Primary Insights
- 8.5 Data Pack
- 8.6 Glossary of Terms
02-2729-4219
+886-2-2729-4219
 生物殺蟲劑市場 - 2018-2028 年全球產業規模、佔有率、趨勢、機會和預測,按來源、按應用、地區和競爭細分
 全球生物農藥市場規模、佔有率和行業趨勢分析報告:2023-2030年按來源、用途和地區分類的展望和預測
 2023-2030年全球生物殺蟲劑市場規模研究與預測,按類型、按生物體、按應用方式、按作物類型和區域分析
 生物殺蟲劑市場:各產品類型,各生物類型,各用途,各國,各地區- 產業分析,市場規模,市場佔有率,2023-2030年預測
 生物農藥市場:按類型、作物、機制、配方、作用方式、用途- COVID-19/俄羅斯-烏克蘭衝突/高通膨的累積影響 - 2023-2030 年全球預測
 生物殺蟲劑的全球市場