


 |
市場調查報告書
商品編碼
1431091
全球電動貨運自行車市場:市場佔有率分析、產業趨勢/統計、成長預測(2024-2029)E-cargo Bike - Market Share Analysis, Industry Trends & Statistics, Growth Forecasts (2024 - 2029) |
||||||
價格
※ 本網頁內容可能與最新版本有所差異。詳細情況請與我們聯繫。
簡介目錄
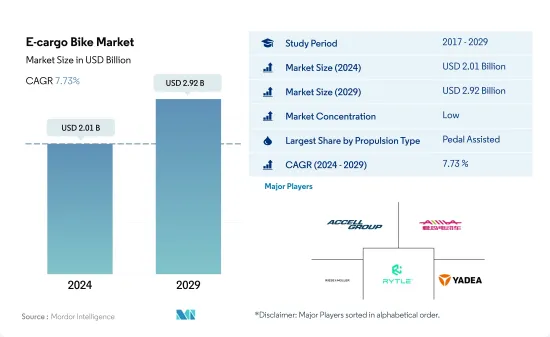
全球電動貨運自行車市場規模預計到 2024 年為 20.1 億美元,2029 年達到 29.2 億美元,在預測期內(2024-2029 年)複合年成長率為 7.75%。
- 截至年終,電動貨運自行車銷量佔全球貨運自行車市場的66.2%。 2017年至2022年,電動貨運自行車銷量複合年成長率為6.7%,其中德國、英國、法國和美國等新興市場佔據了全球市場的很大一部分。隨著城市與交通堵塞造成的噪音和空氣污染作鬥爭,電動貨運自行車和物流領域的自行車正在提供一種便捷且永續來進行第一英里和最後一英里的交付,提供一般物流服務,並為城市居民提供運輸服務。家庭。它正在成為一種全面的、無交通堵塞的替代方案。到 2022 年,電子貨運/公用事業市場規模將達到 18 億美元。
- 北美是全球成長最快的電子商務市場,由於其脆弱的地理位置和廣闊的城市景觀,與其他地區相比面臨特殊的物流挑戰。預計2022年墨西哥電子商務市場規模將達379.9億美元。然而,墨西哥運輸和物流公司 Estafeta 等公司在 2017 年底實施了“綠色配送”,在某些城市部署電動自行車進行最後一英里配送。由於這些措施,電動貨運自行車的使用預計近年來將會增加。
- 線上訂單的增加正在推動最後一哩配送業務的成長。各國政府應歡迎創新和變革,以減少未來的依賴並提高永續。由於中國、印度、日本等亞洲國家人口密度非常高,電動貨運自行車可望成為未來最實用、最環保的選擇。
- 2022 年,全球電動自行車市場產值為 144.048 億美元,預計到 2029 年將達到 259.56 億美元。預計該市場在預測期內將以 10.3% 的複合年成長率成長,這主要是由於電動自行車作為全球日常交通方式的日益普及。由於電動自行車具有健康益處、經濟的交通選擇和騎乘便利等有益特性,其市場銷售量正在迅速成長。
- 2022年亞太地區電動自行車市場銷量約1,620萬輛。過去一段時間,中國、日本和印尼在總銷量中佔有很大佔有率。 2022年,中國將佔全球電動自行車市場90%以上的銷售佔有率。然而,此後成長停滯,市場幾乎飽和狀態。
- 在歐洲,電動自行車的銷售近年來迅速成長,其中德國、比利時和荷蘭等國家佔據了主要銷售量。這是因為人們越來越偏好使用電動自行車進行交通、運動和休閒。此外,瑞典、比利時和法國針對電動自行車制定了補貼和稅收激勵計劃,預計將進一步支持歐洲電動自行車市場在預測期內的顯著成長。
- 在北美,近年來人們對低速兩輪車的偏好增加,電動自行車市場也隨之興起。隨著各種自行車共享營運商擴大引入電動自行車作為其車隊擴張的一部分,預計電動自行車銷量在不久的將來將會增加。
全球電動貨運自行車市場趨勢
對無碳汽車的認知
- 近年來,許多國家對電動自行車的需求不斷增加。汽油價格上漲、尖峰時段交通堵塞以及運動對健康的好處正在推動電動自行車在包括英國和美國在內的多個國家的使用。歐洲是電動機車銷售的主要市場,與其他地區相比,2019年的普及較高。與 2018 年相比,電動自行車需求的增加加快了 2019 年的採用率。
- COVID-19 在全球的快速傳播對自行車產業產生了積極影響。與其他交通途徑相比,電動自行車是日常通勤和前往當地其他地點最實用、最實惠的解決方案之一,徹底改變了消費者的通勤方式。這鼓勵了人們投資電動自行車,2020 年全球普及率比 2019 年更快。
- 隨著商業營運的恢復以及停工等貿易限制的解除,電動自行車在世界各國的普及速度也加快。進出口活動的改善是全球貿易壁壘取消的結果。據估計和預測,在預測期內,電動自行車因其騎行鍛煉、低燃油成本、清潔騎行舒適等特點和優勢將獲得越來越多的消費者興趣,並將在世界許多地區使用. 預計以下國家的普及將會提高。
自行車的優勢以及擴大其在最後一英里物流的使用
- 電動自行車在世界各地越來越受歡迎。由於網路購物的增加,過去五年來污染和交通堵塞顯著增加。針對這種情況,線上零售商正在選擇更快、更環保的電動自行車配送。全球整體,亞太地區的數量最多,其次是北美。與 2018 年相比,這些因素導致 2019 年全球本地配送中電動自行車的使用增加。
- 著眼於擴大電動自行車市場,政府以回扣和補貼形式採取的措施也支持了全球電動自行車市場。例如,在北美,政府提供價值 1,000 美元的激勵措施,鼓勵人們選擇電動自行車。這些因素正在推動電動自行車的需求,2021年北美國家的電動自行車出貨較2020年成長19.70%。類似因素導致 2021 年全球電動自行車交付量較 2020 年增加。
- 由於電動機車自行車業務在全球範圍內爆炸性成長。由於電動自行車具有時間效率、燃油效率、環境友善性和降低維護成本等優點,各公司正在投資用於本地送貨的電動自行車。由於上述因素,預計在預測期內,電動自行車在最後一哩本地配送的使用量將會增加。
電動貨運自行車產業概況
電動貨運自行車市場較為分散,前五大企業佔37.86%。該市場的主要企業包括 Accell Group NV、Aima Technology Group、Riese &Muller、RYTLE GmbH 和 Yadea Group Holdings Ltd。 (按字母順序)。
其他福利:
- Excel 格式的市場預測 (ME) 表
- 3 個月分析師支持
目錄
第1章執行摘要和主要發現
第2章 報告規定
第3章簡介
- 研究假設和市場定義
- 調查範圍
- 調查方法
第4章 產業主要趨勢
- 自行車銷量
- 人均國內生產毛額
- 通貨膨脹率
- 電動自行車普及
- 每天出遊 5 至 15 公里的人口/通勤者百分比
- 自行車租賃
- 電動自行車電池價格
- 以電池化學成分列出的價格表
- 超本地配送
- 專用道
- 電池充電容量
- 交通堵塞指數
- 法律規範
- 價值鍊和通路分析
第5章市場區隔(包括市場規模、2029年預測、成長前景分析)
- 推進類型
- 踏板輔助
- 高速智慧電動車
- 油門輔助
- 電池類型
- 鉛蓄電池
- 鋰離子電池
- 其他
- 地區
- 非洲
- 按國家/地區
- 南非
- 其他非洲
- 亞太地區
- 按國家/地區
- 澳洲
- 中國
- 印度
- 日本
- 紐西蘭
- 韓國
- 其他亞太地區
- 歐洲
- 按國家/地區
- 奧地利
- 比利時
- 丹麥
- 法國
- 德國
- 義大利
- 盧森堡
- 荷蘭
- 挪威
- 波蘭
- 西班牙
- 瑞典
- 瑞士
- 英國
- 其他歐洲國家
- 中東
- 按國家/地區
- 沙烏地阿拉伯
- 阿拉伯聯合大公國
- 其他中東地區
- 北美洲
- 按國家/地區
- 加拿大
- 墨西哥
- 美國
- 北美其他地區
- 南美洲
- 按國家/地區
- 阿根廷
- 巴西
- 南美洲其他地區
- 非洲
第6章 競爭形勢
- 主要策略趨勢
- 市場佔有率分析
- 公司形勢
- 公司簡介
- Accell Group NV
- Aima Technology Group Co. Ltd
- Bakfiets.nl
- DOUZE Factory SAS
- Jiangsu Xinri E-Vehicle Co. Ltd
- Jinhua Jobo Technology Co.
- Pedego Electric Bikes
- Rad Power Bikes
- Riese & Muller
- RYTLE GmbH
- Smart Urban Mobility BV
- Tern Bicycles
- The Cargo Bike Company
- Xtracycle Inc.
- XYZ CARGO
- Yadea Group Holdings Ltd
- YUBA BICYCLES LLC
第7章 CEO 面臨的關鍵策略問題
第8章附錄
簡介目錄
Product Code: 93673
The E-cargo Bike Market size is estimated at USD 2.01 billion in 2024, and is expected to reach USD 2.92 billion by 2029, growing at a CAGR of 7.75% during the forecast period (2024-2029).
- By the end of 2021, electric cargo bike sales were 66.2% of the worldwide cargo bike market. Electric cargo bike sales recorded a CAGR of 6.7% between 2017 and 2022, with developed nations like Germany, the United Kingdom, France, and the United States accounting for a sizable percentage of the worldwide market. As cities struggle with traffic congestion that causes noise and air pollution, the electric cargo bike and bicycle logistic sectors are emerging as a useful, sustainable, non-congested, and inclusive alternative for first- and last-mile deliveries, general logistical service provision, and family vehicles. The e-cargo/utility market reached a value of USD 1.8 billion in 2022.
- North America is the fastest-growing e-commerce market in the world and presents special logistics challenges compared to other regions due to its fraught geography and sprawling urban landscapes. The Mexican e-commerce market is expected to reach USD 37.99 billion by 2022. However, companies like Mexican transportation and logistics Estafeta implemented its "green deliveries" in late 2017, featuring e-bikes for last-mile deliveries in certain cities. Such steps are expected to increase the usage of the e-cargo bike in recent years.
- An increase in online orders is driving the growth of the last-mile delivery business. Governments should welcome technological innovation and change to reduce reliance and become more sustainable in the future. Because of the tremendously dense population in Asian countries such as China, India, and Japan, e-cargo bikes are expected to be the most practical and eco-friendly option in the future.
- The global e-bike market generated USD 14,404.8 million in 2022, and it is expected to reach USD 25,956.0 million by 2029. The market is projected to witness a CAGR of 10.3% during the forecast period, mainly due to the increasing adoption of e-bikes as a daily mode of transportation globally. The market has witnessed an upsurge in the unit sales of e-bikes due to their beneficial characteristics, such as health benefits, economic mobility options, and convenience in riding.
- The unit sale in the APAC e-bike market was around 16.2 million in 2022. China, Japan, and Indonesia accounted for a major share of the overall unit sales during the historical period. China held over 90% volume share in the global e-bike market in 2022. However, it has witnessed stagnant growth since, and the market is almost at a saturation point.
- In Europe, e-bike sales skyrocketed in recent years, with countries including Germany, Belgium, and the Netherlands selling major units of e-bikes. This is due to the growing preference for using e-bikes for transportation, sports, and leisure activities. Additionally, the subsidies and tax incentives programs on e-bikes in Sweden, Belgium, and France are anticipated to further support the significant growth of the European e-bike market during the forecast period.
- In North America, the e-bike market is emerging as the preference for using low-speed two-wheelers has grown in recent years. The increased inclusion of more e-bikes by various bike-sharing operators as part of their fleet expansion is expected to support the sales growth of these bikes in the near future.
Global E-cargo Bike Market Trends
Awareness Regarding Carbon Free Vehicles
- There has been an increase in demand for electric bicycles in many countries over the past several years. Increased gasoline costs, traffic congestion during rush hours, and the health advantages of exercise are driving the usage of e-bikes in several countries, including the United Kingdom and the United States. With a greater adoption rate in 2019 compared to other regions, Europe is the primary market for the selling of electric bikes. The increasing demand for e-bikes accelerated the adoption rate in 2019 compared to 2018.
- The bicycle industry was favorably impacted by the rapid global expansion of the covid cases and wave. E-bikes are one of the most practical and affordable solutions for everyday commutes to work and other local locations compared to other means of transportation, which has revolutionized how consumers commute. This has encouraged people to invest in e-bikes, which accelerated the adoption rate in 2020 over 2019 in various countries across the globe.
- The return of commercial operations and the lifting of trade restrictions like lockout have accelerated the adoption of e-bikes in numerous countries throughout the world. The improvement of import and export activity has been a result of the removal of trade obstacles globally. According to estimates, during the forecast period, the adoption rate of e-bikes will increase in a number of countries around the world due to consumers' growing interest in them as a result of their features and advantages, such as the ability to exercise while riding, the lack of a fuel cost, and cleaner rides.
Advantages of Bicycles and their Increasing Usage in Last Mile Logistics
- E-bikes are becoming increasingly popular in several countries across the world. Due to the increased online shopping, pollution and traffic congestion have increased significantly over the past five years. Due to these circumstances, online merchants are choosing the quicker and greener option of e-bike deliveries. Globally, APAC recorded the highest number of e-bike deliveries, followed by North America. These factors account for the global increase in the use of e-bikes for local deliveries in 2019 over 2018.
- Focusing on e-bike market expansion, the government's efforts in the form of rebates and subsidies are also supporting the global e-bike market. For instance, in North America, the government provides incentives worth USD 1000, encouraging people to choose e-bikes. These factors are driving the demand for e-bikes, which has led to a 19.70% growth in e-bike deliveries in North American countries in 2021 over 2020. Similar factors drove global growth in e-bike delivery units in 2021 over 2020.
- The e-bike business is exploding in many nations across the world due to the cost advantages of electric bikes over other fuel-powered vehicles. Businesses are investing in e-bikes for local deliveries because of advantages like time efficiency, fuel efficiency, environmental friendliness, and lower maintenance costs. The use of e-bikes for last-mile local deliveries is anticipated to rise during the forecast period due to the aforementioned factors.
E-cargo Bike Industry Overview
The E-cargo Bike Market is fragmented, with the top five companies occupying 37.86%. The major players in this market are Accell Group NV, Aima Technology Group Co. Ltd, Riese & Muller, RYTLE GmbH and Yadea Group Holdings Ltd (sorted alphabetically).
Additional Benefits:
- The market estimate (ME) sheet in Excel format
- 3 months of analyst support
TABLE OF CONTENTS
1 EXECUTIVE SUMMARY & KEY FINDINGS
2 REPORT OFFERS
3 INTRODUCTION
- 3.1 Study Assumptions & Market Definition
- 3.2 Scope of the Study
- 3.3 Research Methodology
4 KEY INDUSTRY TRENDS
- 4.1 Bicycle Sales
- 4.2 GDP Per Capita
- 4.3 Inflation Rate
- 4.4 Adoption Rate Of E-Bikes
- 4.5 Percent Population/Commuters With 5-15 Km Daily Travel Distance
- 4.6 Bicycle Rental
- 4.7 E-Bike Battery Price
- 4.8 Price Chart Of Different Battery Chemistry
- 4.9 Hyper-Local Delivery
- 4.10 Dedicated Bicycle Lanes
- 4.11 Battery Charging Capacity
- 4.12 Traffic Congestion Index
- 4.13 Regulatory Framework
- 4.14 Value Chain & Distribution Channel Analysis
5 MARKET SEGMENTATION (includes market size in Value in USD and Volume, Forecasts up to 2029 and analysis of growth prospects)
- 5.1 Propulsion Type
- 5.1.1 Pedal Assisted
- 5.1.2 Speed Pedelec
- 5.1.3 Throttle Assisted
- 5.2 Battery Type
- 5.2.1 Lead Acid Battery
- 5.2.2 Lithium-ion Battery
- 5.2.3 Others
- 5.3 Region
- 5.3.1 Africa
- 5.3.1.1 By Country
- 5.3.1.1.1 South Africa
- 5.3.1.1.2 Rest-of-Africa
- 5.3.2 Asia-Pacific
- 5.3.2.1 By Country
- 5.3.2.1.1 Australia
- 5.3.2.1.2 China
- 5.3.2.1.3 India
- 5.3.2.1.4 Japan
- 5.3.2.1.5 New Zealand
- 5.3.2.1.6 South Korea
- 5.3.2.1.7 Rest-of-APAC
- 5.3.3 Europe
- 5.3.3.1 By Country
- 5.3.3.1.1 Austria
- 5.3.3.1.2 Belgium
- 5.3.3.1.3 Denmark
- 5.3.3.1.4 France
- 5.3.3.1.5 Germany
- 5.3.3.1.6 Italy
- 5.3.3.1.7 Luxembourg
- 5.3.3.1.8 Netherlands
- 5.3.3.1.9 Norway
- 5.3.3.1.10 Poland
- 5.3.3.1.11 Spain
- 5.3.3.1.12 Sweden
- 5.3.3.1.13 Switzerland
- 5.3.3.1.14 UK
- 5.3.3.1.15 Rest-of-Europe
- 5.3.4 Middle East
- 5.3.4.1 By Country
- 5.3.4.1.1 Saudi Arabia
- 5.3.4.1.2 United Arab Emirates
- 5.3.4.1.3 Rest-of-Middle East
- 5.3.5 North America
- 5.3.5.1 By Country
- 5.3.5.1.1 Canada
- 5.3.5.1.2 Mexico
- 5.3.5.1.3 US
- 5.3.5.1.4 Rest-of-North America
- 5.3.6 South America
- 5.3.6.1 By Country
- 5.3.6.1.1 Argentina
- 5.3.6.1.2 Brazil
- 5.3.6.1.3 Rest-of-South America
- 5.3.1 Africa
6 COMPETITIVE LANDSCAPE
- 6.1 Key Strategic Moves
- 6.2 Market Share Analysis
- 6.3 Company Landscape
- 6.4 Company Profiles
- 6.4.1 Accell Group NV
- 6.4.2 Aima Technology Group Co. Ltd
- 6.4.3 Bakfiets.nl
- 6.4.4 DOUZE Factory SAS
- 6.4.5 Jiangsu Xinri E-Vehicle Co. Ltd
- 6.4.6 Jinhua Jobo Technology Co.
- 6.4.7 Pedego Electric Bikes
- 6.4.8 Rad Power Bikes
- 6.4.9 Riese & Muller
- 6.4.10 RYTLE GmbH
- 6.4.11 Smart Urban Mobility B.V
- 6.4.12 Tern Bicycles
- 6.4.13 The Cargo Bike Company
- 6.4.14 Xtracycle Inc.
- 6.4.15 XYZ CARGO
- 6.4.16 Yadea Group Holdings Ltd
- 6.4.17 YUBA BICYCLES LLC
7 KEY STRATEGIC QUESTIONS FOR E BIKES CEOS
8 APPENDIX
- 8.1 Global Overview
- 8.1.1 Overview
- 8.1.2 Porter's Five Forces Framework
- 8.1.3 Global Value Chain Analysis
- 8.1.4 Market Dynamics (DROs)
- 8.2 Sources & References
- 8.3 List of Tables & Figures
- 8.4 Primary Insights
- 8.5 Data Pack
- 8.6 Glossary of Terms
02-2729-4219
+886-2-2729-4219
 電動貨運自行車市場:按電池類型、應用分類 - 2024-2030 年全球預測
 電動貨運自行車市場:按類型、應用、里程分類:2023-2032 年全球機會分析與產業預測
 全球貨運自行車市場:2024 年
 全球電動貨運自行車市場 - 全球產業分析、規模、份額、成長、趨勢、預測 (2031) - 按類型、按電池類型、按最終用途、按地區
 貨運自行車市場(產品類型:兩輪、三輪和四輪;車輪尺寸:20 英寸以下、20 英寸 - 24 英寸、26 英寸、27.5 英寸等)- 全球行業分析、尺寸、 2023-2031 年佔有率、成長、趨勢和預測
 2023-2030 年全球電動貨運自行車市場
 貨物摩托車市場:各類型,各用途,各燃料類型(電力電池,氫,其他),各地區-規模,佔有率,展望,機會分析,2023~2030年
 貨運自行車市場規模:按類型(兩輪、三□□輪、四輪)、銷售渠道(線上、線下)、動力傳動系統(電動、非電動)、應用(包裹遞送、送餐等) ) 和預測:2023-2032
 電動貨運自行車市場——增長、趨勢、COVID-19 的影響和預測 (2023-2028)
 貨物摩托車的全球市場調查報告-產業分析,規模,佔有率,成長,趨勢,2022年~2028年前的預測
▼