


 |
市場調查報告書
商品編碼
1430953
全球汽車機油市場:市場佔有率分析、產業趨勢/統計、成長預測(2021-2026)Global Automotive Engine Oils - Market Share Analysis, Industry Trends & Statistics, Growth Forecasts (2021 - 2026) |
||||||
價格
※ 本網頁內容可能與最新版本有所差異。詳細情況請與我們聯繫。
簡介目錄
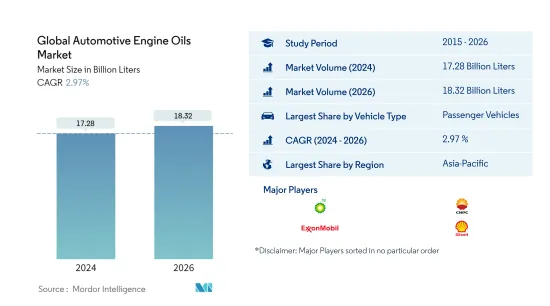
預計2024年全球汽車機油市場規模為172.8億升,預計2026年將達183.2億升,複合年成長率預計為2.97%。
主要亮點
- 依車型分類最大的區隔市場 -小客車:由於世界持有小客車數量眾多,該區隔市場的引擎機油消費量是各種車型中最高的。
- 依車輛類型分類最快的區隔市場 - 兩輪車:儘管出現了新冠肺炎 (COVID-19) 大流行,但一些國家的兩輪車銷量仍在成長,因此該區隔市場的機油消費量可能會繼續保持高位成長。
- 最大的區域市場-亞太地區:亞太地區擁有龐大的持有,如中國、印度和印尼。因此,亞太地區的機油消費量最高。
- 快速成長的亞太市場:合成油普及率低以及印度等國家汽車保有量的預期高成長率可能會增加亞太地區的潤滑油消費量。
汽車機油市場趨勢
依車型分類最大的區隔市場:小客車
- 機油是所有產品類型中最常用的汽車潤滑油。 2015年至2019年,全球汽車機油消費量量複合年增率為2.5%。 2020年,機油將佔全球整體汽車潤滑油消費量的約78%。
- 2020年,受新冠肺炎(COVID-19)疫情影響,全球現有車輛的使用量因商業活動減少而大幅減少。因此,與 2019 年相比,2020 年小客車和兩輪車領域的引擎機油消費量下降幅度最大。
- 預計汽車銷售和生產將復甦,電動車的普及將增加,預計將對引擎油消費量產生輕微影響。因此,由於這些因素,預計2021-2026年機油消費量的複合年成長率為3.72%。
最大區域:亞太地區
- 2015年至2019年,全球汽車機油消費量量複合年成長率超過2%。在此期間,亞太地區是汽車機油的主要消費地區,約佔全球消費量的43%,其次是北美和歐洲。
- 由於 COVID-19 爆發後實施的旅行限制,2020 年機油消耗量受到限制。北美是受影響最嚴重的地區,2019-2020年消費量下降17.5%,其次是歐洲(下降15.8%)。
- 亞太地區預計將見證機油市場成長最快,2021-2026 年消費量預計複合年成長率為 4.73%,其次是非洲和南美洲(預計複合年成長率分別為 4.07% 和 2.97%) ).馬蘇。這一成長可能是由 2022 年起汽車銷售和生產的預期復甦所推動的。
汽車機油產業概況
全球車用機油市場適度整合,前五大企業佔40.16%。該市場的主要企業包括(依字母順序排列)英國石油公司(嘉實多)、中國石油天然氣集團公司、埃克森美孚公司、荷蘭皇家殼牌公司和道達爾能源公司。
其他福利:
- Excel 格式的市場預測 (ME) 表
- 3 個月的分析師支持
目錄
第1章執行摘要和主要發現
第2章簡介
- 研究假設和市場定義
- 調查範圍
- 調查方法
第3章 產業主要趨勢
- 汽車產業趨勢
- 法律規範
- 價值鍊和通路分析
第4章市場區隔
- 依車型
- 商用車
- 摩托車
- 小客車
- 依產品等級
- 依地區
- 非洲
- 埃及
- 摩洛哥
- 奈及利亞
- 南非
- 其他非洲
- 亞太地區
- 中國
- 印度
- 印尼
- 日本
- 馬來西亞
- 菲律賓
- 新加坡
- 韓國
- 泰國
- 越南
- 其他亞太地區
- 歐洲
- 保加利亞
- 法國
- 德國
- 義大利
- 挪威
- 波蘭
- 俄羅斯
- 西班牙
- 英國
- 其他歐洲國家
- 中東
- 伊朗
- 卡達
- 沙烏地阿拉伯
- 土耳其
- 阿拉伯聯合大公國
- 其他中東地區
- 北美洲
- 加拿大
- 墨西哥
- 美國
- 其他北美地區
- 南美洲
- 阿根廷
- 巴西
- 哥倫比亞
- 南美洲其他地區
- 非洲
第5章競爭形勢
- 重大策略舉措
- 市場佔有率分析
- 公司簡介
- BP PLC(Castrol)
- Chevron Corporation
- China National Petroleum Corporation
- China Petroleum & Chemical Corporation
- ENEOS Corporation
- ExxonMobil Corporation
- Idemitsu Kosan Co. Ltd
- Royal Dutch Shell PLC
- TotalEnergies
- Valvoline Inc.
第6章 附錄
- 附錄1 參考文獻
- 附錄-2 圖表清單
第7章 執行長的關鍵策略問題
簡介目錄
Product Code: 90301
The Global Automotive Engine Oils Market size is estimated at 17.28 Billion Liters in 2024, and is expected to reach 18.32 Billion Liters by 2026, growing at a CAGR of 2.97% during the forecast period (2024-2026).
Key Highlights
- Largest Segment by Vehicle Type - Passenger Vehicles : The large fleet size of passenger vehicles across the globe has resulted in this sector accounting for the highest engine oil consumption among the various vehicle types.
- Fastest Segment by Vehicle Type - Motorcycles : The sales boost for motorcycles in several countries despite the COVID-19 pandemic is likely to continue and boost engine oil consumption by this sector in the future.
- Largest Regional Market - Asia-Pacific : Asia-Pacific is home to countries with large vehicle fleets like China, India & Indonesia. As a result, the engine oil consumption by this sector was highest in Asia-Pacific.
- Fastest Growing Regional Market - Asia-Pacific : The low penetration of synthetic oils and expected high growth rates of vehicle population in countries like India are likely to drive the lubricant consumption in APAC.
Automotive Engine Oils Market Trends
Largest Segment By Vehicle Type : Passenger Vehicles
- Engine oils are the most used automotive lubricants among all the product types. During 2015-2019, global automotive engine oil consumption increased at a CAGR of 2.5%. In 2020, engine oils accounted for around 78% of the total automotive lubricant consumption volume globally.
- In 2020, the COVID-19 outbreak resulted in a huge decline in the usage of the existing global vehicle fleet due to a reduction in business activities. As a result, the passenger vehicles and motorcycles segments witnessed the largest drop in engine oil consumption in 2020 compared to 2019.
- Along with the expected recovery in sales and production of motor vehicles, an increase in the penetration of electric vehicles is expected to impact engine oil consumption slightly. Therefore, due to such factors, engine oil consumption is expected to register a CAGR of 3.72% during 2021-2026.
Largest Region : Asia-Pacific
- During 2015-2019, the global automotive engine oil consumption increased at a CAGR of over 2%. During this period, Asia-Pacific was the leading consumer of automotive engine oils and accounted for around 43% of the global volume, followed by North America and Europe.
- The travel restrictions imposed after the COVID-19 outbreak restricted engine oil consumption in 2020. North America was the most affected region as it witnessed a 17.5% drop in consumption during 2019-2020, followed by Europe (a 15.8% drop).
- Asia-Pacific is expected to be the fastest-growing engine oil market as the consumption is anticipated to increase at a CAGR of 4.73%, followed by Africa and South America (with an expected CAGR of 4.07% and 2.97%, respectively), during 2021-2026. The expected recovery in automotive sales and production from 2022 will likely drive this growth.
Automotive Engine Oils Industry Overview
The Global Automotive Engine Oils Market is moderately consolidated, with the top five companies occupying 40.16%. The major players in this market are BP PLC (Castrol), China National Petroleum Corporation, ExxonMobil Corporation, Royal Dutch Shell PLC and TotalEnergies (sorted alphabetically).
Additional Benefits:
- The market estimate (ME) sheet in Excel format
- 3 months of analyst support
TABLE OF CONTENTS
1 Executive Summary & Key Findings
2 Introduction
- 2.1 Study Assumptions & Market Definition
- 2.2 Scope of the Study
- 2.3 Research Methodology
3 Key Industry Trends
- 3.1 Automotive Industry Trends
- 3.2 Regulatory Framework
- 3.3 Value Chain & Distribution Channel Analysis
4 Market Segmentation
- 4.1 By Vehicle Type
- 4.1.1 Commercial Vehicles
- 4.1.2 Motorcycles
- 4.1.3 Passenger Vehicles
- 4.2 By Product Grade
- 4.3 By Region
- 4.3.1 Africa
- 4.3.1.1 Egypt
- 4.3.1.2 Morocco
- 4.3.1.3 Nigeria
- 4.3.1.4 South Africa
- 4.3.1.5 Rest of Africa
- 4.3.2 Asia-Pacific
- 4.3.2.1 China
- 4.3.2.2 India
- 4.3.2.3 Indonesia
- 4.3.2.4 Japan
- 4.3.2.5 Malaysia
- 4.3.2.6 Philippines
- 4.3.2.7 Singapore
- 4.3.2.8 South Korea
- 4.3.2.9 Thailand
- 4.3.2.10 Vietnam
- 4.3.2.11 Rest of Asia-Pacific
- 4.3.3 Europe
- 4.3.3.1 Bulgaria
- 4.3.3.2 France
- 4.3.3.3 Germany
- 4.3.3.4 Italy
- 4.3.3.5 Norway
- 4.3.3.6 Poland
- 4.3.3.7 Russia
- 4.3.3.8 Spain
- 4.3.3.9 United Kingdom
- 4.3.3.10 Rest of Europe
- 4.3.4 Middle East
- 4.3.4.1 Iran
- 4.3.4.2 Qatar
- 4.3.4.3 Saudi Arabia
- 4.3.4.4 Turkey
- 4.3.4.5 UAE
- 4.3.4.6 Rest of Middle East
- 4.3.5 North America
- 4.3.5.1 Canada
- 4.3.5.2 Mexico
- 4.3.5.3 United States
- 4.3.5.4 Rest of North America
- 4.3.6 South America
- 4.3.6.1 Argentina
- 4.3.6.2 Brazil
- 4.3.6.3 Colombia
- 4.3.6.4 Rest of South America
- 4.3.1 Africa
5 Competitive Landscape
- 5.1 Key Strategic Moves
- 5.2 Market Share Analysis
- 5.3 Company Profiles
- 5.3.1 BP PLC (Castrol)
- 5.3.2 Chevron Corporation
- 5.3.3 China National Petroleum Corporation
- 5.3.4 China Petroleum & Chemical Corporation
- 5.3.5 ENEOS Corporation
- 5.3.6 ExxonMobil Corporation
- 5.3.7 Idemitsu Kosan Co. Ltd
- 5.3.8 Royal Dutch Shell PLC
- 5.3.9 TotalEnergies
- 5.3.10 Valvoline Inc.
6 Appendix
- 6.1 Appendix-1 References
- 6.2 Appendix-2 List of Tables & Figures
7 Key Strategic Questions for Lubricants CEOs
02-2729-4219
+886-2-2729-4219
 日本汽車機油:市場佔有率分析、產業趨勢、成長預測(2021-2026)
 汽車外觀化學品市場:按類型、車型、分銷管道分類 - 2024-2030 年全球預測
 汽車添加劑市場:按類型、功能、配銷通路、應用分類 - 2024-2030 年全球預測
 汽車外飾化學品-市場佔有率分析、產業趨勢與統計、2024年至2029年成長預測
 汽車售後市場燃料添加劑市場:依產品類型、依燃料類型、依車輛類型、依配銷通路、依最終用戶、依地區
 2024 年汽車機油全球市場報告
 2024-2028年全球汽車機油市場
 汽車外觀化學品市場:2023-2028 年全球產業趨勢、佔有率、規模、成長、機會與預測
 汽車機油市場 - 2018-2028 年全球產業規模、佔有率、趨勢機會和預測細分車輛類型(商用車、兩輪車、乘用車)、按需求類別(代工生產和更換)、按地區、競爭
 引擎油添加劑市場:按引擎類型、按產品類型、按類型、按最終用途 - 俄羅斯-烏克蘭衝突、高通貨膨脹的累積影響 - 2023-2030 年全球預測
▼