


 |
市場調查報告書
商品編碼
1406072
投影:市場佔有率分析、產業趨勢與統計、2024-2029 年成長預測Projection Mapping - Market Share Analysis, Industry Trends & Statistics, Growth Forecasts 2024 - 2029 |
||||||
※ 本網頁內容可能與最新版本有所差異。詳細情況請與我們聯繫。
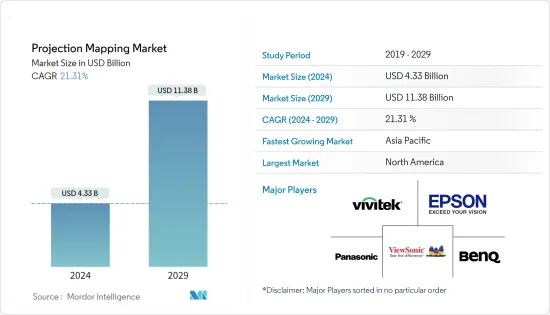
投影映射市場規模預計到 2024 年為 43.3 億美元,到 2029 年達到 113.8 億美元,在預測期內(2024-2029 年)複合年成長率為 21.31%。
與VR等傳統增強技術不同,投影映射技術透過將CG疊加到真實表面上,將物理世界和虛擬世界無縫融合,讓您無需使用眼鏡等周邊設備即可創建各種圖像,用戶可以直接體驗到這種擴展。
主要亮點
- 傳統投影機硬體的技術限制,例如動態範圍、空間解析度、延遲、深度和色域,使得即使應用計算演算法也難以以所需的視覺品質顯示所需的外觀。投影映射。
- 節日活動、大型體育賽事和酒店業對投影系統的需求不斷成長,以實現震撼現實和身臨其境的視覺奇觀,這推動了投影映射市場的成長前景。在過去的幾年裡,物體的 3D 投影在各種應用中獲得了巨大的關注,並且隨著先進的技術創新,預計機會將繼續存在。預計這也將為未來幾年提供有利的道路。
- 投影映射已滲透到媒體和娛樂產業以及音樂廳和產品發布會等公共活動中,以提高觀眾的興奮度。投影映射在與觀眾產生共鳴、增加情感、鼓勵更多參與方面發揮重要作用。
- 與尺寸安裝類型相關的高安裝成本限制了市場的擴張。此外,投影機和相關技術的持續進步等因素正在增加支出。這些原因促使客戶滿意度增加,因此客戶轉向提供經濟高效服務的其他解決方案提供者。此外,缺乏技術能力和理解正在阻礙投影映射領域的擴展。
- COVID-19 大流行影響了投影映射行業,尤其是地面活動。此外,由於全球封鎖以及各個場館和遺產地的旅行和旅遊活動減少,投影映射市場的成長也顯著下降。例如,根據聯合國世界旅遊組織(UNWTO)的資料,2019年國際觀光入境人數為14.66億人次,2020年為4.095億人次,2021年為4.462億人次,人數大幅減少至1萬人。此類案例進一步對現場活動、重大體育賽事和各種世界遺產地投影映射日益成長的需求產生了負面影響。疫情以來,各類交流活動紛紛展開,投影映射市場迅速擴大。
投影映射市場趨勢
地圖軟體預計將佔據主要市場佔有率
- 投影映射軟體在成本、永續性、支援、易用性、與第三方硬體的整合和相容性以及一些供應商提供的客製化解決方案方面優於硬體市場,預計也將快速成長。
- 純地圖軟體供應商專注於開發投影地圖工具,這些工具經過最佳化,可輕鬆實現計劃部署和觀眾觀看。例如,HeavyM 提供的 Mapping 軟體解決方案是一個即用型解決方案,不需要任何動畫技能即可建立投影映射效果。
- 此外,許多其他供應商還提供投影映射軟體解決方案來管理複雜的操作,例如影像變形和軟邊緣混合。此外,高解析度投影、非剛性動態投影和局部像素輻射校正等演算法的研究和開發正在推動進一步成長。
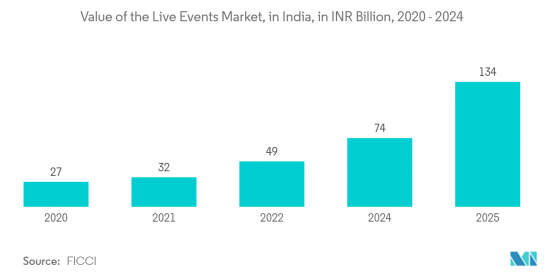
- 還有一些專為即時計劃設計的軟體解決方案,可幫助最終用戶舉辦現場表演等活動。這將提高市場滲透率。據 FICCI 稱,2021 年,印度各地的現場活動市場價值為 320 億印度盧比(3.9 億美元)。預計明年將達到 740 億印度盧比(8.9 億美元),複合年成長率為 32%。
亞太地區將擁有最快的市場成長
- 由於舉辦重大全球活動、歷史博物館的存在以及依賴旅遊業作為收益來源的政府機構的存在,預計亞太地區在預測期內將顯著成長。印度等該地區的國家預計將大量採用投影映射等技術,推動該地區的市場成長。舉辦重大世界活動、歷史博物館的存在以及政府機構對旅遊業作為收入來源的重視,推動了該地區的市場成長。
- 新加坡等該地區的國家正在舉辦重大節日和活動,例如一年一度的新加坡之夜節、iLite Marina Bay 以及利用投影映射等技術的年度濱海灣活動,並推動該地區的市場成長。
- 印度等該地區國家預計將大量採用投影映射等技術,並利用該地區的市場成長。投影映射使計劃設計師能夠借助身臨其境的非傳統影像和聲音來傳達意義和訊息。因此,透過採用此類技術,預計該地區的旅遊目的地數量將因該國旅遊流入量的迅速增加而增加。
- 此外,全國各地的各州政府都在利用投影映射來展示其城市豐富的文化和遺產,推動投影映射市場的成長。例如,2022年12月,根據坎普爾市政專員辦公室發布的公報,將於2022年12月11日至2023年1月1日在甘地·巴萬·坎普爾歷史悠久的建築幕牆舉行投影映射表演。直到今天免費向公眾開放,傳播有關這場壯觀表演的資訊並吸引了當地遊客和遊客。 30 分鐘的表演將介紹坎普爾市以及圍繞城市的歷史和神話事實。
- 同樣,2022 年 11 月,在莫德拉村(古吉拉特邦)神聖中心太陽神廟製作了一個僅由太陽能供電的新 3D 投影秀。五台科視 Christie D20WU-HS 投影機安裝了 HARMAN Pro 防風雨戶外建築照明,照亮太陽神廟建築幕牆,並在紀念碑前的水面上產生鏡面效果。所有內容均透過 AV Stampful 的 PIXERA 媒體伺服器軟體提供。這款強大的 64 位元系統能夠透過直覺的 2D 和 3D 投影映射工作流程進行 8K 即時渲染。
投影映射產業概述
投影映射市場高度分散,主要公司包括Panasonic Corporation、Seiko Epson Corp.、明基公司、Vivitek公司和優派公司。市場參與者正在採取聯盟、創新和收購等策略來加強其產品供應並獲得永續的競爭優勢。
2023年2月,巴可4K雷射投影機和影像處理器入選「1分鐘投影映射大賽」。該活動將作為 TOKYO LIGHTS 2022 的一部分舉行,TOKYO LIGHTS 2022 是由日本投影映射協會 (PMAJ) 贊助的世界上最大的國際投影映射競賽之一。
2022 年 5 月,視覺簡報和協作解決方案提供商 Vivitec 宣布推出其最新的 DLP 雷射投影機 DU4871Z。這款小巧高亮度雷射投影機的產品特點是影像品質出色、投影尺寸大。 DU4871Z 將複雜的冷卻設計與先進的防塵保護相結合,以延長使用壽命。這款安全投影機還擁有多種連接選項,確保易用性和影像品質。
其他福利:
- Excel 格式的市場預測 (ME) 表
- 3 個月分析師支持
目錄
第1章簡介
- 研究假設和市場定義
- 調查範圍
第2章調查方法
第3章執行摘要
第4章市場洞察
- 市場概況
- 產業吸引力-波特五力分析
- 供應商的議價能力
- 消費者議價能力
- 新進入者的威脅
- 替代品的威脅
- 競爭公司之間的敵對關係
- 產業價值鏈分析
- COVID-19 對投影映射市場的影響
第5章市場動態
- 市場促進因素
- 對投影機投影尺寸和高亮度的需求不斷增加
- 智慧城市快速發展
- 市場課題
- 初始成本高
- 3D投影耗費大量時間
第6章市場區隔
- 依產品
- 硬體(投影機、媒體伺服器)
- 軟體
- 依尺寸
- QR 圖
- 3D
- 第四維度
- 依投影距離
- 標準
- 短距離
- 依用途
- 場地大
- 事件
- 節慶
- 娛樂
- 其他用途
- 依地區
- 北美洲
- 美國
- 加拿大
- 歐洲
- 德國
- 英國
- 法國
- 歐洲其他地區
- 亞太地區
- 印度
- 中國
- 日本
- 其他亞太地區
- 拉丁美洲
- 巴西
- 阿根廷
- 其他拉丁美洲
- 中東/非洲
- 阿拉伯聯合大公國
- 沙烏地阿拉伯
- 其他中東/非洲
- 北美洲
第7章 競爭形勢
- 公司簡介
- Panasonic Corporation
- Seiko Epson Corporation
- BenQ Corporation
- Vivitek
- ViewSonic Corporation
- Barco NV
- Digital Projection
- NEC Display Solutions
- HeavyM(Digital Essence SAS)
- Green Hippo Ltd.
- Pixel Rain Digital
第8章投資分析
第9章市場的未來
The Projection Mapping Market size is estimated at USD 4.33 billion in 2024, and is expected to reach USD 11.38 billion by 2029, growing at a CAGR of 21.31% during the forecast period (2024-2029).
Projection mapping technology has been experiencing tremendous adoption rates across the world, majorly due to its seamless integration of the physical and virtual worlds by superimposing computer-generated graphics upon real surfaces, unlike traditional augmentation technologies like VR, thus allowing various users to directly encounter this augmentation without using any peripherals, such as glasses.
Key Highlights
- The technical limitations of the conventional projector hardware, including dynamic range, spatial resolution, latency, depth-of-depth, and color gamut, make it challenging to display desired appearances in wanted visual quality, even with the application of computational algorithms, which is driving the adoption of projection mapping.
- The rising demand for projection systems for reality-smashing and immersive visual spectacles in festive occasions, mega sports events, and the hospitality industry is fostering the growth prospects for the projection mapping market. Over the past few years, 3D projection of objects has gained significant traction in various applications, and the opportunities are expected to remain lucrative with advanced technological innovations. This is expected to open lucrative avenues in the coming years as well.
- Projection mapping has penetrated the media and entertainment industry and public events, including concert halls and product launches, to hype up the audience's excitement. It plays a key role by emotionally engaging the audience, increasing the wow factor, and promoting greater participation.
- The high installation cost associated with the dimension implementation type limits market expansion. Moreover, factors such as continuous projector advancements and associated technology increase expenditures. These reasons are causing client dissatisfaction, and as a result, customers are migrating to alternative solution providers that give cost-effective services. Furthermore, a lack of technical competence and understanding impedes the expansion of the projection mapping sector.
- The COVID-19 pandemic impacted the projection mapping industry, especially land-based events, owing to the complete ban on social gathering events worldwide. Moreover, the projection mapping market also experienced a significant decline in growth due to the global lockdowns and reduction in travel and tourism activities for various venues and heritage sites. For instance, according to the data from the UNWTO, the number of international tourist arrivals was 1,466 million in 2019, which drastically reduced to 409.5 million and 446.2 million in 2020 and 2021, respectively; such instances, further negatively impacted the growth in demand of projection mapping for live events, major sports events, and various world heritage sites. Various social gathering events started post-pandemic, and the market has grown rapidly.
Projection Mapping Market Trends
Mapping Software Expected to Hold Significant Market Share
- Software for projection mapping is anticipated to witness faster growth than its hardware counterparts owing to the cost, sustainability, support, ease of use, integration/compatibility with third-party hardware, and tailored solutions offered by a few vendors.
- The pure-play mapping software vendors focus on developing projection mapping tools that make deploying projects easier and optimized for viewing the audience. For instance, The Mapping software solution provided by HeavyM is a ready-to-use solution that requires no animation skills to create projection mapping effects.
- Furthermore, many other vendors offer projection mapping software solutions that manage complexities such as s imaging warping and soft-edge blending, which is a very time-consuming process of aligning the projections and stacking projectors. Also, researchers' further developments of algorithms such as high-resolution projection, non-rigid dynamic projection, and local per-pixel radiometric compensation, among others, further elevate the growth.
- A few software solutions are also designed for real-time projects that benefit end-users to host events such as live performances. Thereby supporting better penetration of the market. According to FICCI, In 2021, the live events market across India was valued at INR 32 billion (USD 0.39 billion). It was estimated to reach INR 74 billion (USD 0.89 billion) by next year, registering a CAGR of 32%.
Asia Pacific to Witness the Fastest Market Growth
- The Asia-Pacific region is anticipated to witness major growth over the forecast period, as the region leveraging the conduction of major global events, presence of historical museums, and government bodies focusing on tourism as a source of earning elevate the growth of the market. The countries in the region, such as India, are expected to witness significant adoption of technologies such as projection mapping, leveraging the market's growth in the region. The area is leveraging the conduction of major global events, the presence of historical museums, and government bodies focusing on tourism as a source of earning, elevating the market's growth.
- The countries in the region, such as Singapore, are home to major festivals, events such as the annual Singapore Night Festival, I Light Marina Bay, and annual Marina Bay that relies on technologies such as projection mapping to leverage the growth of the market in the region.
- The countries in the region, such as India, are expected to witness significant adoption of technologies such as projection mapping, leveraging the market's growth in the region. Through projection mapping, the project designer can rely on the power of immersive, unconventional visuals and sound to convey meaning and message, often previously the scripted spoken word that movie filmmakers have at their disposal. Hence, adopting such technologies is expected to increase tourist places in the region due to a rapid increase in the country's tourism influx.
- Further, various state governments across the country are using projection mapping to show the rich culture of the cities and heritage sites, thus driving the growth of the projection mapping market. For instance, in December 2022, according to the communique issued by the divisional commissioner office, Kanpur, the Projection Mapping Show on the historical facade of Gandhi Bhawan Kanpur will be open for free from December 11, 2022, to January 1, 2023, to spread the word about the magnificent show and attract local visitors and tourists. The half-an-hour show will deliver the visitors an introduction to the city and the historical/mythological facts related to the city.
- Similarly, in November 2022, a new 3D projection show - run entirely by solar power - was created at the Modhera village's (Gujrat) holy epicenter: the Sun Temple. Five Christie D20WU-HS projectors were installed with weatherproof, outdoor architectural lights from HARMAN Pro to illuminate the Sun temple's facade and create a mirror effect in the body of water in front of the monument. All content was delivered through AV Stumpfl's PIXERA media server software, a robust 64-bit system capable of 8K real-time rendering with intuitive 2D and 3D projection mapping workflows.
Projection Mapping Industry Overview
The Projection Mapping Market is highly fragmented, with the presence of major players like Panasonic Corporation, Seiko Epson Corporation, BenQ Corporation, Vivitek, and ViewSonic Corporation. Players in the market are adopting strategies such as partnerships, innovations, and acquisitions to enhance their product offerings and gain sustainable competitive advantage.
In February 2023, Barco 4K laser projectors and image processors were selected for the "1minute Projection Mapping Competition". This event is one of the largest global international projection mapping competitions held as part of TOKYO LIGHTS 2022 and organized by the Projection Mapping Association of Japan (PMAJ).
In May 2022, Vivitek, a visual presentation and collaboration solutions provider, announced the launch of the latest addition to its DLP laser projectors, the DU4871Z. The compact, high-brightness laser projector product features include excellent image quality and large projection size. The DU4871Z combines a sophisticated cooling design and advanced dust protection to aid longevity. This secure projector also boasts a wide range of diverse connectivity options, ensuring that it is as easy to use as its image quality.
Additional Benefits:
- The market estimate (ME) sheet in Excel format
- 3 months of analyst support
TABLE OF CONTENTS
1 INTRODUCTION
- 1.1 Study Assumptions and Market Definition
- 1.2 Scope of the Study
2 RESEARCH METHODOLOGY
3 EXECUTIVE SUMMARY
4 MARKET INSIGHTS
- 4.1 Market Overview
- 4.2 Industry Attractiveness - Porter's Five Forces Analysis
- 4.2.1 Bargaining Power of Suppliers
- 4.2.2 Bargaining Power of Consumers
- 4.2.3 Threat of New Entrants
- 4.2.4 Threat of Substitutes
- 4.2.5 Intensity of Competitive Rivalry
- 4.3 Industry Value Chain Analysis
- 4.4 Impact of COVID-19 on the Projection Mapping Market
5 MARKET DYNAMICS
- 5.1 Market Drivers
- 5.1.1 Increasing Demand for Projection Size, and High Brightness of the Projectors
- 5.1.2 Rapid Growth of Smart Cities
- 5.2 Market Challenges
- 5.2.1 High Initial Costs
- 5.2.2 A lot of Time Consumption due to 3D Projection
6 MARKET SEGMENTATION
- 6.1 By Offering
- 6.1.1 Hardware (Projector, Media Server)
- 6.1.2 Software
- 6.2 By Dimension
- 6.2.1 2 Dimension
- 6.2.2 3 Dimension
- 6.2.3 4 Dimension
- 6.3 By Throw Distance
- 6.3.1 Standard
- 6.3.2 Short
- 6.4 By Application
- 6.4.1 Large Venue
- 6.4.2 Event
- 6.4.3 Festival
- 6.4.4 Entertainment
- 6.4.5 Other Applications
- 6.5 By Geography
- 6.5.1 North America
- 6.5.1.1 United States
- 6.5.1.2 Canada
- 6.5.2 Europe
- 6.5.2.1 Germany
- 6.5.2.2 United Kingdom
- 6.5.2.3 France
- 6.5.2.4 Rest of Europe
- 6.5.3 Asia Pacific
- 6.5.3.1 India
- 6.5.3.2 China
- 6.5.3.3 Japan
- 6.5.3.4 Rest of Asia Pacific
- 6.5.4 Latin America
- 6.5.4.1 Brazil
- 6.5.4.2 Argentina
- 6.5.4.3 Rest of Latin America
- 6.5.5 Middle East and Africa
- 6.5.5.1 United Arab Emirates
- 6.5.5.2 Saudi Arabia
- 6.5.5.3 Rest of Middle East and Africa
- 6.5.1 North America
7 COMPETITIVE LANDSCAPE
- 7.1 Company Profiles
- 7.1.1 Panasonic Corporation
- 7.1.2 Seiko Epson Corporation
- 7.1.3 BenQ Corporation
- 7.1.4 Vivitek
- 7.1.5 ViewSonic Corporation
- 7.1.6 Barco NV
- 7.1.7 Digital Projection
- 7.1.8 NEC Display Solutions
- 7.1.9 HeavyM (Digital Essence SAS)
- 7.1.10 Green Hippo Ltd.
- 7.1.11 Pixel Rain Digital


