


 |
市場調查報告書
商品編碼
1393959
細胞和基因療法融資和資本交易分析:融資、聯盟、併購(M&A)、技術轉移、IPO/SPAC和其他交易(2021-2023年)Cell and Gene Therapy Funding and Deals Analysis: Financings, Partnering, M&A, Tech Transfers, IPOs/SPACs, Other Deals, 2021-2023 |
||||||
基因和細胞療法的概念已經研究了幾十年,但早期存在重大挑戰。 透過一步一步的進步以及 CRISPR 和下一代定序 (NGS) 等支援工具的逐步引入,細胞和基因療法已成為一個非常活躍的領域。 許多經過驗證的治療方法現已獲得批准。
隨著技術進步降低了進入該行業的壁壘,已有超過 1,500 家治療和工具公司進入該領域。
本報告追蹤 2021 年及以後的細胞和基因治療 (CGT) 交易活動。 該報告提供了 2021 年至 2023 年的圖形季度趨勢,以及涵蓋 2022 年第一季至 2023 年第三季的 2,000 多筆資本交易的具體細節。 近年來,細胞和基因治療(CGT)相關領域受到了廣泛的關注和資助。 本報告追蹤的資本利得稅投資、收購和其他交易從 2023 年第一季到第三季超過 200 億美元。 如何利用資本利得稅(CGT)這個成長最快的市場之一的商機,為此,我們需要了解正在做哪些專案、正在做多少專案、誰在做什麼樣的專案專案、有多少、正在做多少個項目。
本報告分析內容(部分):
- 季度資助金額(2021-2023 年)
- 資本利得稅領域資本交易的詳細資料(2022-2023 年):總計超過 2000 筆
- 創投(合資)/私募基金數量(季度)
- 依時間順序分為多個類別(創投、併購和其他領域)介紹趨勢
- 按類型劃分的資本交易趨勢:技術/研究/策略聯盟、創投/私人投資、併購(M&A)/策略投資、授權協議、首次公開發行/SPAC、製造/供應鏈、公共贊助/慈善事業、教育、分銷、聯合行銷、分拆、重組、交易完成/終止、合資、訴訟和解。
- 按交易類型(併購 (M&A)、策略投資、綜合交易、聯盟)劃分的資本交易最活躍的公司
- 資本交易的地區細分(%,北美、歐洲、亞太地區和其他地區)
- 最常見的融資類型(每季度,按類別)(技術/研究/策略合作、創投/私人投資、併購 (M&A)/策略投資、授權協議、首次公開發行/SPAC、製造/供應鏈)(總計)
隨著細胞和基因治療正在成為一個競爭激烈的市場,本報告特別提到了 1000 多家公司。
目錄
第 1 章執行摘要
- 簡介
- 2023 年前 9 個月投資額達 271 億美元
- 每季的融資金額
- 季度融資金額:按類別劃分(2021 年第一季 - 2023 年第三季)
- 每季交易數量:按類別劃分(2021 年第一季 - 2023 年第三季)
- 擴大合作、製造/供應鏈交易、授權協議、分銷/聯合行銷強調細胞和基因治療活動
- 不常見的資本利得稅交易類型摘要
- 最活躍的公司
第 2 章創投 (VC) 和私募基金
- 流動創投/私募基金
第 3 章策略投資
- 對細胞和基因治療的策略性投資
第 4 章 IPO/FPO/SPAC
- 在北美,大部分利潤來自 IPO、FPO 和 SPAC。
第 5 章企業併購(M&A)
- 雖然平均金額下降,但併購交易數量增加
第 6 章技術/研究/策略合作
- CGT 市場上有廣泛的合作
第 7 章授權協議
- 細胞和基因治療市場的許可協議水準穩定
第 8 章製造/供應鏈
- CGT 的製造和供應鏈管理活動顯著成長
第 9 章公眾支持、教育與慈善活動
- CGT 市場較少關注公共支持、病患/消費者/學員教育和慈善事業
第 10 章分銷/合作行銷
- 資本利得稅分配與聯合行銷交易概述
第 11 章其他:合資、重組、解散、分立
- 影響細胞和基因治療的其他類型交易摘要
While the concepts of gene therapy and cell therapy have been investigated for decades, there were major challenges in the early years. Through incremental progress, and the gradual introduction of enabling tools such as CRISPR and next-generation sequencing (NGS), cell and gene therapy has emerged into a highly active area. There are now many approved therapies with proven track records.
As the technologies have lowered the barriers to entry for the industry, over 1,500 therapy or tools companies have been created or have become involved in this field.
This report, Kalorama's “Cell and Gene Therapy Funding and Deals Analysis: Financings, Partnering, M&A, Tech Transfers, IPOs/SPACs, Other Deals, 2021-2023”, tracks the dealmaking activities in cell and gene therapy since 2021. The report provides informative graphs of quarterly trends from 2021-2023, and also includes the specific details of over 2,000 deals covering the Q1 2022-Q3 2023 period. A lot of attention and funding is being given to the areas related to cell and gene therapy (CGT) recently. Kalorama's tracked CGT investments, acquisitions, and other deals amounted to more than $20 billion in the first three quarters of 2023. Understanding the volumes of deals that have been made, who is making which type and how many, and the deals' details, is critical to finding how to take advantage of the opportunities in one of the fastest-growing markets.
Kalorama's report is designed to provide companies entering or already in this market with knowledge of the trends in deals that will shape future growth and competition.
The following is just some of the information in this report:
- Quarterly Funding Amounts 2021-2023
- Specific details of 2000+ CGT Deals from 2022-2023
- Venture Capital/Private Funding Round Amounts, By Quarter
- Chronological Trends Presented in Multiple Categories (VC, M&A, Other Areas)
- Deals by Type - Technology/Research/Strategic Collaboration; Venture Capital/Private Investment; Acquisition, Merger, Strategic Investment; Licensing; Public Offering/SPAC; Manufacturing, Supply Chain; Outreach, Philanthropy, Education; Distribution, Co-Marketing; Spinout, Restructure; Conclude/Terminate Deal; Joint Venture; and Settle Litigation
- Most Active Deal-Making Companies, by Type of Deal (Acquisition/Merger/ Strategic Investment, Overall Deals, Collaborations)
- Regional Breakdown of Dealmaking [North America, Europe, APAC, Rest of World] (%)
- Most Frequent Types of Deals, by Quarter, by Category [Technology/Research/Strategic Collaboration; Venture Capital/Private Investment; Acquisition, Merger, Strategic Investment; Licensing; Public Offering/SPAC; and Manufacturing, Supply Chain] (Total number)
No report published by a major market research publisher has tackled the current Cell and Gene Therapy dealmaking space more comprehensively.
There isn't a more comprehensive exploration of the current Cell and Gene Therapy dealmaking landscape by any major market research publisher. As Cell and Gene Therapy is becoming a highly competitive marketplace, over a thousand companies are specifically referenced in this report.
Table of Contents
Chapter 1: Executive Summary
- Introduction
- $27.1 Billion in Investment in First Nine Months of 2023
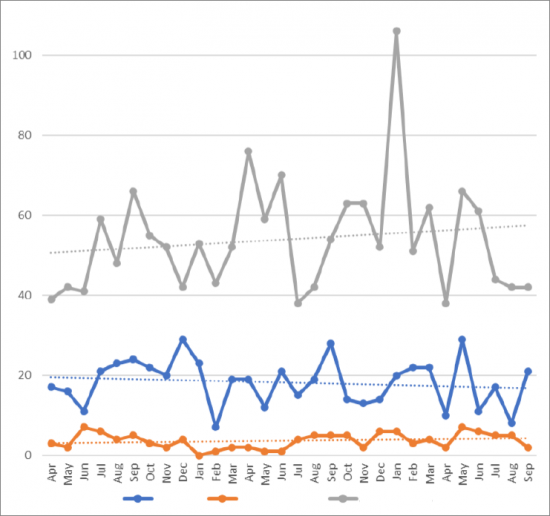
- Figure 1-1: Total Deals per Month, Apr 2021-Sep 2023 (count)
- Figure 1-2: Total Deals per Month by Type, Apr 2021-Sep 2023 [VC/Private, IPO/FPO/SPAC; and All Other Deals] (count)
- Quarterly Funding Amounts
- Table 1-1: Total Quarterly Funding, by Type, Q1-Q3 2023 [M&A; Venture Capital/Private; IPO/FPO; Collab; SPAC; and Strat inv] ($M)
- Table 1-2: Total Quarterly Funding, by Type, 2022 [M&A; Venture Capital/Private; IPO/FPO; Collab; SPAC; and Strat inv] ($M)
- Table 1-3: Total Quarterly Funding, by Type, 2021 [M&A; Venture Capital/Private; IPO/FPO; Collab; SPAC; and Strat inv] ($M)
- Figure 1-3: Total Quarterly Funding, Q1 2021- Q3 2023 ($M)
- Figure 1-4: Total Quarterly Funding, by Type, Q1 2021-Q3 2023 [M&A; Venture Capital/Private; IPO/FPO; Collab; SPAC; and Strat inv] ($M)
- Quarterly Funding Category Shares, Q1 2021 Through Q3 2023
- Table 1-4: Total Quarterly Funding Share, by Type, 2023 [M&A; Venture Capital/Private; IPO/FPO; Collab; SPAC; and Strat inv] (%)
- Table 1-5: Total Quarterly Funding Share, by Type, 2022 [M&A; Venture Capital/Private; IPO/FPO; Collab; SPAC; and Strat inv] (%)
- Table 1-6: Total Quarterly Funding Share, by Type, 2021 [M&A; Venture Capital/Private; IPO/FPO; Collab; SPAC; and Strat inv] ($M)
- Figure 1-5: Total Quarterly Funding Share, by Type, Q1 2021-Q3 2023 [M&A; Venture Capital/Private; IPO/FPO; Collab; SPAC; and Strat inv] (%)
- Figure 1-6: 2021 Funding Share, by Type of Funding [M&A; Venture Capital/Private; IPO/FPO; Collab; SPAC; and Strat inv] (%)
- Figure 1-7: 2022 Funding Share, by Type of Funding [M&A; Venture Capital/Private; IPO/FPO; Collab; SPAC; and Strat inv] (%)
- Figure 1-8: 2023 Funding Share, by Type of Funding [M&A; Venture Capital/Private; IPO/FPO; Collab; SPAC; and Strat inv] (%)
- Quarterly Deal Counts by Category, Q1 2021 - Q3 2023
- Table 1-7: Quarterly Count of Deals, By 2023 Quarter, By Category [Technology/Research/Strategic Collaboration; Venture Capital/Private Investment; Acquisition, Merger, Strategic Investment; Licensing; Public Offering/SPAC; Manufacturing, Supply Chain; Outreach, Philanthropy, Education; Distribution, Co-Marketing; Spinout, Restructure; Conclude/Terminate Deal; Joint Venture; and Settle Litigation] (total number) (%)
- Table 1-8: Quarterly Count of Deals, by 2022 Quarter, By Category [Technology/Research/Strategic Collaboration; Venture Capital/Private Investment; Acquisition, Merger, Strategic Investment; Licensing; Public Offering/SPAC; Manufacturing, Supply Chain; Outreach, Philanthropy, Education; Distribution, Co-Marketing; Spinout, Restructure; Conclude/Terminate Deal; Joint Venture; and Settle Litigation] (total number) (%)
- Table 1-9: Quarterly Count of Deals, by 2021 Quarter, By Category [Technology/Research/Strategic Collaboration; Venture Capital/Private Investment; Acquisition, Merger, Strategic Investment; Licensing; Public Offering/SPAC; Manufacturing, Supply Chain; Outreach, Philanthropy, Education; Distribution, Co-Marketing; Spinout, Restructure; Conclude/Terminate Deal; Joint Venture; and Settle Litigation] (total number) (%)
- Table 1-10: Yearly Shares of Number of Deals, By Category [Technology/Research/Strategic Collaboration; Venture Capital/Private Investment; Acquisition, Merger, Strategic Investment; Licensing; Public Offering/SPAC; Manufacturing, Supply Chain; Outreach, Philanthropy, Education; Distribution, Co-Marketing; Spinout, Restructure; Conclude/Terminate Deal; Joint Venture; and Settle Litigation], 2021-2023 partial (%)
- Growth in Collaborations, Manufacturing/Supply Chain Deals, Licensing, Distribution/ Co-Marketing Highlight Activity in Cell and Gene Therapy
- Figure 1-9: Yearly Shares of Number of Deals, By Category [Technology/Research/Strategic Collaboration; Venture Capital/Private Investment; Acquisition, Merger, Strategic Investment; Licensing; Public Offering/SPAC; Manufacturing, Supply Chain; Outreach, Philanthropy, Education; Distribution, Co-Marketing; Spinout, Restructure; Conclude/Terminate Deal; Joint Venture; and Settle Litigation], 2021-2023 partial (%)
- Figure 1-10: Most Frequent Types of Deals, by Quarter, by Category [Technology/Research/Strategic Collaboration; Venture Capital/Private Investment; Acquisition, Merger, Strategic Investment; Licensing; Public Offering/SPAC; and Manufacturing, Supply Chain], 2021-2023 partial (Total number)
- A Look at Less Frequent CGT Deal Types
- Figure 1-11: Lower Frequency Deal Types, by Quarter, by Category [Outreach, Philanthropy, Education; Distribution, Co-Marketing; Spinout, Restructure; Conclude/Terminate Deal; Joint Venture; and Settle Litigation] (total number)
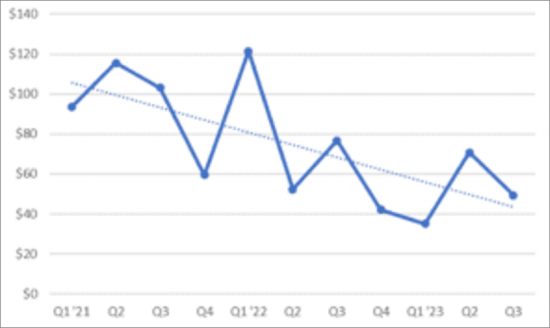
- Figure 1-12: Merger/ Acquisition Amount, by Quarter [Q1 2021 - Q3 2023] ($M)
- Figure 1-13: Venture Capital/Private Funding Round Amount, by Quarter [Q1 2021-Q3 2023] ($M)
- Figure 1-14: IPO/FPO Amount, by Quarter [Q1 2021-Q3 2023] ($M)
- Figure 1-15: SPAC Portion Amount, by Year 2021-2023 ($M)
- Most Active Companies
- Table 1-11: Most Active Companies in CGT Deals, Collaborations, Overall 2021-2023
- Figure 1-16: Most Active Companies in CGT Deals, Collaborations, Overall 2021-2023
Chapter 2: Venture Capital & Private Funding
- VC/Private Funding in Flux
- Figure 2-1: Total Number of VC/Private Funding Deals by Month, Jan 2021-Sep 2023 (count)
- Figure 2-2: Average VC/Private Funding Round Amount, by Quarter Q1 2021- Q1 2023 ($M)
- Table 2-1: Regional Venture Capital/Private Funding, by Quarter Q1 2021-Q3 2023, by Region[North America, Europe, APAC, Rest of World] ($M) (%)
- Figure 2-3: Quarterly Venture Capital/Private Total Funding, Q1 2021- Q1 2023, by Region [North America, Europe, APAC, Rest of World] ($M)
- Table 2-2: Regional Venture Capital/Private Funding Shares, by Quarter Q1 2021-Q3 2023, [North America, Europe, APAC, Rest of World] (%)
- Figure 2-4: Regional Venture Capital/Private Funding Shares, by Quarter Q1 2021-Q3 2023, by Region [North America, Europe, APAC, Rest of World] (%)
- Figure 2-5: Venture Capital/Private Funding Round Amounts, By Quarter [Q1 2021-Q3 2023] ($M)
- Figure 2-6: Scaled Venture Capital/Private Funding Round Amounts, By Quarter [Q1 2021-Q3 2023] ($M)
- Table 2-3: Venture Capital/Private Fundraising Deals, Q3 2023
- Table 2-4: Venture Capital/Private Fundraising Deals, Q2 2023
- Table 2-5: Venture Capital/Private Fundraising Deals, Q1 2023
- Table 2-6: Venture Capital/Private Fundraising Deals, Q4 2022
- Table 2-7: Venture Capital/Private, Q3 2022
- Table 2-8: Venture Capital/Private Fundraising Deals, Q2 2022
- Table 2-9: Venture Capital/Private Fundraising Deals, Q1 2022
Chapter 3: Strategic Investments
- Strategic Investments in Cell and Gene Therapy
- Figure 3-1: Total Number of Strategic Investments, By Quarter [Q1 2021-Q3 2023] (count)
- Figure 3-2: Average Strategic Investment Amount, By Quarter [Q1 2021-Q3 2023] ($M)
- Figure 3-3: Total Strategic Investments, By Quarter [Q1 2021-Q3 2023] ($M)
- Table 3-1: Strategic Investment Total Amounts, Counts, and Averages by Quarter, Q1 2021-Q3 2023, ($M)
- Table 3-2: Strategic Investments, January 2021-September 2023
- Table 3-3: Most Active in Acquisition/Merger/Strategic Investment, 2021-2023
- Figure 3-4: Most Active in Acquisition/Merger/ Strategic Investment, 2021-2023
Chapter 4: IPOs, FPOs, & SPACs
- North America Sees the Majority of Proceeds from IPOs, FPOs, SPACs
- Figure 4-1: Total Number of IPOs/ FPOs, By Month [Jan 2021-Sep 2023] (count)
- Figure 4-2: Average IPO/FPO Proceeds, By Quarter [Q1 2021-Q3 2023] ($M)
- Table 4-1: Quarterly IPO/FPO Total Funding, Q1 2021-Q3 2023, by Region [North America, Europe, APAC] ($M)
- Figure 4-3: Total IPO/FPO Funding, By Quarter [Q1 2021-Q3 2023], by Region [North America, Europe, APAC] ($M)
- Table 4-2: Regional IPO/FPO Funding Shares, by Quarter, Q1 2021-Q3 2023, by Region [North America, Europe, APAC] (%)
- Figure 4-4: Regional IPO/FPO Funding Shares, By Quarter, Q1 2021-Q3 2023, by Region [North America, APAC, and Europe) (%)
- Figure 4-5: IPO/FPO Amounts, By Quarter [Q1 2021-Q3 2023] ($M)
- Table 4-3: Quarterly SPAC Funding Portion, Q1 2021-Q3 2023 ($M)
- Figure 4-6: Quarterly SPAC Funding Portion Total and Average, Q1 2021-Q3 2023 ($M)
- Table 4-4: IPO/FPO Deals, Q3 2023
- Table 4-5: IPO/FPO Deals, Q2 2023
- Table 4-6: IPO/FPO Deals, Q1 2023
- Table 4-7: IPO/FPO Deals, Q4 2022
- Table 4-8: IPO/FPO Deals, Q3 2022
- Table 4-9: IPO/FPO Deals, Q2 2022
- Table 4-10: IPO/FPO Deals, Q1 2022
- Table 4-11: SPAC Portion, January 2021-September 2023 ($M)
- Figure 4-7: SPAC Portion Amount, by Year, 2021-2023 ($M)
Chapter 5: Mergers & Acquisitions (M&A)
- Growing Numbers of M&A, Despite Lower Average Value
- Figure 5-1: Total Number of Mergers and Acquisitions, By Month [Jan 2021-Sep 2023] (count)
- Figure 5-2: Average Merger/Acquisition Amount, By Quarter [Q1 2021-Q3 2023] ($M)
- Table 5-1: Quarterly Merger and Acquisition Values, Counts, and Averages, Q1 2021-Q3 2023 ($M) (Total count)
- Figure 5-3: Merger/Acquisition Transactions Global Total, By Quarter [Q1 2022- Q3 2023] ($M)
- Figure 5-4: Merger/Acquisition Amounts, by Quarter [Q1 2021-Q3 2023] ($M)
- Table 5-2: Mergers and Acquisitions Announcements, Q3 2023 ($M)
- Table 5-3: Mergers and Acquisitions Announcements, Q2 2023 ($M)
- Table 5-4: Mergers and Acquisitions Announcements, Q1 2023 ($M)
- Table 5-5: Mergers and Acquisitions, Q4 2022 ($M)
- Table 5-6: Mergers and Acquisitions, Q3 2022 ($M)
- Table 5-7: Mergers and Acquisitions, Q2 2022 ($M)
- Table 5-8: Mergers and Acquisitions, Q1 2022 ($M)
- Table 5-9: Most Active in Acquisition/Merger/Strategic Investment, 2021-2023 (count)
- Figure 5-5: Most Active in Acquisition/Merger/Strategic Investment, 2021-2023
Chapter 6: Technology/Research/Strategic Collaborations
- CGT Market Sees a Broad Variety of Collaborations
- Figure 6-1: Total Number of Tech/Research/Strategic Collaborations, By Month [Jan 2021-Sep 2023] (count)
- Figure 6-2: Total Number of Collaborations with Upfront and/or Milestone Payments, By Quarter [Q1 2021-Q3 2023] ($M)
- Table 6-1: Collaboration Upfront and Future/Milestone Payments, Counts, Averages, Q1 2021-Q3 2023 ($M) (count)
- Figure 6-3: Average Collaboration Upfront Payment, By Quarter [Q1 2021-Q3 2023] ($M)
- Figure 6-4: Research Collaboration Upfront Payments, By Quarter [Q1 2021-Q3 2023] ($M)
- Figure 6-5: Average Collaboration Future/Milestone Payments, By Quarter [Q1 2021-Q3 2023] ($M)
- Figure 6-6: Total Collaboration Future/Milestone Payments, By Quarter [Q2 2021-Q3 2023] ($M)
- Table 6-2: Technology/Research/Strategic Collaboration Deals, Q3 2023
- Table 6-3: Technology/Research/Strategic Collaboration Deals, Q2 2023
- Table 6-4: Technology/Research/Strategic Collaboration Deals, Q1 2022-Q3 2023
- Table 6-5: Most Active in Research/Strategic Collaborations, 2021-2023 (count)
- Figure 6-7: Most Active in Research/Strategic Collaborations, 2021-2023 (count)
Chapter 7: Licensing
- Stable Levels of Licensing in the Cell and Gene Therapy Market
- Figure 7-1: Total Number of Licensing Deals, By Month [Jan 2021-Sep 2023] (count)
- Table 7-1: Licensing Deals, Q3 2023
- Table 7-2: Licensing Deals, Q2 2023
- Table 7-3: Licensing Deals, Q1 2022-Q1 2023
- Table 7-4: Most Active Companies in Licensing Deals, 2021-2023 (count)
- Figure 7-2: Most Active Companies in Licensing Deals, 2021-2023 (count)
Chapter 8: Manufacturing and Supply Chain
- Major Growth in Manufacturing and Supply Chain Management Activity in CGT
- Figure 8-1: Total Number of Supply/ Manufacturing Deals, By Month [Jan 2021-Sep 2023] (count)
- Table 8-1: Manufacturing and Supply Chain Deals, Q3 2023
- Table 8-2: Manufacturing and Supply Chain Deals, Q2 2023
- Table 8-3: Manufacturing and Supply Chain Deals, Q1 2022-Q3 2023
- Table 8-4: Most Active Companies in Manufacturing/ Supply Deals, 2021-2023 (count)
- Figure 8-2: Most Active Companies in Manufacturing/ Supply Deals, 2021-2023 (count)
Chapter 9: Public Outreach, Education, & Philanthropy
- CGT Market Focusing Less on Public Outreach, Patient/ Consumer/ Trainee Education, and Philanthropy
- Figure 9-1: Total Number of Outreach/ Philanthropy/ Education Deals, By Month [Jan 2021-Sep 2023] (count)
- Table 9-1: Outreach, Education, & Philanthropy Deals, January 2022-Aug 2023
Chapter 10: Distribution & Co-Marketing
- A Look at CGT Distribution and Co-Marketing Deals
- Figure 10-1: Total Number of Distribution/ Co-Marketing Deals, by Month [Jan 2021-Sep 2023] (count)
- Table 10-1: Distribution & Co-Marketing Deals, Q3 2023
- Table 10-2: Distribution & Co-Marketing Deals, Q2 2023
- Table 10-3: Distribution & Co-Marketing Deals, Q1 2022-Q1 2023
Chapter 11: Other - JV, Restructuring, Termination, Spinoffs
- A Look at Other Types of Deals Impacting Cell and Gene Therapy
- Figure 11-1: Total Number of JV, Restructuring, Termination, By Month [Jan 2021-Sep 2023] (Total count)
- Table 11-1: Restructuring, JV, Termination, Spinoffs, January 2022-Sep 2023
 細胞和基因治療的全球市場
 2024-2032 年按細胞類型、治療類型、治療領域、最終用戶和地區分類的細胞治療市場報告
 細胞治療市場機會與預測(2017-2031):依治療類型、細胞類型、產品類型、應用、最終使用者和地區
 先進醫療製藥(ATMP)CDMO市場、份額、規模、趨勢、行業分析報告:按產品、階段、適應症、地區、細分市場預測,2024-2032年
 細胞治療市場、份額、規模、趨勢、行業分析報告:按治療類型、按技術、按應用、按地區、按細分市場、預測,2024-2032 年
 細胞冷凍介質市場,按產品、按應用、按最終用戶、按國家和地區 - 2023-2030 年行業分析、市場規模、市場佔有率和預測
 細胞和基因治療製造品質控制 (QC) 市場 - 成長、未來前景、競爭分析,2023-2031 年
![亞太地區T 細胞治療市場預測至2030 年- 區域分析- 按模式(研究和商業化)、治療類型[CAR T 細胞療法和基於T 細胞受體(TCR) 的] 和適應症(血液惡性腫瘤和實體瘤)](/sample/img/cover/42/1452623.png) 亞太地區T 細胞治療市場預測至2030 年- 區域分析- 按模式(研究和商業化)、治療類型[CAR T 細胞療法和基於T 細胞受體(TCR) 的] 和適應症(血液惡性腫瘤和實體瘤)
亞太地區T 細胞治療市場預測至2030 年- 區域分析- 按模式(研究和商業化)、治療類型[CAR T 細胞療法和基於T 細胞受體(TCR) 的] 和適應症(血液惡性腫瘤和實體瘤) 先進治療 CDMO 市場:按產品、階段、適應症和最終用戶 - 2024-2030 年全球預測
![北美T 細胞治療市場預測至2030 年- 區域分析- 按模式(研究和商業化)、治療類型[CAR T 細胞療法和基於T 細胞受體(TCR) 的] 和適應症(血液惡性腫瘤和實體瘤)](/sample/img/cover/42/1452634.png) 北美T 細胞治療市場預測至2030 年- 區域分析- 按模式(研究和商業化)、治療類型[CAR T 細胞療法和基於T 細胞受體(TCR) 的] 和適應症(血液惡性腫瘤和實體瘤)
北美T 細胞治療市場預測至2030 年- 區域分析- 按模式(研究和商業化)、治療類型[CAR T 細胞療法和基於T 細胞受體(TCR) 的] 和適應症(血液惡性腫瘤和實體瘤)