


 |
市場調查報告書
商品編碼
1435161
動物咀嚼片市場:按成分類型、藥物、購買型態、分銷管道、應用分類 - 全球預測 2024-2030Animal Chewables Market by Composition Type (Botanically Synthesized, Chemically Synthesized), Drug (Analgesics, Anti-Infective, Anti-Ulcers), Mode of Purchase, Distribution Channel, Applications - Global Forecast 2024-2030 |
||||||
※ 本網頁內容可能與最新版本有所差異。詳細情況請與我們聯繫。
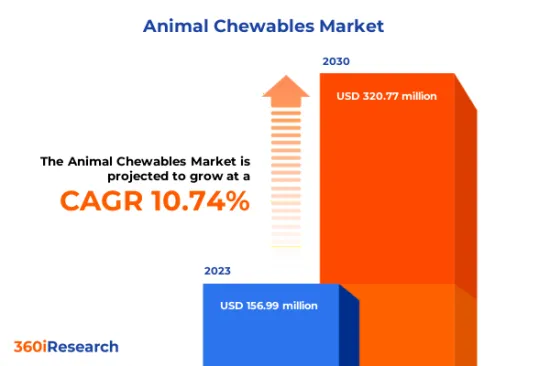
預計2023年動物咀嚼片市場規模為1.5699億美元,預計2024年將達到1.731億美元,2030年將達到3.2077億美元,複合年成長率為10.74%。
全球動物咀嚼片市場
| 主要市場統計 | |
|---|---|
| 基準年[2023] | 15699萬美元 |
| 預測年份 [2024] | 1.731 億美元 |
| 預測年份 [2030] | 32077萬美元 |
| 複合年成長率(%) | 10.74% |
FPNV定位矩陣
FPNV 定位矩陣對於評估獸用咀嚼片市場至關重要。我們檢視與業務策略和產品滿意度相關的關鍵指標,以對供應商進行全面評估。這種深入的分析使用戶能夠根據自己的要求做出明智的決策。根據評估,供應商被分為四個成功程度不同的像限:前沿(F)、探路者(P)、利基(N)和重要(V)。
市場佔有率分析
市場佔有率分析是一種綜合工具,可以對動物咀嚼片市場供應商的現狀進行深入而詳細的研究。全面比較和分析供應商在整體收益、基本客群和其他關鍵指標方面的貢獻,以便更好地了解公司的績效及其在爭奪市場佔有率時面臨的挑戰。此外,該分析還提供了對該行業競爭特徵的寶貴見解,包括在研究基準年觀察到的累積、分散主導地位和合併特徵等因素。這種詳細程度的提高使供應商能夠做出更明智的決策並制定有效的策略,從而在市場上獲得競爭優勢。
該報告對以下幾個方面提供了寶貴的見解:
1-市場滲透率:提供有關主要企業所服務的市場的全面資訊。
2-市場開拓:我們深入研究利潤豐厚的新興市場並分析其在成熟細分市場的滲透率。
3- 市場多元化:提供有關新產品發布、開拓地區、最新發展和投資的詳細資訊。
4-競爭力評估與資訊:對主要企業的市場佔有率、策略、產品、認證、監管狀況、專利狀況、製造能力等進行全面評估。
5- 產品開發與創新:提供對未來技術、研發活動和突破性產品開發的見解。
本報告解決了以下關鍵問題:
1-動物咀嚼片市場的市場規模與預測是多少?
2-在動物咀嚼片市場預測期間內需要考慮投資的產品、細分市場、應用和領域有哪些?
3-獸用咀嚼片市場的技術趨勢和法律規範是什麼?
4-動物咀嚼片市場主要供應商的市場佔有率為何?
5-進入獸用咀嚼片市場合適的型態和策略手段是什麼?
目錄
第1章 前言
第2章調查方法
第3章執行摘要
第4章市場概況
第5章市場洞察
- 市場動態
- 促進因素
- 牲畜數量以及寵物和伴同性動物的擁有量增加
- 保持動物健康和提供營養的需求日益成長
- 提高人們對獸用咀嚼片的健康益處的認知
- 抑制因素
- 針對寵物和獸用咀嚼片以及產品召回的嚴格監管要求
- 機會
- 有機和生物基咀嚼片越來越受歡迎
- 新品上市、明星代言加速
- 任務
- 使用獸用咀嚼片的副作用
- 促進因素
- 市場區隔分析
- 市場趨勢分析
- 高通膨的累積效應
- 波特五力分析
- 價值鍊和關鍵路徑分析
- 法律規範
第6章按類型分類的動物咀嚼片市場構成
- 植物合成
- 化學合成
第7章依藥物分類的動物咀嚼片市場
- 止痛藥
- 抗感染疾病
- 抗潰瘍
- 礦物
- 維他命
第8章動物咀嚼片市場依購買方式分類
- 在商店
- 處方箋
第9章動物咀嚼片市場:依通路
- 網路動物醫院
- 動物醫院
- 動物藥房
第10章動物咀嚼片市場:依應用分類
- 消化系統疾病
- 感染疾病
第11章美洲動物咀嚼片市場
- 阿根廷
- 巴西
- 加拿大
- 墨西哥
- 美國
第12章亞太動物咀嚼片市場
- 澳洲
- 中國
- 印度
- 印尼
- 日本
- 馬來西亞
- 菲律賓
- 新加坡
- 韓國
- 台灣
- 泰國
- 越南
第13章歐洲、中東和非洲的動物咀嚼片市場
- 丹麥
- 埃及
- 芬蘭
- 法國
- 德國
- 以色列
- 義大利
- 荷蘭
- 奈及利亞
- 挪威
- 波蘭
- 卡達
- 俄羅斯
- 沙烏地阿拉伯
- 南非
- 西班牙
- 瑞典
- 瑞士
- 土耳其
- 阿拉伯聯合大公國
- 英國
第14章競爭形勢
- FPNV定位矩陣
- 市場佔有率分析:主要企業
- 主要企業競爭情境分析
第15章競爭組合
- 主要公司簡介
- AllAccem Inc.
- Bayer AG
- Boehringer Ingelheim International GmbH
- Ceva Animal Health, LLC
- Colgate-Palmolive Company
- Dechra Veterinary Products Limited
- Elanco Animal Health Incorporated
- HealthyMouth LLC
- Manna Pro Products, LLC
- Mars, Incorporated
- Merck & Co., Inc.
- Nestle SA
- Pala-Tech Laboratories
- The JM Smucker Co
- Zoetis, Inc.
- 主要產品系列
第16章附錄
- 討論指南
- 關於許可證和定價
[199 Pages Report] The Animal Chewables Market size was estimated at USD 156.99 million in 2023 and expected to reach USD 173.10 million in 2024, at a CAGR 10.74% to reach USD 320.77 million by 2030.
Global Animal Chewables Market
| KEY MARKET STATISTICS | |
|---|---|
| Base Year [2023] | USD 156.99 million |
| Estimated Year [2024] | USD 173.10 million |
| Forecast Year [2030] | USD 320.77 million |
| CAGR (%) | 10.74% |
FPNV Positioning Matrix
The FPNV Positioning Matrix is pivotal in evaluating the Animal Chewables Market. It offers a comprehensive assessment of vendors, examining key metrics related to Business Strategy and Product Satisfaction. This in-depth analysis empowers users to make well-informed decisions aligned with their requirements. Based on the evaluation, the vendors are then categorized into four distinct quadrants representing varying levels of success: Forefront (F), Pathfinder (P), Niche (N), or Vital (V).
Market Share Analysis
The Market Share Analysis is a comprehensive tool that provides an insightful and in-depth examination of the current state of vendors in the Animal Chewables Market. By meticulously comparing and analyzing vendor contributions in terms of overall revenue, customer base, and other key metrics, we can offer companies a greater understanding of their performance and the challenges they face when competing for market share. Additionally, this analysis provides valuable insights into the competitive nature of the sector, including factors such as accumulation, fragmentation dominance, and amalgamation traits observed over the base year period studied. With this expanded level of detail, vendors can make more informed decisions and devise effective strategies to gain a competitive edge in the market.
Key Company Profiles
The report delves into recent significant developments in the Animal Chewables Market, highlighting leading vendors and their innovative profiles. These include AllAccem Inc., Bayer AG, Boehringer Ingelheim International GmbH, Ceva Animal Health, LLC, Colgate-Palmolive Company, Dechra Veterinary Products Limited, Elanco Animal Health Incorporated, HealthyMouth LLC, Manna Pro Products, LLC, Mars, Incorporated, Merck & Co., Inc., Nestle S.A., Pala-Tech Laboratories, The J.M. Smucker Co, and Zoetis, Inc..
Market Segmentation & Coverage
This research report categorizes the Animal Chewables Market to forecast the revenues and analyze trends in each of the following sub-markets:
- Composition Type
- Botanically Synthesized
- Chemically Synthesized
- Drug
- Analgesics
- Anti-Infective
- Anti-Ulcers
- Minerals
- Vitamins
- Mode of Purchase
- Over the Counter
- Prescription
- Distribution Channel
- Online Veterinary Stores
- Veterinary Clinics
- Veterinary Pharmacies
- Applications
- Gastrointestinal Diseases
- Infectious Diseases
- Region
- Americas
- Argentina
- Brazil
- Canada
- Mexico
- United States
- California
- Florida
- Illinois
- New York
- Ohio
- Pennsylvania
- Texas
- Asia-Pacific
- Australia
- China
- India
- Indonesia
- Japan
- Malaysia
- Philippines
- Singapore
- South Korea
- Taiwan
- Thailand
- Vietnam
- Europe, Middle East & Africa
- Denmark
- Egypt
- Finland
- France
- Germany
- Israel
- Italy
- Netherlands
- Nigeria
- Norway
- Poland
- Qatar
- Russia
- Saudi Arabia
- South Africa
- Spain
- Sweden
- Switzerland
- Turkey
- United Arab Emirates
- United Kingdom
- Americas
The report offers valuable insights on the following aspects:
1. Market Penetration: It presents comprehensive information on the market provided by key players.
2. Market Development: It delves deep into lucrative emerging markets and analyzes the penetration across mature market segments.
3. Market Diversification: It provides detailed information on new product launches, untapped geographic regions, recent developments, and investments.
4. Competitive Assessment & Intelligence: It conducts an exhaustive assessment of market shares, strategies, products, certifications, regulatory approvals, patent landscape, and manufacturing capabilities of the leading players.
5. Product Development & Innovation: It offers intelligent insights on future technologies, R&D activities, and breakthrough product developments.
The report addresses key questions such as:
1. What is the market size and forecast of the Animal Chewables Market?
2. Which products, segments, applications, and areas should one consider investing in over the forecast period in the Animal Chewables Market?
3. What are the technology trends and regulatory frameworks in the Animal Chewables Market?
4. What is the market share of the leading vendors in the Animal Chewables Market?
5. Which modes and strategic moves are suitable for entering the Animal Chewables Market?
Table of Contents
1. Preface
- 1.1. Objectives of the Study
- 1.2. Market Segmentation & Coverage
- 1.3. Years Considered for the Study
- 1.4. Currency & Pricing
- 1.5. Language
- 1.6. Limitations
- 1.7. Assumptions
- 1.8. Stakeholders
2. Research Methodology
- 2.1. Define: Research Objective
- 2.2. Determine: Research Design
- 2.3. Prepare: Research Instrument
- 2.4. Collect: Data Source
- 2.5. Analyze: Data Interpretation
- 2.6. Formulate: Data Verification
- 2.7. Publish: Research Report
- 2.8. Repeat: Report Update
3. Executive Summary
4. Market Overview
- 4.1. Introduction
- 4.2. Animal Chewables Market, by Region
5. Market Insights
- 5.1. Market Dynamics
- 5.1.1. Drivers
- 5.1.1.1. Growing livestock population coupled with the increasing pet and companion animals ownership
- 5.1.1.2. Proliferating need to maintain animal health and provide nutrition
- 5.1.1.3. Increasing awareness about the health benefits of animal chewables
- 5.1.2. Restraints
- 5.1.2.1. Strict regulatory requirements for pet and animal chewable and product recalls
- 5.1.3. Opportunities
- 5.1.3.1. Rising popularity of organic and bio-based chewable
- 5.1.3.2. Acceleration in the new product launches and celebrity endorsements
- 5.1.4. Challenges
- 5.1.4.1. Side effects of consuming animal chewables
- 5.1.1. Drivers
- 5.2. Market Segmentation Analysis
- 5.3. Market Trend Analysis
- 5.4. Cumulative Impact of High Inflation
- 5.5. Porter's Five Forces Analysis
- 5.5.1. Threat of New Entrants
- 5.5.2. Threat of Substitutes
- 5.5.3. Bargaining Power of Customers
- 5.5.4. Bargaining Power of Suppliers
- 5.5.5. Industry Rivalry
- 5.6. Value Chain & Critical Path Analysis
- 5.7. Regulatory Framework
6. Animal Chewables Market, by Composition Type
- 6.1. Introduction
- 6.2. Botanically Synthesized
- 6.3. Chemically Synthesized
7. Animal Chewables Market, by Drug
- 7.1. Introduction
- 7.2. Analgesics
- 7.3. Anti-Infective
- 7.4. Anti-Ulcers
- 7.5. Minerals
- 7.6. Vitamins
8. Animal Chewables Market, by Mode of Purchase
- 8.1. Introduction
- 8.2. Over the Counter
- 8.3. Prescription
9. Animal Chewables Market, by Distribution Channel
- 9.1. Introduction
- 9.2. Online Veterinary Stores
- 9.3. Veterinary Clinics
- 9.4. Veterinary Pharmacies
10. Animal Chewables Market, by Applications
- 10.1. Introduction
- 10.2. Gastrointestinal Diseases
- 10.3. Infectious Diseases
11. Americas Animal Chewables Market
- 11.1. Introduction
- 11.2. Argentina
- 11.3. Brazil
- 11.4. Canada
- 11.5. Mexico
- 11.6. United States
12. Asia-Pacific Animal Chewables Market
- 12.1. Introduction
- 12.2. Australia
- 12.3. China
- 12.4. India
- 12.5. Indonesia
- 12.6. Japan
- 12.7. Malaysia
- 12.8. Philippines
- 12.9. Singapore
- 12.10. South Korea
- 12.11. Taiwan
- 12.12. Thailand
- 12.13. Vietnam
13. Europe, Middle East & Africa Animal Chewables Market
- 13.1. Introduction
- 13.2. Denmark
- 13.3. Egypt
- 13.4. Finland
- 13.5. France
- 13.6. Germany
- 13.7. Israel
- 13.8. Italy
- 13.9. Netherlands
- 13.10. Nigeria
- 13.11. Norway
- 13.12. Poland
- 13.13. Qatar
- 13.14. Russia
- 13.15. Saudi Arabia
- 13.16. South Africa
- 13.17. Spain
- 13.18. Sweden
- 13.19. Switzerland
- 13.20. Turkey
- 13.21. United Arab Emirates
- 13.22. United Kingdom
14. Competitive Landscape
- 14.1. FPNV Positioning Matrix
- 14.2. Market Share Analysis, By Key Player
- 14.3. Competitive Scenario Analysis, By Key Player
15. Competitive Portfolio
- 15.1. Key Company Profiles
- 15.1.1. AllAccem Inc.
- 15.1.2. Bayer AG
- 15.1.3. Boehringer Ingelheim International GmbH
- 15.1.4. Ceva Animal Health, LLC
- 15.1.5. Colgate-Palmolive Company
- 15.1.6. Dechra Veterinary Products Limited
- 15.1.7. Elanco Animal Health Incorporated
- 15.1.8. HealthyMouth LLC
- 15.1.9. Manna Pro Products, LLC
- 15.1.10. Mars, Incorporated
- 15.1.11. Merck & Co., Inc.
- 15.1.12. Nestle S.A.
- 15.1.13. Pala-Tech Laboratories
- 15.1.14. The J.M. Smucker Co
- 15.1.15. Zoetis, Inc.
- 15.2. Key Product Portfolio
16. Appendix
- 16.1. Discussion Guide
- 16.2. License & Pricing
LIST OF FIGURES
- FIGURE 1. ANIMAL CHEWABLES MARKET RESEARCH PROCESS
- FIGURE 2. ANIMAL CHEWABLES MARKET SIZE, 2023 VS 2030
- FIGURE 3. ANIMAL CHEWABLES MARKET SIZE, 2018-2030 (USD MILLION)
- FIGURE 4. ANIMAL CHEWABLES MARKET SIZE, BY REGION, 2023 VS 2030 (%)
- FIGURE 5. ANIMAL CHEWABLES MARKET SIZE, BY REGION, 2023 VS 2024 VS 2030 (USD MILLION)
- FIGURE 6. ANIMAL CHEWABLES MARKET DYNAMICS
- FIGURE 7. ANIMAL CHEWABLES MARKET SIZE, BY COMPOSITION TYPE, 2023 VS 2030 (%)
- FIGURE 8. ANIMAL CHEWABLES MARKET SIZE, BY COMPOSITION TYPE, 2023 VS 2024 VS 2030 (USD MILLION)
- FIGURE 9. ANIMAL CHEWABLES MARKET SIZE, BY DRUG, 2023 VS 2030 (%)
- FIGURE 10. ANIMAL CHEWABLES MARKET SIZE, BY DRUG, 2023 VS 2024 VS 2030 (USD MILLION)
- FIGURE 11. ANIMAL CHEWABLES MARKET SIZE, BY MODE OF PURCHASE, 2023 VS 2030 (%)
- FIGURE 12. ANIMAL CHEWABLES MARKET SIZE, BY MODE OF PURCHASE, 2023 VS 2024 VS 2030 (USD MILLION)
- FIGURE 13. ANIMAL CHEWABLES MARKET SIZE, BY DISTRIBUTION CHANNEL, 2023 VS 2030 (%)
- FIGURE 14. ANIMAL CHEWABLES MARKET SIZE, BY DISTRIBUTION CHANNEL, 2023 VS 2024 VS 2030 (USD MILLION)
- FIGURE 15. ANIMAL CHEWABLES MARKET SIZE, BY APPLICATIONS, 2023 VS 2030 (%)
- FIGURE 16. ANIMAL CHEWABLES MARKET SIZE, BY APPLICATIONS, 2023 VS 2024 VS 2030 (USD MILLION)
- FIGURE 17. AMERICAS ANIMAL CHEWABLES MARKET SIZE, BY COUNTRY, 2023 VS 2030 (%)
- FIGURE 18. AMERICAS ANIMAL CHEWABLES MARKET SIZE, BY COUNTRY, 2023 VS 2024 VS 2030 (USD MILLION)
- FIGURE 19. UNITED STATES ANIMAL CHEWABLES MARKET SIZE, BY STATE, 2023 VS 2030 (%)
- FIGURE 20. UNITED STATES ANIMAL CHEWABLES MARKET SIZE, BY STATE, 2023 VS 2024 VS 2030 (USD MILLION)
- FIGURE 21. ASIA-PACIFIC ANIMAL CHEWABLES MARKET SIZE, BY COUNTRY, 2023 VS 2030 (%)
- FIGURE 22. ASIA-PACIFIC ANIMAL CHEWABLES MARKET SIZE, BY COUNTRY, 2023 VS 2024 VS 2030 (USD MILLION)
- FIGURE 23. EUROPE, MIDDLE EAST & AFRICA ANIMAL CHEWABLES MARKET SIZE, BY COUNTRY, 2023 VS 2030 (%)
- FIGURE 24. EUROPE, MIDDLE EAST & AFRICA ANIMAL CHEWABLES MARKET SIZE, BY COUNTRY, 2023 VS 2024 VS 2030 (USD MILLION)
- FIGURE 25. ANIMAL CHEWABLES MARKET, FPNV POSITIONING MATRIX, 2023
- FIGURE 26. ANIMAL CHEWABLES MARKET SHARE, BY KEY PLAYER, 2023
LIST OF TABLES
- TABLE 1. ANIMAL CHEWABLES MARKET SEGMENTATION & COVERAGE
- TABLE 2. UNITED STATES DOLLAR EXCHANGE RATE, 2018-2023
- TABLE 3. ANIMAL CHEWABLES MARKET SIZE, 2018-2030 (USD MILLION)
- TABLE 4. GLOBAL ANIMAL CHEWABLES MARKET SIZE, BY REGION, 2018-2030 (USD MILLION)
- TABLE 5. ANIMAL CHEWABLES MARKET SIZE, BY COMPOSITION TYPE, 2018-2030 (USD MILLION)
- TABLE 6. ANIMAL CHEWABLES MARKET SIZE, BY BOTANICALLY SYNTHESIZED, BY REGION, 2018-2030 (USD MILLION)
- TABLE 7. ANIMAL CHEWABLES MARKET SIZE, BY CHEMICALLY SYNTHESIZED, BY REGION, 2018-2030 (USD MILLION)
- TABLE 8. ANIMAL CHEWABLES MARKET SIZE, BY DRUG, 2018-2030 (USD MILLION)
- TABLE 9. ANIMAL CHEWABLES MARKET SIZE, BY ANALGESICS, BY REGION, 2018-2030 (USD MILLION)
- TABLE 10. ANIMAL CHEWABLES MARKET SIZE, BY ANTI-INFECTIVE, BY REGION, 2018-2030 (USD MILLION)
- TABLE 11. ANIMAL CHEWABLES MARKET SIZE, BY ANTI-ULCERS, BY REGION, 2018-2030 (USD MILLION)
- TABLE 12. ANIMAL CHEWABLES MARKET SIZE, BY MINERALS, BY REGION, 2018-2030 (USD MILLION)
- TABLE 13. ANIMAL CHEWABLES MARKET SIZE, BY VITAMINS, BY REGION, 2018-2030 (USD MILLION)
- TABLE 14. ANIMAL CHEWABLES MARKET SIZE, BY MODE OF PURCHASE, 2018-2030 (USD MILLION)
- TABLE 15. ANIMAL CHEWABLES MARKET SIZE, BY OVER THE COUNTER, BY REGION, 2018-2030 (USD MILLION)
- TABLE 16. ANIMAL CHEWABLES MARKET SIZE, BY PRESCRIPTION, BY REGION, 2018-2030 (USD MILLION)
- TABLE 17. ANIMAL CHEWABLES MARKET SIZE, BY DISTRIBUTION CHANNEL, 2018-2030 (USD MILLION)
- TABLE 18. ANIMAL CHEWABLES MARKET SIZE, BY ONLINE VETERINARY STORES, BY REGION, 2018-2030 (USD MILLION)
- TABLE 19. ANIMAL CHEWABLES MARKET SIZE, BY VETERINARY CLINICS, BY REGION, 2018-2030 (USD MILLION)
- TABLE 20. ANIMAL CHEWABLES MARKET SIZE, BY VETERINARY PHARMACIES, BY REGION, 2018-2030 (USD MILLION)
- TABLE 21. ANIMAL CHEWABLES MARKET SIZE, BY APPLICATIONS, 2018-2030 (USD MILLION)
- TABLE 22. ANIMAL CHEWABLES MARKET SIZE, BY GASTROINTESTINAL DISEASES, BY REGION, 2018-2030 (USD MILLION)
- TABLE 23. ANIMAL CHEWABLES MARKET SIZE, BY INFECTIOUS DISEASES, BY REGION, 2018-2030 (USD MILLION)
- TABLE 24. AMERICAS ANIMAL CHEWABLES MARKET SIZE, BY COMPOSITION TYPE, 2018-2030 (USD MILLION)
- TABLE 25. AMERICAS ANIMAL CHEWABLES MARKET SIZE, BY DRUG, 2018-2030 (USD MILLION)
- TABLE 26. AMERICAS ANIMAL CHEWABLES MARKET SIZE, BY MODE OF PURCHASE, 2018-2030 (USD MILLION)
- TABLE 27. AMERICAS ANIMAL CHEWABLES MARKET SIZE, BY DISTRIBUTION CHANNEL, 2018-2030 (USD MILLION)
- TABLE 28. AMERICAS ANIMAL CHEWABLES MARKET SIZE, BY APPLICATIONS, 2018-2030 (USD MILLION)
- TABLE 29. AMERICAS ANIMAL CHEWABLES MARKET SIZE, BY COUNTRY, 2018-2030 (USD MILLION)
- TABLE 30. ARGENTINA ANIMAL CHEWABLES MARKET SIZE, BY COMPOSITION TYPE, 2018-2030 (USD MILLION)
- TABLE 31. ARGENTINA ANIMAL CHEWABLES MARKET SIZE, BY DRUG, 2018-2030 (USD MILLION)
- TABLE 32. ARGENTINA ANIMAL CHEWABLES MARKET SIZE, BY MODE OF PURCHASE, 2018-2030 (USD MILLION)
- TABLE 33. ARGENTINA ANIMAL CHEWABLES MARKET SIZE, BY DISTRIBUTION CHANNEL, 2018-2030 (USD MILLION)
- TABLE 34. ARGENTINA ANIMAL CHEWABLES MARKET SIZE, BY APPLICATIONS, 2018-2030 (USD MILLION)
- TABLE 35. BRAZIL ANIMAL CHEWABLES MARKET SIZE, BY COMPOSITION TYPE, 2018-2030 (USD MILLION)
- TABLE 36. BRAZIL ANIMAL CHEWABLES MARKET SIZE, BY DRUG, 2018-2030 (USD MILLION)
- TABLE 37. BRAZIL ANIMAL CHEWABLES MARKET SIZE, BY MODE OF PURCHASE, 2018-2030 (USD MILLION)
- TABLE 38. BRAZIL ANIMAL CHEWABLES MARKET SIZE, BY DISTRIBUTION CHANNEL, 2018-2030 (USD MILLION)
- TABLE 39. BRAZIL ANIMAL CHEWABLES MARKET SIZE, BY APPLICATIONS, 2018-2030 (USD MILLION)
- TABLE 40. CANADA ANIMAL CHEWABLES MARKET SIZE, BY COMPOSITION TYPE, 2018-2030 (USD MILLION)
- TABLE 41. CANADA ANIMAL CHEWABLES MARKET SIZE, BY DRUG, 2018-2030 (USD MILLION)
- TABLE 42. CANADA ANIMAL CHEWABLES MARKET SIZE, BY MODE OF PURCHASE, 2018-2030 (USD MILLION)
- TABLE 43. CANADA ANIMAL CHEWABLES MARKET SIZE, BY DISTRIBUTION CHANNEL, 2018-2030 (USD MILLION)
- TABLE 44. CANADA ANIMAL CHEWABLES MARKET SIZE, BY APPLICATIONS, 2018-2030 (USD MILLION)
- TABLE 45. MEXICO ANIMAL CHEWABLES MARKET SIZE, BY COMPOSITION TYPE, 2018-2030 (USD MILLION)
- TABLE 46. MEXICO ANIMAL CHEWABLES MARKET SIZE, BY DRUG, 2018-2030 (USD MILLION)
- TABLE 47. MEXICO ANIMAL CHEWABLES MARKET SIZE, BY MODE OF PURCHASE, 2018-2030 (USD MILLION)
- TABLE 48. MEXICO ANIMAL CHEWABLES MARKET SIZE, BY DISTRIBUTION CHANNEL, 2018-2030 (USD MILLION)
- TABLE 49. MEXICO ANIMAL CHEWABLES MARKET SIZE, BY APPLICATIONS, 2018-2030 (USD MILLION)
- TABLE 50. UNITED STATES ANIMAL CHEWABLES MARKET SIZE, BY COMPOSITION TYPE, 2018-2030 (USD MILLION)
- TABLE 51. UNITED STATES ANIMAL CHEWABLES MARKET SIZE, BY DRUG, 2018-2030 (USD MILLION)
- TABLE 52. UNITED STATES ANIMAL CHEWABLES MARKET SIZE, BY MODE OF PURCHASE, 2018-2030 (USD MILLION)
- TABLE 53. UNITED STATES ANIMAL CHEWABLES MARKET SIZE, BY DISTRIBUTION CHANNEL, 2018-2030 (USD MILLION)
- TABLE 54. UNITED STATES ANIMAL CHEWABLES MARKET SIZE, BY APPLICATIONS, 2018-2030 (USD MILLION)
- TABLE 55. UNITED STATES ANIMAL CHEWABLES MARKET SIZE, BY STATE, 2018-2030 (USD MILLION)
- TABLE 56. ASIA-PACIFIC ANIMAL CHEWABLES MARKET SIZE, BY COMPOSITION TYPE, 2018-2030 (USD MILLION)
- TABLE 57. ASIA-PACIFIC ANIMAL CHEWABLES MARKET SIZE, BY DRUG, 2018-2030 (USD MILLION)
- TABLE 58. ASIA-PACIFIC ANIMAL CHEWABLES MARKET SIZE, BY MODE OF PURCHASE, 2018-2030 (USD MILLION)
- TABLE 59. ASIA-PACIFIC ANIMAL CHEWABLES MARKET SIZE, BY DISTRIBUTION CHANNEL, 2018-2030 (USD MILLION)
- TABLE 60. ASIA-PACIFIC ANIMAL CHEWABLES MARKET SIZE, BY APPLICATIONS, 2018-2030 (USD MILLION)
- TABLE 61. ASIA-PACIFIC ANIMAL CHEWABLES MARKET SIZE, BY COUNTRY, 2018-2030 (USD MILLION)
- TABLE 62. AUSTRALIA ANIMAL CHEWABLES MARKET SIZE, BY COMPOSITION TYPE, 2018-2030 (USD MILLION)
- TABLE 63. AUSTRALIA ANIMAL CHEWABLES MARKET SIZE, BY DRUG, 2018-2030 (USD MILLION)
- TABLE 64. AUSTRALIA ANIMAL CHEWABLES MARKET SIZE, BY MODE OF PURCHASE, 2018-2030 (USD MILLION)
- TABLE 65. AUSTRALIA ANIMAL CHEWABLES MARKET SIZE, BY DISTRIBUTION CHANNEL, 2018-2030 (USD MILLION)
- TABLE 66. AUSTRALIA ANIMAL CHEWABLES MARKET SIZE, BY APPLICATIONS, 2018-2030 (USD MILLION)
- TABLE 67. CHINA ANIMAL CHEWABLES MARKET SIZE, BY COMPOSITION TYPE, 2018-2030 (USD MILLION)
- TABLE 68. CHINA ANIMAL CHEWABLES MARKET SIZE, BY DRUG, 2018-2030 (USD MILLION)
- TABLE 69. CHINA ANIMAL CHEWABLES MARKET SIZE, BY MODE OF PURCHASE, 2018-2030 (USD MILLION)
- TABLE 70. CHINA ANIMAL CHEWABLES MARKET SIZE, BY DISTRIBUTION CHANNEL, 2018-2030 (USD MILLION)
- TABLE 71. CHINA ANIMAL CHEWABLES MARKET SIZE, BY APPLICATIONS, 2018-2030 (USD MILLION)
- TABLE 72. INDIA ANIMAL CHEWABLES MARKET SIZE, BY COMPOSITION TYPE, 2018-2030 (USD MILLION)
- TABLE 73. INDIA ANIMAL CHEWABLES MARKET SIZE, BY DRUG, 2018-2030 (USD MILLION)
- TABLE 74. INDIA ANIMAL CHEWABLES MARKET SIZE, BY MODE OF PURCHASE, 2018-2030 (USD MILLION)
- TABLE 75. INDIA ANIMAL CHEWABLES MARKET SIZE, BY DISTRIBUTION CHANNEL, 2018-2030 (USD MILLION)
- TABLE 76. INDIA ANIMAL CHEWABLES MARKET SIZE, BY APPLICATIONS, 2018-2030 (USD MILLION)
- TABLE 77. INDONESIA ANIMAL CHEWABLES MARKET SIZE, BY COMPOSITION TYPE, 2018-2030 (USD MILLION)
- TABLE 78. INDONESIA ANIMAL CHEWABLES MARKET SIZE, BY DRUG, 2018-2030 (USD MILLION)
- TABLE 79. INDONESIA ANIMAL CHEWABLES MARKET SIZE, BY MODE OF PURCHASE, 2018-2030 (USD MILLION)
- TABLE 80. INDONESIA ANIMAL CHEWABLES MARKET SIZE, BY DISTRIBUTION CHANNEL, 2018-2030 (USD MILLION)
- TABLE 81. INDONESIA ANIMAL CHEWABLES MARKET SIZE, BY APPLICATIONS, 2018-2030 (USD MILLION)
- TABLE 82. JAPAN ANIMAL CHEWABLES MARKET SIZE, BY COMPOSITION TYPE, 2018-2030 (USD MILLION)
- TABLE 83. JAPAN ANIMAL CHEWABLES MARKET SIZE, BY DRUG, 2018-2030 (USD MILLION)
- TABLE 84. JAPAN ANIMAL CHEWABLES MARKET SIZE, BY MODE OF PURCHASE, 2018-2030 (USD MILLION)
- TABLE 85. JAPAN ANIMAL CHEWABLES MARKET SIZE, BY DISTRIBUTION CHANNEL, 2018-2030 (USD MILLION)
- TABLE 86. JAPAN ANIMAL CHEWABLES MARKET SIZE, BY APPLICATIONS, 2018-2030 (USD MILLION)
- TABLE 87. MALAYSIA ANIMAL CHEWABLES MARKET SIZE, BY COMPOSITION TYPE, 2018-2030 (USD MILLION)
- TABLE 88. MALAYSIA ANIMAL CHEWABLES MARKET SIZE, BY DRUG, 2018-2030 (USD MILLION)
- TABLE 89. MALAYSIA ANIMAL CHEWABLES MARKET SIZE, BY MODE OF PURCHASE, 2018-2030 (USD MILLION)
- TABLE 90. MALAYSIA ANIMAL CHEWABLES MARKET SIZE, BY DISTRIBUTION CHANNEL, 2018-2030 (USD MILLION)
- TABLE 91. MALAYSIA ANIMAL CHEWABLES MARKET SIZE, BY APPLICATIONS, 2018-2030 (USD MILLION)
- TABLE 92. PHILIPPINES ANIMAL CHEWABLES MARKET SIZE, BY COMPOSITION TYPE, 2018-2030 (USD MILLION)
- TABLE 93. PHILIPPINES ANIMAL CHEWABLES MARKET SIZE, BY DRUG, 2018-2030 (USD MILLION)
- TABLE 94. PHILIPPINES ANIMAL CHEWABLES MARKET SIZE, BY MODE OF PURCHASE, 2018-2030 (USD MILLION)
- TABLE 95. PHILIPPINES ANIMAL CHEWABLES MARKET SIZE, BY DISTRIBUTION CHANNEL, 2018-2030 (USD MILLION)
- TABLE 96. PHILIPPINES ANIMAL CHEWABLES MARKET SIZE, BY APPLICATIONS, 2018-2030 (USD MILLION)
- TABLE 97. SINGAPORE ANIMAL CHEWABLES MARKET SIZE, BY COMPOSITION TYPE, 2018-2030 (USD MILLION)
- TABLE 98. SINGAPORE ANIMAL CHEWABLES MARKET SIZE, BY DRUG, 2018-2030 (USD MILLION)
- TABLE 99. SINGAPORE ANIMAL CHEWABLES MARKET SIZE, BY MODE OF PURCHASE, 2018-2030 (USD MILLION)
- TABLE 100. SINGAPORE ANIMAL CHEWABLES MARKET SIZE, BY DISTRIBUTION CHANNEL, 2018-2030 (USD MILLION)
- TABLE 101. SINGAPORE ANIMAL CHEWABLES MARKET SIZE, BY APPLICATIONS, 2018-2030 (USD MILLION)
- TABLE 102. SOUTH KOREA ANIMAL CHEWABLES MARKET SIZE, BY COMPOSITION TYPE, 2018-2030 (USD MILLION)
- TABLE 103. SOUTH KOREA ANIMAL CHEWABLES MARKET SIZE, BY DRUG, 2018-2030 (USD MILLION)
- TABLE 104. SOUTH KOREA ANIMAL CHEWABLES MARKET SIZE, BY MODE OF PURCHASE, 2018-2030 (USD MILLION)
- TABLE 105. SOUTH KOREA ANIMAL CHEWABLES MARKET SIZE, BY DISTRIBUTION CHANNEL, 2018-2030 (USD MILLION)
- TABLE 106. SOUTH KOREA ANIMAL CHEWABLES MARKET SIZE, BY APPLICATIONS, 2018-2030 (USD MILLION)
- TABLE 107. TAIWAN ANIMAL CHEWABLES MARKET SIZE, BY COMPOSITION TYPE, 2018-2030 (USD MILLION)
- TABLE 108. TAIWAN ANIMAL CHEWABLES MARKET SIZE, BY DRUG, 2018-2030 (USD MILLION)
- TABLE 109. TAIWAN ANIMAL CHEWABLES MARKET SIZE, BY MODE OF PURCHASE, 2018-2030 (USD MILLION)
- TABLE 110. TAIWAN ANIMAL CHEWABLES MARKET SIZE, BY DISTRIBUTION CHANNEL, 2018-2030 (USD MILLION)
- TABLE 111. TAIWAN ANIMAL CHEWABLES MARKET SIZE, BY APPLICATIONS, 2018-2030 (USD MILLION)
- TABLE 112. THAILAND ANIMAL CHEWABLES MARKET SIZE, BY COMPOSITION TYPE, 2018-2030 (USD MILLION)
- TABLE 113. THAILAND ANIMAL CHEWABLES MARKET SIZE, BY DRUG, 2018-2030 (USD MILLION)
- TABLE 114. THAILAND ANIMAL CHEWABLES MARKET SIZE, BY MODE OF PURCHASE, 2018-2030 (USD MILLION)
- TABLE 115. THAILAND ANIMAL CHEWABLES MARKET SIZE, BY DISTRIBUTION CHANNEL, 2018-2030 (USD MILLION)
- TABLE 116. THAILAND ANIMAL CHEWABLES MARKET SIZE, BY APPLICATIONS, 2018-2030 (USD MILLION)
- TABLE 117. VIETNAM ANIMAL CHEWABLES MARKET SIZE, BY COMPOSITION TYPE, 2018-2030 (USD MILLION)
- TABLE 118. VIETNAM ANIMAL CHEWABLES MARKET SIZE, BY DRUG, 2018-2030 (USD MILLION)
- TABLE 119. VIETNAM ANIMAL CHEWABLES MARKET SIZE, BY MODE OF PURCHASE, 2018-2030 (USD MILLION)
- TABLE 120. VIETNAM ANIMAL CHEWABLES MARKET SIZE, BY DISTRIBUTION CHANNEL, 2018-2030 (USD MILLION)
- TABLE 121. VIETNAM ANIMAL CHEWABLES MARKET SIZE, BY APPLICATIONS, 2018-2030 (USD MILLION)
- TABLE 122. EUROPE, MIDDLE EAST & AFRICA ANIMAL CHEWABLES MARKET SIZE, BY COMPOSITION TYPE, 2018-2030 (USD MILLION)
- TABLE 123. EUROPE, MIDDLE EAST & AFRICA ANIMAL CHEWABLES MARKET SIZE, BY DRUG, 2018-2030 (USD MILLION)
- TABLE 124. EUROPE, MIDDLE EAST & AFRICA ANIMAL CHEWABLES MARKET SIZE, BY MODE OF PURCHASE, 2018-2030 (USD MILLION)
- TABLE 125. EUROPE, MIDDLE EAST & AFRICA ANIMAL CHEWABLES MARKET SIZE, BY DISTRIBUTION CHANNEL, 2018-2030 (USD MILLION)
- TABLE 126. EUROPE, MIDDLE EAST & AFRICA ANIMAL CHEWABLES MARKET SIZE, BY APPLICATIONS, 2018-2030 (USD MILLION)
- TABLE 127. EUROPE, MIDDLE EAST & AFRICA ANIMAL CHEWABLES MARKET SIZE, BY COUNTRY, 2018-2030 (USD MILLION)
- TABLE 128. DENMARK ANIMAL CHEWABLES MARKET SIZE, BY COMPOSITION TYPE, 2018-2030 (USD MILLION)
- TABLE 129. DENMARK ANIMAL CHEWABLES MARKET SIZE, BY DRUG, 2018-2030 (USD MILLION)
- TABLE 130. DENMARK ANIMAL CHEWABLES MARKET SIZE, BY MODE OF PURCHASE, 2018-2030 (USD MILLION)
- TABLE 131. DENMARK ANIMAL CHEWABLES MARKET SIZE, BY DISTRIBUTION CHANNEL, 2018-2030 (USD MILLION)
- TABLE 132. DENMARK ANIMAL CHEWABLES MARKET SIZE, BY APPLICATIONS, 2018-2030 (USD MILLION)
- TABLE 133. EGYPT ANIMAL CHEWABLES MARKET SIZE, BY COMPOSITION TYPE, 2018-2030 (USD MILLION)
- TABLE 134. EGYPT ANIMAL CHEWABLES MARKET SIZE, BY DRUG, 2018-2030 (USD MILLION)
- TABLE 135. EGYPT ANIMAL CHEWABLES MARKET SIZE, BY MODE OF PURCHASE, 2018-2030 (USD MILLION)
- TABLE 136. EGYPT ANIMAL CHEWABLES MARKET SIZE, BY DISTRIBUTION CHANNEL, 2018-2030 (USD MILLION)
- TABLE 137. EGYPT ANIMAL CHEWABLES MARKET SIZE, BY APPLICATIONS, 2018-2030 (USD MILLION)
- TABLE 138. FINLAND ANIMAL CHEWABLES MARKET SIZE, BY COMPOSITION TYPE, 2018-2030 (USD MILLION)
- TABLE 139. FINLAND ANIMAL CHEWABLES MARKET SIZE, BY DRUG, 2018-2030 (USD MILLION)
- TABLE 140. FINLAND ANIMAL CHEWABLES MARKET SIZE, BY MODE OF PURCHASE, 2018-2030 (USD MILLION)
- TABLE 141. FINLAND ANIMAL CHEWABLES MARKET SIZE, BY DISTRIBUTION CHANNEL, 2018-2030 (USD MILLION)
- TABLE 142. FINLAND ANIMAL CHEWABLES MARKET SIZE, BY APPLICATIONS, 2018-2030 (USD MILLION)
- TABLE 143. FRANCE ANIMAL CHEWABLES MARKET SIZE, BY COMPOSITION TYPE, 2018-2030 (USD MILLION)
- TABLE 144. FRANCE ANIMAL CHEWABLES MARKET SIZE, BY DRUG, 2018-2030 (USD MILLION)
- TABLE 145. FRANCE ANIMAL CHEWABLES MARKET SIZE, BY MODE OF PURCHASE, 2018-2030 (USD MILLION)
- TABLE 146. FRANCE ANIMAL CHEWABLES MARKET SIZE, BY DISTRIBUTION CHANNEL, 2018-2030 (USD MILLION)
- TABLE 147. FRANCE ANIMAL CHEWABLES MARKET SIZE, BY APPLICATIONS, 2018-2030 (USD MILLION)
- TABLE 148. GERMANY ANIMAL CHEWABLES MARKET SIZE, BY COMPOSITION TYPE, 2018-2030 (USD MILLION)
- TABLE 149. GERMANY ANIMAL CHEWABLES MARKET SIZE, BY DRUG, 2018-2030 (USD MILLION)
- TABLE 150. GERMANY ANIMAL CHEWABLES MARKET SIZE, BY MODE OF PURCHASE, 2018-2030 (USD MILLION)
- TABLE 151. GERMANY ANIMAL CHEWABLES MARKET SIZE, BY DISTRIBUTION CHANNEL, 2018-2030 (USD MILLION)
- TABLE 152. GERMANY ANIMAL CHEWABLES MARKET SIZE, BY APPLICATIONS, 2018-2030 (USD MILLION)
- TABLE 153. ISRAEL ANIMAL CHEWABLES MARKET SIZE, BY COMPOSITION TYPE, 2018-2030 (USD MILLION)
- TABLE 154. ISRAEL ANIMAL CHEWABLES MARKET SIZE, BY DRUG, 2018-2030 (USD MILLION)
- TABLE 155. ISRAEL ANIMAL CHEWABLES MARKET SIZE, BY MODE OF PURCHASE, 2018-2030 (USD MILLION)
- TABLE 156. ISRAEL ANIMAL CHEWABLES MARKET SIZE, BY DISTRIBUTION CHANNEL, 2018-2030 (USD MILLION)
- TABLE 157. ISRAEL ANIMAL CHEWABLES MARKET SIZE, BY APPLICATIONS, 2018-2030 (USD MILLION)
- TABLE 158. ITALY ANIMAL CHEWABLES MARKET SIZE, BY COMPOSITION TYPE, 2018-2030 (USD MILLION)
- TABLE 159. ITALY ANIMAL CHEWABLES MARKET SIZE, BY DRUG, 2018-2030 (USD MILLION)
- TABLE 160. ITALY ANIMAL CHEWABLES MARKET SIZE, BY MODE OF PURCHASE, 2018-2030 (USD MILLION)
- TABLE 161. ITALY ANIMAL CHEWABLES MARKET SIZE, BY DISTRIBUTION CHANNEL, 2018-2030 (USD MILLION)
- TABLE 162. ITALY ANIMAL CHEWABLES MARKET SIZE, BY APPLICATIONS, 2018-2030 (USD MILLION)
- TABLE 163. NETHERLANDS ANIMAL CHEWABLES MARKET SIZE, BY COMPOSITION TYPE, 2018-2030 (USD MILLION)
- TABLE 164. NETHERLANDS ANIMAL CHEWABLES MARKET SIZE, BY DRUG, 2018-2030 (USD MILLION)
- TABLE 165. NETHERLANDS ANIMAL CHEWABLES MARKET SIZE, BY MODE OF PURCHASE, 2018-2030 (USD MILLION)
- TABLE 166. NETHERLANDS ANIMAL CHEWABLES MARKET SIZE, BY DISTRIBUTION CHANNEL, 2018-2030 (USD MILLION)
- TABLE 167. NETHERLANDS ANIMAL CHEWABLES MARKET SIZE, BY APPLICATIONS, 2018-2030 (USD MILLION)
- TABLE 168. NIGERIA ANIMAL CHEWABLES MARKET SIZE, BY COMPOSITION TYPE, 2018-2030 (USD MILLION)
- TABLE 169. NIGERIA ANIMAL CHEWABLES MARKET SIZE, BY DRUG, 2018-2030 (USD MILLION)
- TABLE 170. NIGERIA ANIMAL CHEWABLES MARKET SIZE, BY MODE OF PURCHASE, 2018-2030 (USD MILLION)
- TABLE 171. NIGERIA ANIMAL CHEWABLES MARKET SIZE, BY DISTRIBUTION CHANNEL, 2018-2030 (USD MILLION)
- TABLE 172. NIGERIA ANIMAL CHEWABLES MARKET SIZE, BY APPLICATIONS, 2018-2030 (USD MILLION)
- TABLE 173. NORWAY ANIMAL CHEWABLES MARKET SIZE, BY COMPOSITION TYPE, 2018-2030 (USD MILLION)
- TABLE 174. NORWAY ANIMAL CHEWABLES MARKET SIZE, BY DRUG, 2018-2030 (USD MILLION)
- TABLE 175. NORWAY ANIMAL CHEWABLES MARKET SIZE, BY MODE OF PURCHASE, 2018-2030 (USD MILLION)
- TABLE 176. NORWAY ANIMAL CHEWABLES MARKET SIZE, BY DISTRIBUTION CHANNEL, 2018-2030 (USD MILLION)
- TABLE 177. NORWAY ANIMAL CHEWABLES MARKET SIZE, BY APPLICATIONS, 2018-2030 (USD MILLION)
- TABLE 178. POLAND ANIMAL CHEWABLES MARKET SIZE, BY COMPOSITION TYPE, 2018-2030 (USD MILLION)
- TABLE 179. POLAND ANIMAL CHEWABLES MARKET SIZE, BY DRUG, 2018-2030 (USD MILLION)
- TABLE 180. POLAND ANIMAL CHEWABLES MARKET SIZE, BY MODE OF PURCHASE, 2018-2030 (USD MILLION)
- TABLE 181. POLAND ANIMAL CHEWABLES MARKET SIZE, BY DISTRIBUTION CHANNEL, 2018-2030 (USD MILLION)
- TABLE 182. POLAND ANIMAL CHEWABLES MARKET SIZE, BY APPLICATIONS, 2018-2030 (USD MILLION)
- TABLE 183. QATAR ANIMAL CHEWABLES MARKET SIZE, BY COMPOSITION TYPE, 2018-2030 (USD MILLION)
- TABLE 184. QATAR ANIMAL CHEWABLES MARKET SIZE, BY DRUG, 2018-2030 (USD MILLION)
- TABLE 185. QATAR ANIMAL CHEWABLES MARKET SIZE, BY MODE OF PURCHASE, 2018-2030 (USD MILLION)
- TABLE 186. QATAR ANIMAL CHEWABLES MARKET SIZE, BY DISTRIBUTION CHANNEL, 2018-2030 (USD MILLION)
- TABLE 187. QATAR ANIMAL CHEWABLES MARKET SIZE, BY APPLICATIONS, 2018-2030 (USD MILLION)
- TABLE 188. RUSSIA ANIMAL CHEWABLES MARKET SIZE, BY COMPOSITION TYPE, 2018-2030 (USD MILLION)
- TABLE 189. RUSSIA ANIMAL CHEWABLES MARKET SIZE, BY DRUG, 2018-2030 (USD MILLION)
- TABLE 190. RUSSIA ANIMAL CHEWABLES MARKET SIZE, BY MODE OF PURCHASE, 2018-2030 (USD MILLION)
- TABLE 191. RUSSIA ANIMAL CHEWABLES MARKET SIZE, BY DISTRIBUTION CHANNEL, 2018-2030 (USD MILLION)
- TABLE 192. RUSSIA ANIMAL CHEWABLES MARKET SIZE, BY APPLICATIONS, 2018-2030 (USD MILLION)
- TABLE 193. SAUDI ARABIA ANIMAL CHEWABLES MARKET SIZE, BY COMPOSITION TYPE, 2018-2030 (USD MILLION)
- TABLE 194. SAUDI ARABIA ANIMAL CHEWABLES MARKET SIZE, BY DRUG, 2018-2030 (USD MILLION)
- TABLE 195. SAUDI ARABIA ANIMAL CHEWABLES MARKET SIZE, BY MODE OF PURCHASE, 2018-2030 (USD MILLION)
- TABLE 196. SAUDI ARABIA ANIMAL CHEWABLES MARKET SIZE, BY DISTRIBUTION CHANNEL, 2018-2030 (USD MILLION)
- TABLE 197. SAUDI ARABIA ANIMAL CHEWABLES MARKET SIZE, BY APPLICATIONS, 2018-2030 (USD MILLION)
- TABLE 198. SOUTH AFRICA ANIMAL CHEWABLES MARKET SIZE, BY COMPOSITION TYPE, 2018-2030 (USD MILLION)
- TABLE 199. SOUTH AFRICA ANIMAL CHEWABLES MARKET SIZE, BY DRUG, 2018-2030 (USD MILLION)
- TABLE 200. SOUTH AFRICA ANIMAL CHEWABLES MARKET SIZE, BY MODE OF PURCHASE, 2018-2030 (USD MILLION)
- TABLE 201. SOUTH AFRICA ANIMAL CHEWABLES MARKET SIZE, BY DISTRIBUTION CHANNEL, 2018-2030 (USD MILLION)
- TABLE 202. SOUTH AFRICA ANIMAL CHEWABLES MARKET SIZE, BY APPLICATIONS, 2018-2030 (USD MILLION)
- TABLE 203. SPAIN ANIMAL CHEWABLES MARKET SIZE, BY COMPOSITION TYPE, 2018-2030 (USD MILLION)
- TABLE 204. SPAIN ANIMAL CHEWABLES MARKET SIZE, BY DRUG, 2018-2030 (USD MILLION)
- TABLE 205. SPAIN ANIMAL CHEWABLES MARKET SIZE, BY MODE OF PURCHASE, 2018-2030 (USD MILLION)
- TABLE 206. SPAIN ANIMAL CHEWABLES MARKET SIZE, BY DISTRIBUTION CHANNEL, 2018-2030 (USD MILLION)
- TABLE 207. SPAIN ANIMAL CHEWABLES MARKET SIZE, BY APPLICATIONS, 2018-2030 (USD MILLION)
- TABLE 208. SWEDEN ANIMAL CHEWABLES MARKET SIZE, BY COMPOSITION TYPE, 2018-2030 (USD MILLION)
- TABLE 209. SWEDEN ANIMAL CHEWABLES MARKET SIZE, BY DRUG, 2018-2030 (USD MILLION)
- TABLE 210. SWEDEN ANIMAL CHEWABLES MARKET SIZE, BY MODE OF PURCHASE, 2018-2030 (USD MILLION)
- TABLE 211. SWEDEN ANIMAL CHEWABLES MARKET SIZE, BY DISTRIBUTION CHANNEL, 2018-2030 (USD MILLION)
- TABLE 212. SWEDEN ANIMAL CHEWABLES MARKET SIZE, BY APPLICATIONS, 2018-2030 (USD MILLION)
- TABLE 213. SWITZERLAND ANIMAL CHEWABLES MARKET SIZE, BY COMPOSITION TYPE, 2018-2030 (USD MILLION)
- TABLE 214. SWITZERLAND ANIMAL CHEWABLES MARKET SIZE, BY DRUG, 2018-2030 (USD MILLION)
- TABLE 215. SWITZERLAND ANIMAL CHEWABLES MARKET SIZE, BY MODE OF PURCHASE, 2018-2030 (USD MILLION)
- TABLE 216. SWITZERLAND ANIMAL CHEWABLES MARKET SIZE, BY DISTRIBUTION CHANNEL, 2018-2030 (USD MILLION)
- TABLE 217. SWITZERLAND ANIMAL CHEWABLES MARKET SIZE, BY APPLICATIONS, 2018-2030 (USD MILLION)
- TABLE 218. TURKEY ANIMAL CHEWABLES MARKET SIZE, BY COMPOSITION TYPE, 2018-2030 (USD MILLION)
- TABLE 219. TURKEY ANIMAL CHEWABLES MARKET SIZE, BY DRUG, 2018-2030 (USD MILLION)
- TABLE 220. TURKEY ANIMAL CHEWABLES MARKET SIZE, BY MODE OF PURCHASE, 2018-2030 (USD MILLION)
- TABLE 221. TURKEY ANIMAL CHEWABLES MARKET SIZE, BY DISTRIBUTION CHANNEL, 2018-2030 (USD MILLION)
- TABLE 222. TURKEY ANIMAL CHEWABLES MARKET SIZE, BY APPLICATIONS, 2018-2030 (USD MILLION)
- TABLE 223. UNITED ARAB EMIRATES ANIMAL CHEWABLES MARKET SIZE, BY COMPOSITION TYPE, 2018-2030 (USD MILLION)
- TABLE 224. UNITED ARAB EMIRATES ANIMAL CHEWABLES MARKET SIZE, BY DRUG, 2018-2030 (USD MILLION)
- TABLE 225. UNITED ARAB EMIRATES ANIMAL CHEWABLES MARKET SIZE, BY MODE OF PURCHASE, 2018-2030 (USD MILLION)
- TABLE 226. UNITED ARAB EMIRATES ANIMAL CHEWABLES MARKET SIZE, BY DISTRIBUTION CHANNEL, 2018-2030 (USD MILLION)
- TABLE 227. UNITED ARAB EMIRATES ANIMAL CHEWABLES MARKET SIZE, BY APPLICATIONS, 2018-2030 (USD MILLION)
- TABLE 228. UNITED KINGDOM ANIMAL CHEWABLES MARKET SIZE, BY COMPOSITION TYPE, 2018-2030 (USD MILLION)
- TABLE 229. UNITED KINGDOM ANIMAL CHEWABLES MARKET SIZE, BY DRUG, 2018-2030 (USD MILLION)
- TABLE 230. UNITED KINGDOM ANIMAL CHEWABLES MARKET SIZE, BY MODE OF PURCHASE, 2018-2030 (USD MILLION)
- TABLE 231. UNITED KINGDOM ANIMAL CHEWABLES MARKET SIZE, BY DISTRIBUTION CHANNEL, 2018-2030 (USD MILLION)
- TABLE 232. UNITED KINGDOM ANIMAL CHEWABLES MARKET SIZE, BY APPLICATIONS, 2018-2030 (USD MILLION)
- TABLE 233. ANIMAL CHEWABLES MARKET, FPNV POSITIONING MATRIX, 2023
- TABLE 234. ANIMAL CHEWABLES MARKET SHARE, BY KEY PLAYER, 2023
- TABLE 235. ANIMAL CHEWABLES MARKET LICENSE & PRICING
 動物用藥品市場:按交付方式、產品類型、動物類型、最終用戶 - 全球預測 2024-2030
 到 2030 年全球寵物和農場動物消毒劑市場預測:按產品、型態、應用、最終用戶和地區進行分析
 全球獸用輔料市場研究報告 - 2024 年至 2032 年產業分析、規模、佔有率、成長、趨勢與預測
 美國動物用藥品市場規模、佔有率和趨勢分析報告:2024-2030年按產品類型、動物類型、給藥途徑、分銷管道和細分市場預測
 動物用輔料市場、份額、規模、趨勢、行業分析報告:按化學組、按功能、按動物用類型、按應用、按地區、按細分市場、預測,2024-2032年
 動物用藥品市場:按類型、產品、應用和最終用戶分類 - 全球預測 2024-2030
 畜牧藥品市場:依藥物、給藥途徑、畜牧動物、通路分類 - 全球預測 2024-2030
 動物添加劑市場規模、佔有率、趨勢分析報告:按應用、按動物類型、按化學組、按功能、按地區、細分市場預測,2024-2030年
 動物用藥品市場規模、佔有率和趨勢分析報告:按產品類型、動物類型、給藥途徑、配銷通路、地區和細分市場預測,2024-2030年
 獸醫市場,按產品、按給藥途徑、按動物類型、按配銷通路、按國家和地區 - 2023-2030 年行業分析、市場規模、市場佔有率和預測