


 |
市場調查報告書
商品編碼
1434941
自動門市場:按門類型、技術和最終用戶 - 2024-2030 年全球預測Automatic Doors Market (AIDC) by Door Type (Automatic Circular Door, Automatic Folding Door, Automatic Revolving Door), Technology (Access Control Systems, Remote Control, RFID-Based), End-User - Global Forecast 2024-2030 |
||||||
※ 本網頁內容可能與最新版本有所差異。詳細情況請與我們聯繫。
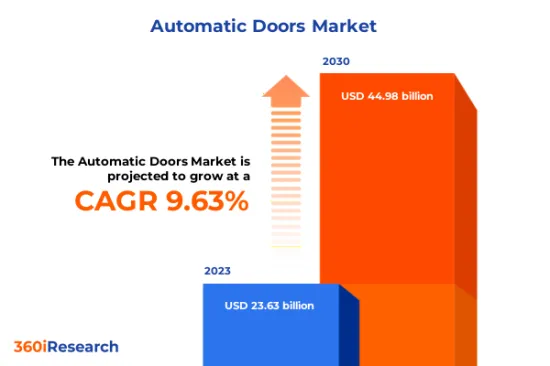
預計2023年自動門市場規模為236.3億美元,預計2024年將達257.9億美元,2030年將達到449.8億美元,複合年成長率為9.63%。
全球自動門市場
| 主要市場統計 | |
|---|---|
| 基準年[2023] | 236.3億美元 |
| 預測年份 [2024] | 257.9億美元 |
| 預測年份 [2030] | 449.8億美元 |
| 複合年成長率(%) | 9.63% |
FPNV定位矩陣
FPNV定位矩陣對於評估自動門市場至關重要。我們檢視與業務策略和產品滿意度相關的關鍵指標,以對供應商進行全面評估。這種深入的分析使用戶能夠根據自己的要求做出明智的決策。根據評估,供應商被分為四個成功程度不同的像限:前沿(F)、探路者(P)、利基(N)和重要(V)。
市場佔有率分析
市場佔有率分析是一個綜合工具,可以對自動門市場供應商的現狀進行深入而深入的研究。全面比較和分析供應商在整體收益、基本客群和其他關鍵指標方面的貢獻,以便更好地了解公司的績效及其在爭奪市場佔有率時面臨的挑戰。此外,該分析還提供了對該行業競爭特徵的寶貴見解,包括在研究基準年觀察到的累積、分散主導地位和合併特徵等因素。這種詳細程度的提高使供應商能夠做出更明智的決策並制定有效的策略,從而在市場上獲得競爭優勢。
該報告對以下幾個方面提供了寶貴的見解:
1-市場滲透率:提供有關主要企業所服務的市場的全面資訊。
2-市場開拓:我們深入研究利潤豐厚的新興市場,並分析它們在成熟細分市場中的滲透率。
3- 市場多元化:提供有關新產品發布、開拓地區、最新發展和投資的詳細資訊。
4-競爭力評估與資訊:對主要企業的市場佔有率、策略、產品、認證、監管狀況、專利狀況、製造能力等進行全面評估。
5- 產品開發與創新:提供對未來技術、研發活動和突破性產品開發的見解。
本報告解決了以下關鍵問題:
1-自動門市場的市場規模和預測是多少?
2-自動門市場預測期間需要考慮投資的產品、細分市場、應用和領域有哪些?
3-自動門市場的技術趨勢和法律規範是什麼?
4-自動門市場主要廠商的市場佔有率是多少?
5-進入自動門市場合適的型態和策略手段是什麼?
目錄
第1章 前言
第2章調查方法
第3章執行摘要
第4章市場概況
第5章市場洞察
- 市場動態
- 促進因素
- 快速的都市化和對住宅和商業建築的需求增加
- 學校、機場、商場自動門採用率高
- 自動門有不同款式可供選擇
- 抑制因素
- 安裝和維護成本高
- 機會
- 將先進的安全措施融入自動門
- 增加零售業的建設活動與投資,引進自動門控制設備
- 任務
- 可能的故障和安全問題
- 促進因素
- 市場區隔分析
- 市場趨勢分析
- 高通膨的累積效應
- 波特五力分析
- 價值鍊和關鍵路徑分析
- 法律規範
第6章以門類型分類的自動門市場
- 自動圓門
- 自動折疊門
- 自動旋轉門
- 自動平移門
- 自動搖擺門
第7章自動門市場:依技術分類
- 門禁系統
- 遙控器
- 基於RFID
- 感測器底座
第8章自動門市場:依最終用戶分類
- 商業的
- 工業的
- 住宅
第9章 美洲自動門市場
- 阿根廷
- 巴西
- 加拿大
- 墨西哥
- 美國
第10章亞太地區自動門市場
- 澳洲
- 中國
- 印度
- 印尼
- 日本
- 馬來西亞
- 菲律賓
- 新加坡
- 韓國
- 台灣
- 泰國
- 越南
第11章 歐洲、中東、非洲自動門市場
- 丹麥
- 埃及
- 芬蘭
- 法國
- 德國
- 以色列
- 義大利
- 荷蘭
- 奈及利亞
- 挪威
- 波蘭
- 卡達
- 俄羅斯
- 沙烏地阿拉伯
- 南非
- 西班牙
- 瑞典
- 瑞士
- 土耳其
- 阿拉伯聯合大公國
- 英國
第12章競爭形勢
- FPNV定位矩陣
- 市場佔有率分析:主要企業
- 主要企業競爭情境分析
第13章競爭產品組合
- 主要公司簡介
- Allegion PLC
- Alumitech Window and Door Solutions
- Assa Abloy AB
- Avanti Systems
- Deutschtec GmbH
- Dormakaba International Holding AG
- DSS Automatic Doors by FAAC Group
- Formula Automatic Door Co., Inc.
- Foshan Huadi Metal Produce Co., Ltd.
- GEZE GmbH
- GRUPSA GLOBAL, SL
- GU Automatic GmbH
- Haida Door Control Co., Ltd.
- Hangzhou Safedoor Automation & Hardware Co., Ltd.
- KBB Automatic Door Group
- MANUSA GEST, SL
- Matz-Erreka, S. Coop.
- Maxwell Automatic Doors Co, LLC
- Nabtesco Corporation
- Osent Automatic Door Group
- Overhead Door Corporation
- Panasonic Corporation
- PORTALP FRANCE SAS
- RGPRO Automatic Door Systems
- Rite-Hite Holding Corporation
- Royal Boon Edam International BV
- Sanwa Holdings Corporation
- Sanway Technology
- Shenzhen Hongfa Automatic Door Co., Ltd.
- Tormax by LANDERT Group AG
- 主要產品系列
第14章附錄
- 討論指南
- 關於許可證和定價
[197 Pages Report] The Automatic Doors Market size was estimated at USD 23.63 billion in 2023 and expected to reach USD 25.79 billion in 2024, at a CAGR 9.63% to reach USD 44.98 billion by 2030.
Global Automatic Doors Market
| KEY MARKET STATISTICS | |
|---|---|
| Base Year [2023] | USD 23.63 billion |
| Estimated Year [2024] | USD 25.79 billion |
| Forecast Year [2030] | USD 44.98 billion |
| CAGR (%) | 9.63% |
FPNV Positioning Matrix
The FPNV Positioning Matrix is pivotal in evaluating the Automatic Doors Market. It offers a comprehensive assessment of vendors, examining key metrics related to Business Strategy and Product Satisfaction. This in-depth analysis empowers users to make well-informed decisions aligned with their requirements. Based on the evaluation, the vendors are then categorized into four distinct quadrants representing varying levels of success: Forefront (F), Pathfinder (P), Niche (N), or Vital (V).
Market Share Analysis
The Market Share Analysis is a comprehensive tool that provides an insightful and in-depth examination of the current state of vendors in the Automatic Doors Market. By meticulously comparing and analyzing vendor contributions in terms of overall revenue, customer base, and other key metrics, we can offer companies a greater understanding of their performance and the challenges they face when competing for market share. Additionally, this analysis provides valuable insights into the competitive nature of the sector, including factors such as accumulation, fragmentation dominance, and amalgamation traits observed over the base year period studied. With this expanded level of detail, vendors can make more informed decisions and devise effective strategies to gain a competitive edge in the market.
Key Company Profiles
The report delves into recent significant developments in the Automatic Doors Market, highlighting leading vendors and their innovative profiles. These include Allegion PLC, Alumitech Window and Door Solutions, Assa Abloy AB, Avanti Systems, Deutschtec GmbH, Dormakaba International Holding AG, DSS Automatic Doors by FAAC Group, Formula Automatic Door Co., Inc., Foshan Huadi Metal Produce Co., Ltd., GEZE GmbH, GRUPSA GLOBAL, SL, GU Automatic GmbH, Haida Door Control Co., Ltd., Hangzhou Safedoor Automation & Hardware Co., Ltd., KBB Automatic Door Group, MANUSA GEST, S.L., Matz-Erreka, S. Coop., Maxwell Automatic Doors Co, LLC, Nabtesco Corporation, Osent Automatic Door Group, Overhead Door Corporation, Panasonic Corporation, PORTALP FRANCE SAS, RGPRO Automatic Door Systems, Rite-Hite Holding Corporation, Royal Boon Edam International B.V., Sanwa Holdings Corporation, Sanway Technology, Shenzhen Hongfa Automatic Door Co., Ltd., and Tormax by LANDERT Group AG.
Market Segmentation & Coverage
This research report categorizes the Automatic Doors Market to forecast the revenues and analyze trends in each of the following sub-markets:
- Door Type
- Automatic Circular Door
- Automatic Folding Door
- Automatic Revolving Door
- Automatic Sliding Door
- Automatic Swinging Door
- Technology
- Access Control Systems
- Remote Control
- RFID-Based
- Sensor-Based
- End-User
- Commercial
- Industrial
- Residential
- Region
- Americas
- Argentina
- Brazil
- Canada
- Mexico
- United States
- California
- Florida
- Illinois
- New York
- Ohio
- Pennsylvania
- Texas
- Asia-Pacific
- Australia
- China
- India
- Indonesia
- Japan
- Malaysia
- Philippines
- Singapore
- South Korea
- Taiwan
- Thailand
- Vietnam
- Europe, Middle East & Africa
- Denmark
- Egypt
- Finland
- France
- Germany
- Israel
- Italy
- Netherlands
- Nigeria
- Norway
- Poland
- Qatar
- Russia
- Saudi Arabia
- South Africa
- Spain
- Sweden
- Switzerland
- Turkey
- United Arab Emirates
- United Kingdom
- Americas
The report offers valuable insights on the following aspects:
1. Market Penetration: It presents comprehensive information on the market provided by key players.
2. Market Development: It delves deep into lucrative emerging markets and analyzes the penetration across mature market segments.
3. Market Diversification: It provides detailed information on new product launches, untapped geographic regions, recent developments, and investments.
4. Competitive Assessment & Intelligence: It conducts an exhaustive assessment of market shares, strategies, products, certifications, regulatory approvals, patent landscape, and manufacturing capabilities of the leading players.
5. Product Development & Innovation: It offers intelligent insights on future technologies, R&D activities, and breakthrough product developments.
The report addresses key questions such as:
1. What is the market size and forecast of the Automatic Doors Market?
2. Which products, segments, applications, and areas should one consider investing in over the forecast period in the Automatic Doors Market?
3. What are the technology trends and regulatory frameworks in the Automatic Doors Market?
4. What is the market share of the leading vendors in the Automatic Doors Market?
5. Which modes and strategic moves are suitable for entering the Automatic Doors Market?
Table of Contents
1. Preface
- 1.1. Objectives of the Study
- 1.2. Market Segmentation & Coverage
- 1.3. Years Considered for the Study
- 1.4. Currency & Pricing
- 1.5. Language
- 1.6. Limitations
- 1.7. Assumptions
- 1.8. Stakeholders
2. Research Methodology
- 2.1. Define: Research Objective
- 2.2. Determine: Research Design
- 2.3. Prepare: Research Instrument
- 2.4. Collect: Data Source
- 2.5. Analyze: Data Interpretation
- 2.6. Formulate: Data Verification
- 2.7. Publish: Research Report
- 2.8. Repeat: Report Update
3. Executive Summary
4. Market Overview
- 4.1. Introduction
- 4.2. Automatic Doors Market, by Region
5. Market Insights
- 5.1. Market Dynamics
- 5.1.1. Drivers
- 5.1.1.1. Rapid urbanization and increasing demand for residential and commercial buildings
- 5.1.1.2. High adoption of automatic doors in schools, airports, and malls
- 5.1.1.3. Availability of different style options in automatic doors
- 5.1.2. Restraints
- 5.1.2.1. High installation and maintenance cost
- 5.1.3. Opportunities
- 5.1.3.1. Integration of advanced safety measures into automatic doors
- 5.1.3.2. Increased investment in construction activities and retail sectors for deploying automatic door controls
- 5.1.4. Challenges
- 5.1.4.1. Possibility of malfunctioning and security concerns
- 5.1.1. Drivers
- 5.2. Market Segmentation Analysis
- 5.3. Market Trend Analysis
- 5.4. Cumulative Impact of High Inflation
- 5.5. Porter's Five Forces Analysis
- 5.5.1. Threat of New Entrants
- 5.5.2. Threat of Substitutes
- 5.5.3. Bargaining Power of Customers
- 5.5.4. Bargaining Power of Suppliers
- 5.5.5. Industry Rivalry
- 5.6. Value Chain & Critical Path Analysis
- 5.7. Regulatory Framework
6. Automatic Doors Market, by Door Type
- 6.1. Introduction
- 6.2. Automatic Circular Door
- 6.3. Automatic Folding Door
- 6.4. Automatic Revolving Door
- 6.5. Automatic Sliding Door
- 6.6. Automatic Swinging Door
7. Automatic Doors Market, by Technology
- 7.1. Introduction
- 7.2. Access Control Systems
- 7.3. Remote Control
- 7.4. RFID-Based
- 7.5. Sensor-Based
8. Automatic Doors Market, by End-User
- 8.1. Introduction
- 8.2. Commercial
- 8.3. Industrial
- 8.4. Residential
9. Americas Automatic Doors Market
- 9.1. Introduction
- 9.2. Argentina
- 9.3. Brazil
- 9.4. Canada
- 9.5. Mexico
- 9.6. United States
10. Asia-Pacific Automatic Doors Market
- 10.1. Introduction
- 10.2. Australia
- 10.3. China
- 10.4. India
- 10.5. Indonesia
- 10.6. Japan
- 10.7. Malaysia
- 10.8. Philippines
- 10.9. Singapore
- 10.10. South Korea
- 10.11. Taiwan
- 10.12. Thailand
- 10.13. Vietnam
11. Europe, Middle East & Africa Automatic Doors Market
- 11.1. Introduction
- 11.2. Denmark
- 11.3. Egypt
- 11.4. Finland
- 11.5. France
- 11.6. Germany
- 11.7. Israel
- 11.8. Italy
- 11.9. Netherlands
- 11.10. Nigeria
- 11.11. Norway
- 11.12. Poland
- 11.13. Qatar
- 11.14. Russia
- 11.15. Saudi Arabia
- 11.16. South Africa
- 11.17. Spain
- 11.18. Sweden
- 11.19. Switzerland
- 11.20. Turkey
- 11.21. United Arab Emirates
- 11.22. United Kingdom
12. Competitive Landscape
- 12.1. FPNV Positioning Matrix
- 12.2. Market Share Analysis, By Key Player
- 12.3. Competitive Scenario Analysis, By Key Player
13. Competitive Portfolio
- 13.1. Key Company Profiles
- 13.1.1. Allegion PLC
- 13.1.2. Alumitech Window and Door Solutions
- 13.1.3. Assa Abloy AB
- 13.1.4. Avanti Systems
- 13.1.5. Deutschtec GmbH
- 13.1.6. Dormakaba International Holding AG
- 13.1.7. DSS Automatic Doors by FAAC Group
- 13.1.8. Formula Automatic Door Co., Inc.
- 13.1.9. Foshan Huadi Metal Produce Co., Ltd.
- 13.1.10. GEZE GmbH
- 13.1.11. GRUPSA GLOBAL, SL
- 13.1.12. GU Automatic GmbH
- 13.1.13. Haida Door Control Co., Ltd.
- 13.1.14. Hangzhou Safedoor Automation & Hardware Co., Ltd.
- 13.1.15. KBB Automatic Door Group
- 13.1.16. MANUSA GEST, S.L.
- 13.1.17. Matz-Erreka, S. Coop.
- 13.1.18. Maxwell Automatic Doors Co, LLC
- 13.1.19. Nabtesco Corporation
- 13.1.20. Osent Automatic Door Group
- 13.1.21. Overhead Door Corporation
- 13.1.22. Panasonic Corporation
- 13.1.23. PORTALP FRANCE SAS
- 13.1.24. RGPRO Automatic Door Systems
- 13.1.25. Rite-Hite Holding Corporation
- 13.1.26. Royal Boon Edam International B.V.
- 13.1.27. Sanwa Holdings Corporation
- 13.1.28. Sanway Technology
- 13.1.29. Shenzhen Hongfa Automatic Door Co., Ltd.
- 13.1.30. Tormax by LANDERT Group AG
- 13.2. Key Product Portfolio
14. Appendix
- 14.1. Discussion Guide
- 14.2. License & Pricing
LIST OF FIGURES
- FIGURE 1. AUTOMATIC DOORS MARKET RESEARCH PROCESS
- FIGURE 2. AUTOMATIC DOORS MARKET SIZE, 2023 VS 2030
- FIGURE 3. AUTOMATIC DOORS MARKET SIZE, 2018-2030 (USD MILLION)
- FIGURE 4. AUTOMATIC DOORS MARKET SIZE, BY REGION, 2023 VS 2030 (%)
- FIGURE 5. AUTOMATIC DOORS MARKET SIZE, BY REGION, 2023 VS 2024 VS 2030 (USD MILLION)
- FIGURE 6. AUTOMATIC DOORS MARKET DYNAMICS
- FIGURE 7. AUTOMATIC DOORS MARKET SIZE, BY DOOR TYPE, 2023 VS 2030 (%)
- FIGURE 8. AUTOMATIC DOORS MARKET SIZE, BY DOOR TYPE, 2023 VS 2024 VS 2030 (USD MILLION)
- FIGURE 9. AUTOMATIC DOORS MARKET SIZE, BY TECHNOLOGY, 2023 VS 2030 (%)
- FIGURE 10. AUTOMATIC DOORS MARKET SIZE, BY TECHNOLOGY, 2023 VS 2024 VS 2030 (USD MILLION)
- FIGURE 11. AUTOMATIC DOORS MARKET SIZE, BY END-USER, 2023 VS 2030 (%)
- FIGURE 12. AUTOMATIC DOORS MARKET SIZE, BY END-USER, 2023 VS 2024 VS 2030 (USD MILLION)
- FIGURE 13. AMERICAS AUTOMATIC DOORS MARKET SIZE, BY COUNTRY, 2023 VS 2030 (%)
- FIGURE 14. AMERICAS AUTOMATIC DOORS MARKET SIZE, BY COUNTRY, 2023 VS 2024 VS 2030 (USD MILLION)
- FIGURE 15. UNITED STATES AUTOMATIC DOORS MARKET SIZE, BY STATE, 2023 VS 2030 (%)
- FIGURE 16. UNITED STATES AUTOMATIC DOORS MARKET SIZE, BY STATE, 2023 VS 2024 VS 2030 (USD MILLION)
- FIGURE 17. ASIA-PACIFIC AUTOMATIC DOORS MARKET SIZE, BY COUNTRY, 2023 VS 2030 (%)
- FIGURE 18. ASIA-PACIFIC AUTOMATIC DOORS MARKET SIZE, BY COUNTRY, 2023 VS 2024 VS 2030 (USD MILLION)
- FIGURE 19. EUROPE, MIDDLE EAST & AFRICA AUTOMATIC DOORS MARKET SIZE, BY COUNTRY, 2023 VS 2030 (%)
- FIGURE 20. EUROPE, MIDDLE EAST & AFRICA AUTOMATIC DOORS MARKET SIZE, BY COUNTRY, 2023 VS 2024 VS 2030 (USD MILLION)
- FIGURE 21. AUTOMATIC DOORS MARKET, FPNV POSITIONING MATRIX, 2023
- FIGURE 22. AUTOMATIC DOORS MARKET SHARE, BY KEY PLAYER, 2023
LIST OF TABLES
- TABLE 1. AUTOMATIC DOORS MARKET SEGMENTATION & COVERAGE
- TABLE 2. UNITED STATES DOLLAR EXCHANGE RATE, 2018-2023
- TABLE 3. AUTOMATIC DOORS MARKET SIZE, 2018-2030 (USD MILLION)
- TABLE 4. GLOBAL AUTOMATIC DOORS MARKET SIZE, BY REGION, 2018-2030 (USD MILLION)
- TABLE 5. AUTOMATIC DOORS MARKET SIZE, BY DOOR TYPE, 2018-2030 (USD MILLION)
- TABLE 6. AUTOMATIC DOORS MARKET SIZE, BY AUTOMATIC CIRCULAR DOOR, BY REGION, 2018-2030 (USD MILLION)
- TABLE 7. AUTOMATIC DOORS MARKET SIZE, BY AUTOMATIC FOLDING DOOR, BY REGION, 2018-2030 (USD MILLION)
- TABLE 8. AUTOMATIC DOORS MARKET SIZE, BY AUTOMATIC REVOLVING DOOR, BY REGION, 2018-2030 (USD MILLION)
- TABLE 9. AUTOMATIC DOORS MARKET SIZE, BY AUTOMATIC SLIDING DOOR, BY REGION, 2018-2030 (USD MILLION)
- TABLE 10. AUTOMATIC DOORS MARKET SIZE, BY AUTOMATIC SWINGING DOOR, BY REGION, 2018-2030 (USD MILLION)
- TABLE 11. AUTOMATIC DOORS MARKET SIZE, BY TECHNOLOGY, 2018-2030 (USD MILLION)
- TABLE 12. AUTOMATIC DOORS MARKET SIZE, BY ACCESS CONTROL SYSTEMS, BY REGION, 2018-2030 (USD MILLION)
- TABLE 13. AUTOMATIC DOORS MARKET SIZE, BY REMOTE CONTROL, BY REGION, 2018-2030 (USD MILLION)
- TABLE 14. AUTOMATIC DOORS MARKET SIZE, BY RFID-BASED, BY REGION, 2018-2030 (USD MILLION)
- TABLE 15. AUTOMATIC DOORS MARKET SIZE, BY SENSOR-BASED, BY REGION, 2018-2030 (USD MILLION)
- TABLE 16. AUTOMATIC DOORS MARKET SIZE, BY END-USER, 2018-2030 (USD MILLION)
- TABLE 17. AUTOMATIC DOORS MARKET SIZE, BY COMMERCIAL, BY REGION, 2018-2030 (USD MILLION)
- TABLE 18. AUTOMATIC DOORS MARKET SIZE, BY INDUSTRIAL, BY REGION, 2018-2030 (USD MILLION)
- TABLE 19. AUTOMATIC DOORS MARKET SIZE, BY RESIDENTIAL, BY REGION, 2018-2030 (USD MILLION)
- TABLE 20. AMERICAS AUTOMATIC DOORS MARKET SIZE, BY DOOR TYPE, 2018-2030 (USD MILLION)
- TABLE 21. AMERICAS AUTOMATIC DOORS MARKET SIZE, BY TECHNOLOGY, 2018-2030 (USD MILLION)
- TABLE 22. AMERICAS AUTOMATIC DOORS MARKET SIZE, BY END-USER, 2018-2030 (USD MILLION)
- TABLE 23. AMERICAS AUTOMATIC DOORS MARKET SIZE, BY COUNTRY, 2018-2030 (USD MILLION)
- TABLE 24. ARGENTINA AUTOMATIC DOORS MARKET SIZE, BY DOOR TYPE, 2018-2030 (USD MILLION)
- TABLE 25. ARGENTINA AUTOMATIC DOORS MARKET SIZE, BY TECHNOLOGY, 2018-2030 (USD MILLION)
- TABLE 26. ARGENTINA AUTOMATIC DOORS MARKET SIZE, BY END-USER, 2018-2030 (USD MILLION)
- TABLE 27. BRAZIL AUTOMATIC DOORS MARKET SIZE, BY DOOR TYPE, 2018-2030 (USD MILLION)
- TABLE 28. BRAZIL AUTOMATIC DOORS MARKET SIZE, BY TECHNOLOGY, 2018-2030 (USD MILLION)
- TABLE 29. BRAZIL AUTOMATIC DOORS MARKET SIZE, BY END-USER, 2018-2030 (USD MILLION)
- TABLE 30. CANADA AUTOMATIC DOORS MARKET SIZE, BY DOOR TYPE, 2018-2030 (USD MILLION)
- TABLE 31. CANADA AUTOMATIC DOORS MARKET SIZE, BY TECHNOLOGY, 2018-2030 (USD MILLION)
- TABLE 32. CANADA AUTOMATIC DOORS MARKET SIZE, BY END-USER, 2018-2030 (USD MILLION)
- TABLE 33. MEXICO AUTOMATIC DOORS MARKET SIZE, BY DOOR TYPE, 2018-2030 (USD MILLION)
- TABLE 34. MEXICO AUTOMATIC DOORS MARKET SIZE, BY TECHNOLOGY, 2018-2030 (USD MILLION)
- TABLE 35. MEXICO AUTOMATIC DOORS MARKET SIZE, BY END-USER, 2018-2030 (USD MILLION)
- TABLE 36. UNITED STATES AUTOMATIC DOORS MARKET SIZE, BY DOOR TYPE, 2018-2030 (USD MILLION)
- TABLE 37. UNITED STATES AUTOMATIC DOORS MARKET SIZE, BY TECHNOLOGY, 2018-2030 (USD MILLION)
- TABLE 38. UNITED STATES AUTOMATIC DOORS MARKET SIZE, BY END-USER, 2018-2030 (USD MILLION)
- TABLE 39. UNITED STATES AUTOMATIC DOORS MARKET SIZE, BY STATE, 2018-2030 (USD MILLION)
- TABLE 40. ASIA-PACIFIC AUTOMATIC DOORS MARKET SIZE, BY DOOR TYPE, 2018-2030 (USD MILLION)
- TABLE 41. ASIA-PACIFIC AUTOMATIC DOORS MARKET SIZE, BY TECHNOLOGY, 2018-2030 (USD MILLION)
- TABLE 42. ASIA-PACIFIC AUTOMATIC DOORS MARKET SIZE, BY END-USER, 2018-2030 (USD MILLION)
- TABLE 43. ASIA-PACIFIC AUTOMATIC DOORS MARKET SIZE, BY COUNTRY, 2018-2030 (USD MILLION)
- TABLE 44. AUSTRALIA AUTOMATIC DOORS MARKET SIZE, BY DOOR TYPE, 2018-2030 (USD MILLION)
- TABLE 45. AUSTRALIA AUTOMATIC DOORS MARKET SIZE, BY TECHNOLOGY, 2018-2030 (USD MILLION)
- TABLE 46. AUSTRALIA AUTOMATIC DOORS MARKET SIZE, BY END-USER, 2018-2030 (USD MILLION)
- TABLE 47. CHINA AUTOMATIC DOORS MARKET SIZE, BY DOOR TYPE, 2018-2030 (USD MILLION)
- TABLE 48. CHINA AUTOMATIC DOORS MARKET SIZE, BY TECHNOLOGY, 2018-2030 (USD MILLION)
- TABLE 49. CHINA AUTOMATIC DOORS MARKET SIZE, BY END-USER, 2018-2030 (USD MILLION)
- TABLE 50. INDIA AUTOMATIC DOORS MARKET SIZE, BY DOOR TYPE, 2018-2030 (USD MILLION)
- TABLE 51. INDIA AUTOMATIC DOORS MARKET SIZE, BY TECHNOLOGY, 2018-2030 (USD MILLION)
- TABLE 52. INDIA AUTOMATIC DOORS MARKET SIZE, BY END-USER, 2018-2030 (USD MILLION)
- TABLE 53. INDONESIA AUTOMATIC DOORS MARKET SIZE, BY DOOR TYPE, 2018-2030 (USD MILLION)
- TABLE 54. INDONESIA AUTOMATIC DOORS MARKET SIZE, BY TECHNOLOGY, 2018-2030 (USD MILLION)
- TABLE 55. INDONESIA AUTOMATIC DOORS MARKET SIZE, BY END-USER, 2018-2030 (USD MILLION)
- TABLE 56. JAPAN AUTOMATIC DOORS MARKET SIZE, BY DOOR TYPE, 2018-2030 (USD MILLION)
- TABLE 57. JAPAN AUTOMATIC DOORS MARKET SIZE, BY TECHNOLOGY, 2018-2030 (USD MILLION)
- TABLE 58. JAPAN AUTOMATIC DOORS MARKET SIZE, BY END-USER, 2018-2030 (USD MILLION)
- TABLE 59. MALAYSIA AUTOMATIC DOORS MARKET SIZE, BY DOOR TYPE, 2018-2030 (USD MILLION)
- TABLE 60. MALAYSIA AUTOMATIC DOORS MARKET SIZE, BY TECHNOLOGY, 2018-2030 (USD MILLION)
- TABLE 61. MALAYSIA AUTOMATIC DOORS MARKET SIZE, BY END-USER, 2018-2030 (USD MILLION)
- TABLE 62. PHILIPPINES AUTOMATIC DOORS MARKET SIZE, BY DOOR TYPE, 2018-2030 (USD MILLION)
- TABLE 63. PHILIPPINES AUTOMATIC DOORS MARKET SIZE, BY TECHNOLOGY, 2018-2030 (USD MILLION)
- TABLE 64. PHILIPPINES AUTOMATIC DOORS MARKET SIZE, BY END-USER, 2018-2030 (USD MILLION)
- TABLE 65. SINGAPORE AUTOMATIC DOORS MARKET SIZE, BY DOOR TYPE, 2018-2030 (USD MILLION)
- TABLE 66. SINGAPORE AUTOMATIC DOORS MARKET SIZE, BY TECHNOLOGY, 2018-2030 (USD MILLION)
- TABLE 67. SINGAPORE AUTOMATIC DOORS MARKET SIZE, BY END-USER, 2018-2030 (USD MILLION)
- TABLE 68. SOUTH KOREA AUTOMATIC DOORS MARKET SIZE, BY DOOR TYPE, 2018-2030 (USD MILLION)
- TABLE 69. SOUTH KOREA AUTOMATIC DOORS MARKET SIZE, BY TECHNOLOGY, 2018-2030 (USD MILLION)
- TABLE 70. SOUTH KOREA AUTOMATIC DOORS MARKET SIZE, BY END-USER, 2018-2030 (USD MILLION)
- TABLE 71. TAIWAN AUTOMATIC DOORS MARKET SIZE, BY DOOR TYPE, 2018-2030 (USD MILLION)
- TABLE 72. TAIWAN AUTOMATIC DOORS MARKET SIZE, BY TECHNOLOGY, 2018-2030 (USD MILLION)
- TABLE 73. TAIWAN AUTOMATIC DOORS MARKET SIZE, BY END-USER, 2018-2030 (USD MILLION)
- TABLE 74. THAILAND AUTOMATIC DOORS MARKET SIZE, BY DOOR TYPE, 2018-2030 (USD MILLION)
- TABLE 75. THAILAND AUTOMATIC DOORS MARKET SIZE, BY TECHNOLOGY, 2018-2030 (USD MILLION)
- TABLE 76. THAILAND AUTOMATIC DOORS MARKET SIZE, BY END-USER, 2018-2030 (USD MILLION)
- TABLE 77. VIETNAM AUTOMATIC DOORS MARKET SIZE, BY DOOR TYPE, 2018-2030 (USD MILLION)
- TABLE 78. VIETNAM AUTOMATIC DOORS MARKET SIZE, BY TECHNOLOGY, 2018-2030 (USD MILLION)
- TABLE 79. VIETNAM AUTOMATIC DOORS MARKET SIZE, BY END-USER, 2018-2030 (USD MILLION)
- TABLE 80. EUROPE, MIDDLE EAST & AFRICA AUTOMATIC DOORS MARKET SIZE, BY DOOR TYPE, 2018-2030 (USD MILLION)
- TABLE 81. EUROPE, MIDDLE EAST & AFRICA AUTOMATIC DOORS MARKET SIZE, BY TECHNOLOGY, 2018-2030 (USD MILLION)
- TABLE 82. EUROPE, MIDDLE EAST & AFRICA AUTOMATIC DOORS MARKET SIZE, BY END-USER, 2018-2030 (USD MILLION)
- TABLE 83. EUROPE, MIDDLE EAST & AFRICA AUTOMATIC DOORS MARKET SIZE, BY COUNTRY, 2018-2030 (USD MILLION)
- TABLE 84. DENMARK AUTOMATIC DOORS MARKET SIZE, BY DOOR TYPE, 2018-2030 (USD MILLION)
- TABLE 85. DENMARK AUTOMATIC DOORS MARKET SIZE, BY TECHNOLOGY, 2018-2030 (USD MILLION)
- TABLE 86. DENMARK AUTOMATIC DOORS MARKET SIZE, BY END-USER, 2018-2030 (USD MILLION)
- TABLE 87. EGYPT AUTOMATIC DOORS MARKET SIZE, BY DOOR TYPE, 2018-2030 (USD MILLION)
- TABLE 88. EGYPT AUTOMATIC DOORS MARKET SIZE, BY TECHNOLOGY, 2018-2030 (USD MILLION)
- TABLE 89. EGYPT AUTOMATIC DOORS MARKET SIZE, BY END-USER, 2018-2030 (USD MILLION)
- TABLE 90. FINLAND AUTOMATIC DOORS MARKET SIZE, BY DOOR TYPE, 2018-2030 (USD MILLION)
- TABLE 91. FINLAND AUTOMATIC DOORS MARKET SIZE, BY TECHNOLOGY, 2018-2030 (USD MILLION)
- TABLE 92. FINLAND AUTOMATIC DOORS MARKET SIZE, BY END-USER, 2018-2030 (USD MILLION)
- TABLE 93. FRANCE AUTOMATIC DOORS MARKET SIZE, BY DOOR TYPE, 2018-2030 (USD MILLION)
- TABLE 94. FRANCE AUTOMATIC DOORS MARKET SIZE, BY TECHNOLOGY, 2018-2030 (USD MILLION)
- TABLE 95. FRANCE AUTOMATIC DOORS MARKET SIZE, BY END-USER, 2018-2030 (USD MILLION)
- TABLE 96. GERMANY AUTOMATIC DOORS MARKET SIZE, BY DOOR TYPE, 2018-2030 (USD MILLION)
- TABLE 97. GERMANY AUTOMATIC DOORS MARKET SIZE, BY TECHNOLOGY, 2018-2030 (USD MILLION)
- TABLE 98. GERMANY AUTOMATIC DOORS MARKET SIZE, BY END-USER, 2018-2030 (USD MILLION)
- TABLE 99. ISRAEL AUTOMATIC DOORS MARKET SIZE, BY DOOR TYPE, 2018-2030 (USD MILLION)
- TABLE 100. ISRAEL AUTOMATIC DOORS MARKET SIZE, BY TECHNOLOGY, 2018-2030 (USD MILLION)
- TABLE 101. ISRAEL AUTOMATIC DOORS MARKET SIZE, BY END-USER, 2018-2030 (USD MILLION)
- TABLE 102. ITALY AUTOMATIC DOORS MARKET SIZE, BY DOOR TYPE, 2018-2030 (USD MILLION)
- TABLE 103. ITALY AUTOMATIC DOORS MARKET SIZE, BY TECHNOLOGY, 2018-2030 (USD MILLION)
- TABLE 104. ITALY AUTOMATIC DOORS MARKET SIZE, BY END-USER, 2018-2030 (USD MILLION)
- TABLE 105. NETHERLANDS AUTOMATIC DOORS MARKET SIZE, BY DOOR TYPE, 2018-2030 (USD MILLION)
- TABLE 106. NETHERLANDS AUTOMATIC DOORS MARKET SIZE, BY TECHNOLOGY, 2018-2030 (USD MILLION)
- TABLE 107. NETHERLANDS AUTOMATIC DOORS MARKET SIZE, BY END-USER, 2018-2030 (USD MILLION)
- TABLE 108. NIGERIA AUTOMATIC DOORS MARKET SIZE, BY DOOR TYPE, 2018-2030 (USD MILLION)
- TABLE 109. NIGERIA AUTOMATIC DOORS MARKET SIZE, BY TECHNOLOGY, 2018-2030 (USD MILLION)
- TABLE 110. NIGERIA AUTOMATIC DOORS MARKET SIZE, BY END-USER, 2018-2030 (USD MILLION)
- TABLE 111. NORWAY AUTOMATIC DOORS MARKET SIZE, BY DOOR TYPE, 2018-2030 (USD MILLION)
- TABLE 112. NORWAY AUTOMATIC DOORS MARKET SIZE, BY TECHNOLOGY, 2018-2030 (USD MILLION)
- TABLE 113. NORWAY AUTOMATIC DOORS MARKET SIZE, BY END-USER, 2018-2030 (USD MILLION)
- TABLE 114. POLAND AUTOMATIC DOORS MARKET SIZE, BY DOOR TYPE, 2018-2030 (USD MILLION)
- TABLE 115. POLAND AUTOMATIC DOORS MARKET SIZE, BY TECHNOLOGY, 2018-2030 (USD MILLION)
- TABLE 116. POLAND AUTOMATIC DOORS MARKET SIZE, BY END-USER, 2018-2030 (USD MILLION)
- TABLE 117. QATAR AUTOMATIC DOORS MARKET SIZE, BY DOOR TYPE, 2018-2030 (USD MILLION)
- TABLE 118. QATAR AUTOMATIC DOORS MARKET SIZE, BY TECHNOLOGY, 2018-2030 (USD MILLION)
- TABLE 119. QATAR AUTOMATIC DOORS MARKET SIZE, BY END-USER, 2018-2030 (USD MILLION)
- TABLE 120. RUSSIA AUTOMATIC DOORS MARKET SIZE, BY DOOR TYPE, 2018-2030 (USD MILLION)
- TABLE 121. RUSSIA AUTOMATIC DOORS MARKET SIZE, BY TECHNOLOGY, 2018-2030 (USD MILLION)
- TABLE 122. RUSSIA AUTOMATIC DOORS MARKET SIZE, BY END-USER, 2018-2030 (USD MILLION)
- TABLE 123. SAUDI ARABIA AUTOMATIC DOORS MARKET SIZE, BY DOOR TYPE, 2018-2030 (USD MILLION)
- TABLE 124. SAUDI ARABIA AUTOMATIC DOORS MARKET SIZE, BY TECHNOLOGY, 2018-2030 (USD MILLION)
- TABLE 125. SAUDI ARABIA AUTOMATIC DOORS MARKET SIZE, BY END-USER, 2018-2030 (USD MILLION)
- TABLE 126. SOUTH AFRICA AUTOMATIC DOORS MARKET SIZE, BY DOOR TYPE, 2018-2030 (USD MILLION)
- TABLE 127. SOUTH AFRICA AUTOMATIC DOORS MARKET SIZE, BY TECHNOLOGY, 2018-2030 (USD MILLION)
- TABLE 128. SOUTH AFRICA AUTOMATIC DOORS MARKET SIZE, BY END-USER, 2018-2030 (USD MILLION)
- TABLE 129. SPAIN AUTOMATIC DOORS MARKET SIZE, BY DOOR TYPE, 2018-2030 (USD MILLION)
- TABLE 130. SPAIN AUTOMATIC DOORS MARKET SIZE, BY TECHNOLOGY, 2018-2030 (USD MILLION)
- TABLE 131. SPAIN AUTOMATIC DOORS MARKET SIZE, BY END-USER, 2018-2030 (USD MILLION)
- TABLE 132. SWEDEN AUTOMATIC DOORS MARKET SIZE, BY DOOR TYPE, 2018-2030 (USD MILLION)
- TABLE 133. SWEDEN AUTOMATIC DOORS MARKET SIZE, BY TECHNOLOGY, 2018-2030 (USD MILLION)
- TABLE 134. SWEDEN AUTOMATIC DOORS MARKET SIZE, BY END-USER, 2018-2030 (USD MILLION)
- TABLE 135. SWITZERLAND AUTOMATIC DOORS MARKET SIZE, BY DOOR TYPE, 2018-2030 (USD MILLION)
- TABLE 136. SWITZERLAND AUTOMATIC DOORS MARKET SIZE, BY TECHNOLOGY, 2018-2030 (USD MILLION)
- TABLE 137. SWITZERLAND AUTOMATIC DOORS MARKET SIZE, BY END-USER, 2018-2030 (USD MILLION)
- TABLE 138. TURKEY AUTOMATIC DOORS MARKET SIZE, BY DOOR TYPE, 2018-2030 (USD MILLION)
- TABLE 139. TURKEY AUTOMATIC DOORS MARKET SIZE, BY TECHNOLOGY, 2018-2030 (USD MILLION)
- TABLE 140. TURKEY AUTOMATIC DOORS MARKET SIZE, BY END-USER, 2018-2030 (USD MILLION)
- TABLE 141. UNITED ARAB EMIRATES AUTOMATIC DOORS MARKET SIZE, BY DOOR TYPE, 2018-2030 (USD MILLION)
- TABLE 142. UNITED ARAB EMIRATES AUTOMATIC DOORS MARKET SIZE, BY TECHNOLOGY, 2018-2030 (USD MILLION)
- TABLE 143. UNITED ARAB EMIRATES AUTOMATIC DOORS MARKET SIZE, BY END-USER, 2018-2030 (USD MILLION)
- TABLE 144. UNITED KINGDOM AUTOMATIC DOORS MARKET SIZE, BY DOOR TYPE, 2018-2030 (USD MILLION)
- TABLE 145. UNITED KINGDOM AUTOMATIC DOORS MARKET SIZE, BY TECHNOLOGY, 2018-2030 (USD MILLION)
- TABLE 146. UNITED KINGDOM AUTOMATIC DOORS MARKET SIZE, BY END-USER, 2018-2030 (USD MILLION)
- TABLE 147. AUTOMATIC DOORS MARKET, FPNV POSITIONING MATRIX, 2023
- TABLE 148. AUTOMATIC DOORS MARKET SHARE, BY KEY PLAYER, 2023
- TABLE 149. AUTOMATIC DOORS MARKET LICENSE & PRICING
 2024-2032 年按類型(滑動、平開、折疊等)、應用(商業、工業、住宅)和地區自動門市場報告
 自動門市場規模 - 按門類型、功能、最終用途、配銷通路、區域展望與預測,2024 年 - 2032 年
 2024-2028年全球自動門市場
 無線遙控開門器感測器和控制市場報告:至2030年的趨勢、預測和競爭分析
 自動門的全球市場:2018-2029年
 自動門市場(類型:滑動門、平開門、折疊門、旋轉門等;類別:基於感測器、按鈕和訪問控制)-全球行業分析、規模、佔有率、成長、趨勢和預測,2023-2031
 自動門市場:2023-2028年全球行業趨勢、佔有率、規模、成長、機會和預測
 自動門的全球市場