


 |
市場調查報告書
商品編碼
1434816
瀝青市場:依製造方法、應用分類 - 2024-2030 年全球預測Asphalt Market by Manufacturing Method (Cold Mix Asphalt, Hot Mix Asphalt), Application (Coating, Paving Roadways, Water Roofing) - Global Forecast 2024-2030 |
||||||
※ 本網頁內容可能與最新版本有所差異。詳細情況請與我們聯繫。
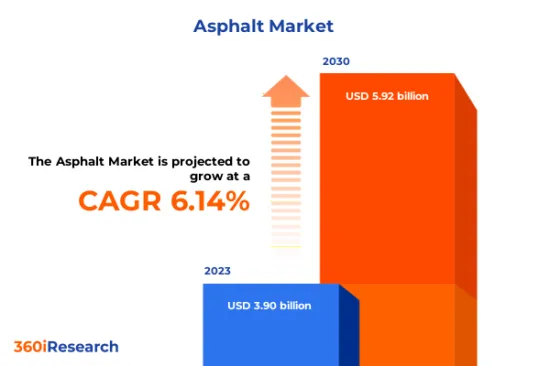
預計2023年瀝青市場規模為39億美元,預計2024年將達41.2億美元,2030年將達59.2億美元,複合年成長率為6.14%。
世界瀝青市場
| 主要市場統計 | |
|---|---|
| 基準年[2023] | 39億美元 |
| 預測年份 [2024] | 41.2億美元 |
| 預測年份 [2030] | 59.2億美元 |
| 複合年成長率(%) | 6.14% |
瀝青,又稱柏油,是一種半固態石油,在道路和人行道等各種基礎設施的建設和維護中發揮重要作用。天然瀝青是由重質原油製成的,經過數百萬年的地質過程,形成富含碳氫化合物的濃稠黑色物質。另一方面,精製瀝青是透過蒸餾過程生產的,該過程在高溫下加熱原油並將汽油和柴油等輕質成分與較重成分分離。全球瀝青市場涵蓋各行業各種瀝青材料的生產、分銷和應用。瀝青主要用於道路建設,如高速公路、橋樑、機場、都市道路等。它也用於其他用途,例如屋頂和防水解決方案、隔熱系統以及運動場等休閒表面。世界各地(主要是新興經濟體)加強交通基礎設施的需求不斷成長,推動了瀝青市場的開拓。快速的都市化、工業化以及住宅和商業領域的建設活動進一步推動了這一需求。基礎設施計劃中的政府投資和私人計劃也為市場擴張提供了有利可圖的機會。然而,原油價格的波動直接影響瀝青材料的生產成本。此外,與瀝青生產過程中溫室氣體(GHG)排放相關的環境問題導致監管審查力度加大,進一步限制了產業成長。此外,與環保替代品和改進的廢棄物方法相關的技術進步預計將減少對環境的影響,同時保持各種最終用途產業所需的高性能標準。
區域洞察
在美洲,美國由於其廣泛的道路網路和定期的維護和維修需求,佔據了瀝青市場的巨大佔有率。此外,包括巴西和墨西哥在內的南美洲新興經濟體正在大力投資交通基礎設施計劃,以支持人口和工業成長。由於永續基礎設施開拓投資的增加,歐洲、中東和非洲地區的瀝青市場成長潛力也很大。特別是在歐洲,我們看到了向環保建築方法的轉變,鼓勵回收和使用再生路面(RAP)和溫拌路面(WMA)。此趨勢符合歐盟注重減少建設活動溫室氣體排放的法規。此外,中東國家正在大力投資大型基礎設施計劃,旨在增強城市內部的連結性並實現經濟多元化。亞太地區正在經歷快速的都市化和工業化,這推動了瀝青市場的繁榮。中國和印度這兩個人口最多的國家正在大力投資高速公路、機場、橋樑和港口等交通基礎設施,以適應不斷成長的人口和工業。此外,印尼和越南等國家也正在經歷顯著的經濟成長,對改善交通網路的需求不斷增加。因此,預計亞太地區未來幾年將成為全球瀝青市場成長率最高的地區。
FPNV定位矩陣
FPNV定位矩陣對於評估瀝青市場至關重要。我們檢視與業務策略和產品滿意度相關的關鍵指標,以對供應商進行全面評估。這種深入的分析使用戶能夠根據自己的要求做出明智的決策。根據評估,供應商被分為四個成功程度不同的像限:前沿(F)、探路者(P)、利基(N)和重要(V)。
市場佔有率分析
市場佔有率分析是一種綜合工具,可以對瀝青市場中供應商的現狀進行深入而詳細的研究。全面比較和分析供應商在整體收益、基本客群和其他關鍵指標方面的貢獻,以便更好地了解公司的績效及其在爭奪市場佔有率時面臨的挑戰。此外,該分析還提供了對該行業競爭特徵的寶貴見解,包括在研究基準年觀察到的累積、分散主導地位和合併特徵等因素。這種詳細程度的提高使供應商能夠做出更明智的決策並制定有效的策略,從而在市場上獲得競爭優勢。
該報告對以下幾個方面提供了寶貴的見解:
1-市場滲透率:提供有關主要企業所服務的市場的全面資訊。
2-市場開拓:我們深入研究利潤豐厚的新興市場,並分析它們在成熟細分市場中的滲透率。
3- 市場多元化:提供有關新產品發布、開拓地區、最新發展和投資的詳細資訊。
4-競爭力評估與資訊:對主要企業的市場佔有率、策略、產品、認證、監管狀況、專利狀況、製造能力等進行全面評估。
5- 產品開發與創新:提供對未來技術、研發活動和突破性產品開發的見解。
本報告解決了以下關鍵問題:
1-瀝青市場的市場規模和預測是多少?
2-瀝青市場預測期內需要考慮投資的產品、細分市場、應用和領域有哪些?
3-瀝青市場的技術趨勢和法律規範是什麼?
4-瀝青市場主要供應商的市場佔有率是多少?
5-進入瀝青市場的合適型態或策略手段是什麼?
目錄
第1章 前言
第2章調查方法
第3章執行摘要
第4章市場概況
第5章市場洞察
- 市場動態
- 促進因素
- 增加建築業和製造業投資
- 專注於運河和水庫襯砌、大壩表面、港口和海洋工程的維護
- 環境考慮和生物瀝青開發
- 抑制因素
- 極端溫度和石油產品價格波動下的瀝青性能限制
- 機會
- 技術進步創造高性能瀝青
- 瀝青生產設施投資擴大
- 任務
- 與瀝青生產和回收相關的環境問題
- 促進因素
- 市場區隔分析
- 製造方法:增加基礎設施開發以及維護計劃中對錶面處理更好選擇的需求。
- 應用程式:重要的應用程式是為滿足您的特定需求和要求而量身定做的。
- 市場趨勢分析
- 高通膨的累積效應
- 波特五力分析
- 價值鍊和關鍵路徑分析
- 法律規範
第6章 依製造方法分類的瀝青市場
- 冷拌瀝青
- 熱拌瀝青
第7章 瀝青市場:依應用分類
- 塗層
- 鋪路
- 防水屋頂
第8章 北美、南美瀝青市場
- 阿根廷
- 巴西
- 加拿大
- 墨西哥
- 美國
第9章亞太地區瀝青市場
- 澳洲
- 中國
- 印度
- 印尼
- 日本
- 馬來西亞
- 菲律賓
- 新加坡
- 韓國
- 台灣
- 泰國
- 越南
第10章歐洲、中東、非洲瀝青市場
- 丹麥
- 埃及
- 芬蘭
- 法國
- 德國
- 以色列
- 義大利
- 荷蘭
- 奈及利亞
- 挪威
- 波蘭
- 卡達
- 俄羅斯
- 沙烏地阿拉伯
- 南非
- 西班牙
- 瑞典
- 瑞士
- 土耳其
- 阿拉伯聯合大公國
- 英國
第11章競爭形勢
- FPNV定位矩陣
- 市場佔有率分析:按主要企業分類
- 主要企業競爭情境分析
- 併購
- 新產品發布和功能增強
第12章競爭產品組合
- 主要公司簡介
- Alltech Group
- Boral Limited
- BP PLC
- Cement Roadstone Holdings PLC
- CEPSA Comercial Petroleo, SA
- Chevron Corporation
- Ergon, Inc.
- Exxon Mobil Corporation
- Grupa LOTOS
- HollyFrontier Corporation
- Indian Oil Corporation Ltd.
- Lukoil
- Marathon Petroleum Corporation
- NuStar Energy LP
- OMV AG
- PT Pertamina International EP
- Puma Energy
- Repsol SA
- Royal Dutch Shell PLC
- Sasol Germany GmbH
- SK Energy Co., Ltd.
- Sonatrach Petroleum Corporation
- Thai Oil Group
- Tipco Asphalt Public Company Limited
- TotalEnergies SE
- Valero Energy Corporation
- Wolf Paving
- 主要產品系列
第13章附錄
- 討論指南
- 關於許可證和定價
[192 Pages Report] The Asphalt Market size was estimated at USD 3.90 billion in 2023 and expected to reach USD 4.12 billion in 2024, at a CAGR 6.14% to reach USD 5.92 billion by 2030.
Global Asphalt Market
| KEY MARKET STATISTICS | |
|---|---|
| Base Year [2023] | USD 3.90 billion |
| Estimated Year [2024] | USD 4.12 billion |
| Forecast Year [2030] | USD 5.92 billion |
| CAGR (%) | 6.14% |
Asphalt, also known as bitumen, is a semi-solid form of petroleum that plays a crucial role in constructing and maintaining various infrastructures, particularly roads and pavements. Natural asphalt occurs when heavy crude oil deposits undergo geological processes over millions of years, forming a thick, black substance rich in hydrocarbons. On the other hand, refined asphalt is produced through the distillation process, where crude oil is heated at high temperatures, separating the lighter components, such as gasoline and diesel, from heavier ones. The global asphalt market encompasses the production, distribution, and application of diverse bituminous materials for various industries. Asphalt is primarily used in road construction, including highways, bridges, airports, and urban roads. Additionally, it serves other purposes, such as roofing and waterproofing solutions, insulation systems, and recreational surfaces, including sports courts. Growth of the asphalt market is primarily driven by increasing demand for enhanced transportation infrastructure worldwide, particularly in developing economies. Rapid urbanization, industrialization, and construction activities in residential and commercial sectors further contribute to this demand. Government investments in infrastructure projects and private-sector initiatives also offer lucrative opportunities for market expansion. However, fluctuations in crude oil prices directly impact the cost of production of asphalt materials. Additionally, environmental concerns related to greenhouse gas (GHG) emissions during asphalt production processes have led to increased regulatory scrutiny that further constraints industry growth. Moreover, technological advancements associated with eco-friendly alternatives or improved waste disposal methods are expected to reduce environmental impacts while maintaining high-performance standards required within various end-use industries.
Regional Insights
In the Americas, the United States accounts for a substantial share of the asphalt market due to its extensive road network and recurrent need for maintenance and repair. Additionally, South America's developing economies, including Brazil and Mexico, have been investing heavily in transportation infrastructure projects to support their growing populations and industries. The EMEA region also holds considerable potential for growth in the asphalt market owing to increased investment in sustainable infrastructure development. In particular, Europe has witnessed a shift toward environmentally friendly construction practices that promote recycling and usage of reclaimed asphalt pavements (RAP) as well as warm-mix asphalt (WMA). This trend aligns with European Union regulations focused on reducing greenhouse gas emissions from construction activities. Furthermore, countries in the Middle East are investing significantly in mega-infrastructure projects aimed at enhancing connectivity within their cities while simultaneously diversifying their economies. The APAC region has been witnessing rapid urbanization and industrialization that have fueled a booming asphalt market. China and India, the two most populous nations, are making heavy investments to develop transportation infrastructure in the country, such as highways, airports, bridges, and ports, to accommodate their expanding populations and industries. In addition, countries such as Indonesia and Vietnam are experiencing substantial economic growth, which has led to increased demand for improved transportation networks. As a result, the APAC region is projected to experience the highest growth rate in the global asphalt market over the next few years.
FPNV Positioning Matrix
The FPNV Positioning Matrix is pivotal in evaluating the Asphalt Market. It offers a comprehensive assessment of vendors, examining key metrics related to Business Strategy and Product Satisfaction. This in-depth analysis empowers users to make well-informed decisions aligned with their requirements. Based on the evaluation, the vendors are then categorized into four distinct quadrants representing varying levels of success: Forefront (F), Pathfinder (P), Niche (N), or Vital (V).
Market Share Analysis
The Market Share Analysis is a comprehensive tool that provides an insightful and in-depth examination of the current state of vendors in the Asphalt Market. By meticulously comparing and analyzing vendor contributions in terms of overall revenue, customer base, and other key metrics, we can offer companies a greater understanding of their performance and the challenges they face when competing for market share. Additionally, this analysis provides valuable insights into the competitive nature of the sector, including factors such as accumulation, fragmentation dominance, and amalgamation traits observed over the base year period studied. With this expanded level of detail, vendors can make more informed decisions and devise effective strategies to gain a competitive edge in the market.
Key Company Profiles
The report delves into recent significant developments in the Asphalt Market, highlighting leading vendors and their innovative profiles. These include Alltech Group, Boral Limited, BP PLC, Cement Roadstone Holdings PLC, CEPSA Comercial Petroleo, S.A., Chevron Corporation, Ergon, Inc., Exxon Mobil Corporation, Grupa LOTOS, HollyFrontier Corporation, Indian Oil Corporation Ltd., Lukoil, Marathon Petroleum Corporation, NuStar Energy L.P., OMV AG, PT Pertamina International EP, Puma Energy, Repsol S.A., Royal Dutch Shell PLC, Sasol Germany GmbH, SK Energy Co., Ltd., Sonatrach Petroleum Corporation, Thai Oil Group, Tipco Asphalt Public Company Limited, TotalEnergies SE, Valero Energy Corporation, and Wolf Paving.
Market Segmentation & Coverage
This research report categorizes the Asphalt Market to forecast the revenues and analyze trends in each of the following sub-markets:
- Manufacturing Method
- Cold Mix Asphalt
- Hot Mix Asphalt
- Application
- Coating
- Paving Roadways
- Water Roofing
- Region
- Americas
- Argentina
- Brazil
- Canada
- Mexico
- United States
- California
- Florida
- Illinois
- New York
- Ohio
- Pennsylvania
- Texas
- Asia-Pacific
- Australia
- China
- India
- Indonesia
- Japan
- Malaysia
- Philippines
- Singapore
- South Korea
- Taiwan
- Thailand
- Vietnam
- Europe, Middle East & Africa
- Denmark
- Egypt
- Finland
- France
- Germany
- Israel
- Italy
- Netherlands
- Nigeria
- Norway
- Poland
- Qatar
- Russia
- Saudi Arabia
- South Africa
- Spain
- Sweden
- Switzerland
- Turkey
- United Arab Emirates
- United Kingdom
- Americas
The report offers valuable insights on the following aspects:
1. Market Penetration: It presents comprehensive information on the market provided by key players.
2. Market Development: It delves deep into lucrative emerging markets and analyzes the penetration across mature market segments.
3. Market Diversification: It provides detailed information on new product launches, untapped geographic regions, recent developments, and investments.
4. Competitive Assessment & Intelligence: It conducts an exhaustive assessment of market shares, strategies, products, certifications, regulatory approvals, patent landscape, and manufacturing capabilities of the leading players.
5. Product Development & Innovation: It offers intelligent insights on future technologies, R&D activities, and breakthrough product developments.
The report addresses key questions such as:
1. What is the market size and forecast of the Asphalt Market?
2. Which products, segments, applications, and areas should one consider investing in over the forecast period in the Asphalt Market?
3. What are the technology trends and regulatory frameworks in the Asphalt Market?
4. What is the market share of the leading vendors in the Asphalt Market?
5. Which modes and strategic moves are suitable for entering the Asphalt Market?
Table of Contents
1. Preface
- 1.1. Objectives of the Study
- 1.2. Market Segmentation & Coverage
- 1.3. Years Considered for the Study
- 1.4. Currency & Pricing
- 1.5. Language
- 1.6. Limitations
- 1.7. Assumptions
- 1.8. Stakeholders
2. Research Methodology
- 2.1. Define: Research Objective
- 2.2. Determine: Research Design
- 2.3. Prepare: Research Instrument
- 2.4. Collect: Data Source
- 2.5. Analyze: Data Interpretation
- 2.6. Formulate: Data Verification
- 2.7. Publish: Research Report
- 2.8. Repeat: Report Update
3. Executive Summary
4. Market Overview
- 4.1. Introduction
- 4.2. Asphalt Market, by Region
5. Market Insights
- 5.1. Market Dynamics
- 5.1.1. Drivers
- 5.1.1.1. Increasing investments in the construction and manufacturing industry
- 5.1.1.2. Emphasis on maintenance of canal and reservoir linings, dam facings, and harbor & sea works
- 5.1.1.3. Environmental consciousness and development of bio-asphalts
- 5.1.2. Restraints
- 5.1.2.1. Performance limitations of asphalts at extreme temperatures and fluctuating prices of petroleum products
- 5.1.3. Opportunities
- 5.1.3.1. Technological advancements to produce high-performing asphalt
- 5.1.3.2. Growing investments in asphalt production facilities
- 5.1.4. Challenges
- 5.1.4.1. Environmental concerns associated with the manufacturing and recycling of asphalt
- 5.1.1. Drivers
- 5.2. Market Segmentation Analysis
- 5.2.1. Manufacturing Method: Growing infrastructural development and need for an excellent choice for surface treatments in maintenance projects.
- 5.2.2. Application: Significant applications are tailored to meet specific needs and requirements
- 5.3. Market Trend Analysis
- 5.4. Cumulative Impact of High Inflation
- 5.5. Porter's Five Forces Analysis
- 5.5.1. Threat of New Entrants
- 5.5.2. Threat of Substitutes
- 5.5.3. Bargaining Power of Customers
- 5.5.4. Bargaining Power of Suppliers
- 5.5.5. Industry Rivalry
- 5.6. Value Chain & Critical Path Analysis
- 5.7. Regulatory Framework
6. Asphalt Market, by Manufacturing Method
- 6.1. Introduction
- 6.2. Cold Mix Asphalt
- 6.3. Hot Mix Asphalt
7. Asphalt Market, by Application
- 7.1. Introduction
- 7.2. Coating
- 7.3. Paving Roadways
- 7.4. Water Roofing
8. Americas Asphalt Market
- 8.1. Introduction
- 8.2. Argentina
- 8.3. Brazil
- 8.4. Canada
- 8.5. Mexico
- 8.6. United States
9. Asia-Pacific Asphalt Market
- 9.1. Introduction
- 9.2. Australia
- 9.3. China
- 9.4. India
- 9.5. Indonesia
- 9.6. Japan
- 9.7. Malaysia
- 9.8. Philippines
- 9.9. Singapore
- 9.10. South Korea
- 9.11. Taiwan
- 9.12. Thailand
- 9.13. Vietnam
10. Europe, Middle East & Africa Asphalt Market
- 10.1. Introduction
- 10.2. Denmark
- 10.3. Egypt
- 10.4. Finland
- 10.5. France
- 10.6. Germany
- 10.7. Israel
- 10.8. Italy
- 10.9. Netherlands
- 10.10. Nigeria
- 10.11. Norway
- 10.12. Poland
- 10.13. Qatar
- 10.14. Russia
- 10.15. Saudi Arabia
- 10.16. South Africa
- 10.17. Spain
- 10.18. Sweden
- 10.19. Switzerland
- 10.20. Turkey
- 10.21. United Arab Emirates
- 10.22. United Kingdom
11. Competitive Landscape
- 11.1. FPNV Positioning Matrix
- 11.2. Market Share Analysis, By Key Player
- 11.3. Competitive Scenario Analysis, By Key Player
- 11.3.1. Merger & Acquisition
- 11.3.1.1. Saint-Gobain Acquires Asphalt Shingle Recycling Technology, Advancing Its Commitment to Waste Reduction
- 11.3.2. New Product Launch & Enhancement
- 11.3.2.1. NAPA and XBE Launch AI Powered Tool For Asphalt Professionals
- 11.3.2.2. CEMEX Launch Rubbermix Asphalt
- 11.3.1. Merger & Acquisition
12. Competitive Portfolio
- 12.1. Key Company Profiles
- 12.1.1. Alltech Group
- 12.1.2. Boral Limited
- 12.1.3. BP PLC
- 12.1.4. Cement Roadstone Holdings PLC
- 12.1.5. CEPSA Comercial Petroleo, S.A.
- 12.1.6. Chevron Corporation
- 12.1.7. Ergon, Inc.
- 12.1.8. Exxon Mobil Corporation
- 12.1.9. Grupa LOTOS
- 12.1.10. HollyFrontier Corporation
- 12.1.11. Indian Oil Corporation Ltd.
- 12.1.12. Lukoil
- 12.1.13. Marathon Petroleum Corporation
- 12.1.14. NuStar Energy L.P.
- 12.1.15. OMV AG
- 12.1.16. PT Pertamina International EP
- 12.1.17. Puma Energy
- 12.1.18. Repsol S.A.
- 12.1.19. Royal Dutch Shell PLC
- 12.1.20. Sasol Germany GmbH
- 12.1.21. SK Energy Co., Ltd.
- 12.1.22. Sonatrach Petroleum Corporation
- 12.1.23. Thai Oil Group
- 12.1.24. Tipco Asphalt Public Company Limited
- 12.1.25. TotalEnergies SE
- 12.1.26. Valero Energy Corporation
- 12.1.27. Wolf Paving
- 12.2. Key Product Portfolio
13. Appendix
- 13.1. Discussion Guide
- 13.2. License & Pricing
LIST OF FIGURES
- FIGURE 1. ASPHALT MARKET RESEARCH PROCESS
- FIGURE 2. ASPHALT MARKET SIZE, 2023 VS 2030
- FIGURE 3. ASPHALT MARKET SIZE, 2018-2030 (USD MILLION)
- FIGURE 4. ASPHALT MARKET SIZE, BY REGION, 2023 VS 2030 (%)
- FIGURE 5. ASPHALT MARKET SIZE, BY REGION, 2023 VS 2024 VS 2030 (USD MILLION)
- FIGURE 6. ASPHALT MARKET DYNAMICS
- FIGURE 7. ASPHALT MARKET SIZE, BY MANUFACTURING METHOD, 2023 VS 2030 (%)
- FIGURE 8. ASPHALT MARKET SIZE, BY MANUFACTURING METHOD, 2023 VS 2024 VS 2030 (USD MILLION)
- FIGURE 9. ASPHALT MARKET SIZE, BY APPLICATION, 2023 VS 2030 (%)
- FIGURE 10. ASPHALT MARKET SIZE, BY APPLICATION, 2023 VS 2024 VS 2030 (USD MILLION)
- FIGURE 11. AMERICAS ASPHALT MARKET SIZE, BY COUNTRY, 2023 VS 2030 (%)
- FIGURE 12. AMERICAS ASPHALT MARKET SIZE, BY COUNTRY, 2023 VS 2024 VS 2030 (USD MILLION)
- FIGURE 13. UNITED STATES ASPHALT MARKET SIZE, BY STATE, 2023 VS 2030 (%)
- FIGURE 14. UNITED STATES ASPHALT MARKET SIZE, BY STATE, 2023 VS 2024 VS 2030 (USD MILLION)
- FIGURE 15. ASIA-PACIFIC ASPHALT MARKET SIZE, BY COUNTRY, 2023 VS 2030 (%)
- FIGURE 16. ASIA-PACIFIC ASPHALT MARKET SIZE, BY COUNTRY, 2023 VS 2024 VS 2030 (USD MILLION)
- FIGURE 17. EUROPE, MIDDLE EAST & AFRICA ASPHALT MARKET SIZE, BY COUNTRY, 2023 VS 2030 (%)
- FIGURE 18. EUROPE, MIDDLE EAST & AFRICA ASPHALT MARKET SIZE, BY COUNTRY, 2023 VS 2024 VS 2030 (USD MILLION)
- FIGURE 19. ASPHALT MARKET, FPNV POSITIONING MATRIX, 2023
- FIGURE 20. ASPHALT MARKET SHARE, BY KEY PLAYER, 2023
LIST OF TABLES
- TABLE 1. ASPHALT MARKET SEGMENTATION & COVERAGE
- TABLE 2. UNITED STATES DOLLAR EXCHANGE RATE, 2018-2023
- TABLE 3. ASPHALT MARKET SIZE, 2018-2030 (USD MILLION)
- TABLE 4. GLOBAL ASPHALT MARKET SIZE, BY REGION, 2018-2030 (USD MILLION)
- TABLE 5. ASPHALT MARKET SIZE, BY MANUFACTURING METHOD, 2018-2030 (USD MILLION)
- TABLE 6. ASPHALT MARKET SIZE, BY COLD MIX ASPHALT, BY REGION, 2018-2030 (USD MILLION)
- TABLE 7. ASPHALT MARKET SIZE, BY HOT MIX ASPHALT, BY REGION, 2018-2030 (USD MILLION)
- TABLE 8. ASPHALT MARKET SIZE, BY APPLICATION, 2018-2030 (USD MILLION)
- TABLE 9. ASPHALT MARKET SIZE, BY COATING, BY REGION, 2018-2030 (USD MILLION)
- TABLE 10. ASPHALT MARKET SIZE, BY PAVING ROADWAYS, BY REGION, 2018-2030 (USD MILLION)
- TABLE 11. ASPHALT MARKET SIZE, BY WATER ROOFING, BY REGION, 2018-2030 (USD MILLION)
- TABLE 12. AMERICAS ASPHALT MARKET SIZE, BY MANUFACTURING METHOD, 2018-2030 (USD MILLION)
- TABLE 13. AMERICAS ASPHALT MARKET SIZE, BY APPLICATION, 2018-2030 (USD MILLION)
- TABLE 14. AMERICAS ASPHALT MARKET SIZE, BY COUNTRY, 2018-2030 (USD MILLION)
- TABLE 15. ARGENTINA ASPHALT MARKET SIZE, BY MANUFACTURING METHOD, 2018-2030 (USD MILLION)
- TABLE 16. ARGENTINA ASPHALT MARKET SIZE, BY APPLICATION, 2018-2030 (USD MILLION)
- TABLE 17. BRAZIL ASPHALT MARKET SIZE, BY MANUFACTURING METHOD, 2018-2030 (USD MILLION)
- TABLE 18. BRAZIL ASPHALT MARKET SIZE, BY APPLICATION, 2018-2030 (USD MILLION)
- TABLE 19. CANADA ASPHALT MARKET SIZE, BY MANUFACTURING METHOD, 2018-2030 (USD MILLION)
- TABLE 20. CANADA ASPHALT MARKET SIZE, BY APPLICATION, 2018-2030 (USD MILLION)
- TABLE 21. MEXICO ASPHALT MARKET SIZE, BY MANUFACTURING METHOD, 2018-2030 (USD MILLION)
- TABLE 22. MEXICO ASPHALT MARKET SIZE, BY APPLICATION, 2018-2030 (USD MILLION)
- TABLE 23. UNITED STATES ASPHALT MARKET SIZE, BY MANUFACTURING METHOD, 2018-2030 (USD MILLION)
- TABLE 24. UNITED STATES ASPHALT MARKET SIZE, BY APPLICATION, 2018-2030 (USD MILLION)
- TABLE 25. UNITED STATES ASPHALT MARKET SIZE, BY STATE, 2018-2030 (USD MILLION)
- TABLE 26. ASIA-PACIFIC ASPHALT MARKET SIZE, BY MANUFACTURING METHOD, 2018-2030 (USD MILLION)
- TABLE 27. ASIA-PACIFIC ASPHALT MARKET SIZE, BY APPLICATION, 2018-2030 (USD MILLION)
- TABLE 28. ASIA-PACIFIC ASPHALT MARKET SIZE, BY COUNTRY, 2018-2030 (USD MILLION)
- TABLE 29. AUSTRALIA ASPHALT MARKET SIZE, BY MANUFACTURING METHOD, 2018-2030 (USD MILLION)
- TABLE 30. AUSTRALIA ASPHALT MARKET SIZE, BY APPLICATION, 2018-2030 (USD MILLION)
- TABLE 31. CHINA ASPHALT MARKET SIZE, BY MANUFACTURING METHOD, 2018-2030 (USD MILLION)
- TABLE 32. CHINA ASPHALT MARKET SIZE, BY APPLICATION, 2018-2030 (USD MILLION)
- TABLE 33. INDIA ASPHALT MARKET SIZE, BY MANUFACTURING METHOD, 2018-2030 (USD MILLION)
- TABLE 34. INDIA ASPHALT MARKET SIZE, BY APPLICATION, 2018-2030 (USD MILLION)
- TABLE 35. INDONESIA ASPHALT MARKET SIZE, BY MANUFACTURING METHOD, 2018-2030 (USD MILLION)
- TABLE 36. INDONESIA ASPHALT MARKET SIZE, BY APPLICATION, 2018-2030 (USD MILLION)
- TABLE 37. JAPAN ASPHALT MARKET SIZE, BY MANUFACTURING METHOD, 2018-2030 (USD MILLION)
- TABLE 38. JAPAN ASPHALT MARKET SIZE, BY APPLICATION, 2018-2030 (USD MILLION)
- TABLE 39. MALAYSIA ASPHALT MARKET SIZE, BY MANUFACTURING METHOD, 2018-2030 (USD MILLION)
- TABLE 40. MALAYSIA ASPHALT MARKET SIZE, BY APPLICATION, 2018-2030 (USD MILLION)
- TABLE 41. PHILIPPINES ASPHALT MARKET SIZE, BY MANUFACTURING METHOD, 2018-2030 (USD MILLION)
- TABLE 42. PHILIPPINES ASPHALT MARKET SIZE, BY APPLICATION, 2018-2030 (USD MILLION)
- TABLE 43. SINGAPORE ASPHALT MARKET SIZE, BY MANUFACTURING METHOD, 2018-2030 (USD MILLION)
- TABLE 44. SINGAPORE ASPHALT MARKET SIZE, BY APPLICATION, 2018-2030 (USD MILLION)
- TABLE 45. SOUTH KOREA ASPHALT MARKET SIZE, BY MANUFACTURING METHOD, 2018-2030 (USD MILLION)
- TABLE 46. SOUTH KOREA ASPHALT MARKET SIZE, BY APPLICATION, 2018-2030 (USD MILLION)
- TABLE 47. TAIWAN ASPHALT MARKET SIZE, BY MANUFACTURING METHOD, 2018-2030 (USD MILLION)
- TABLE 48. TAIWAN ASPHALT MARKET SIZE, BY APPLICATION, 2018-2030 (USD MILLION)
- TABLE 49. THAILAND ASPHALT MARKET SIZE, BY MANUFACTURING METHOD, 2018-2030 (USD MILLION)
- TABLE 50. THAILAND ASPHALT MARKET SIZE, BY APPLICATION, 2018-2030 (USD MILLION)
- TABLE 51. VIETNAM ASPHALT MARKET SIZE, BY MANUFACTURING METHOD, 2018-2030 (USD MILLION)
- TABLE 52. VIETNAM ASPHALT MARKET SIZE, BY APPLICATION, 2018-2030 (USD MILLION)
- TABLE 53. EUROPE, MIDDLE EAST & AFRICA ASPHALT MARKET SIZE, BY MANUFACTURING METHOD, 2018-2030 (USD MILLION)
- TABLE 54. EUROPE, MIDDLE EAST & AFRICA ASPHALT MARKET SIZE, BY APPLICATION, 2018-2030 (USD MILLION)
- TABLE 55. EUROPE, MIDDLE EAST & AFRICA ASPHALT MARKET SIZE, BY COUNTRY, 2018-2030 (USD MILLION)
- TABLE 56. DENMARK ASPHALT MARKET SIZE, BY MANUFACTURING METHOD, 2018-2030 (USD MILLION)
- TABLE 57. DENMARK ASPHALT MARKET SIZE, BY APPLICATION, 2018-2030 (USD MILLION)
- TABLE 58. EGYPT ASPHALT MARKET SIZE, BY MANUFACTURING METHOD, 2018-2030 (USD MILLION)
- TABLE 59. EGYPT ASPHALT MARKET SIZE, BY APPLICATION, 2018-2030 (USD MILLION)
- TABLE 60. FINLAND ASPHALT MARKET SIZE, BY MANUFACTURING METHOD, 2018-2030 (USD MILLION)
- TABLE 61. FINLAND ASPHALT MARKET SIZE, BY APPLICATION, 2018-2030 (USD MILLION)
- TABLE 62. FRANCE ASPHALT MARKET SIZE, BY MANUFACTURING METHOD, 2018-2030 (USD MILLION)
- TABLE 63. FRANCE ASPHALT MARKET SIZE, BY APPLICATION, 2018-2030 (USD MILLION)
- TABLE 64. GERMANY ASPHALT MARKET SIZE, BY MANUFACTURING METHOD, 2018-2030 (USD MILLION)
- TABLE 65. GERMANY ASPHALT MARKET SIZE, BY APPLICATION, 2018-2030 (USD MILLION)
- TABLE 66. ISRAEL ASPHALT MARKET SIZE, BY MANUFACTURING METHOD, 2018-2030 (USD MILLION)
- TABLE 67. ISRAEL ASPHALT MARKET SIZE, BY APPLICATION, 2018-2030 (USD MILLION)
- TABLE 68. ITALY ASPHALT MARKET SIZE, BY MANUFACTURING METHOD, 2018-2030 (USD MILLION)
- TABLE 69. ITALY ASPHALT MARKET SIZE, BY APPLICATION, 2018-2030 (USD MILLION)
- TABLE 70. NETHERLANDS ASPHALT MARKET SIZE, BY MANUFACTURING METHOD, 2018-2030 (USD MILLION)
- TABLE 71. NETHERLANDS ASPHALT MARKET SIZE, BY APPLICATION, 2018-2030 (USD MILLION)
- TABLE 72. NIGERIA ASPHALT MARKET SIZE, BY MANUFACTURING METHOD, 2018-2030 (USD MILLION)
- TABLE 73. NIGERIA ASPHALT MARKET SIZE, BY APPLICATION, 2018-2030 (USD MILLION)
- TABLE 74. NORWAY ASPHALT MARKET SIZE, BY MANUFACTURING METHOD, 2018-2030 (USD MILLION)
- TABLE 75. NORWAY ASPHALT MARKET SIZE, BY APPLICATION, 2018-2030 (USD MILLION)
- TABLE 76. POLAND ASPHALT MARKET SIZE, BY MANUFACTURING METHOD, 2018-2030 (USD MILLION)
- TABLE 77. POLAND ASPHALT MARKET SIZE, BY APPLICATION, 2018-2030 (USD MILLION)
- TABLE 78. QATAR ASPHALT MARKET SIZE, BY MANUFACTURING METHOD, 2018-2030 (USD MILLION)
- TABLE 79. QATAR ASPHALT MARKET SIZE, BY APPLICATION, 2018-2030 (USD MILLION)
- TABLE 80. RUSSIA ASPHALT MARKET SIZE, BY MANUFACTURING METHOD, 2018-2030 (USD MILLION)
- TABLE 81. RUSSIA ASPHALT MARKET SIZE, BY APPLICATION, 2018-2030 (USD MILLION)
- TABLE 82. SAUDI ARABIA ASPHALT MARKET SIZE, BY MANUFACTURING METHOD, 2018-2030 (USD MILLION)
- TABLE 83. SAUDI ARABIA ASPHALT MARKET SIZE, BY APPLICATION, 2018-2030 (USD MILLION)
- TABLE 84. SOUTH AFRICA ASPHALT MARKET SIZE, BY MANUFACTURING METHOD, 2018-2030 (USD MILLION)
- TABLE 85. SOUTH AFRICA ASPHALT MARKET SIZE, BY APPLICATION, 2018-2030 (USD MILLION)
- TABLE 86. SPAIN ASPHALT MARKET SIZE, BY MANUFACTURING METHOD, 2018-2030 (USD MILLION)
- TABLE 87. SPAIN ASPHALT MARKET SIZE, BY APPLICATION, 2018-2030 (USD MILLION)
- TABLE 88. SWEDEN ASPHALT MARKET SIZE, BY MANUFACTURING METHOD, 2018-2030 (USD MILLION)
- TABLE 89. SWEDEN ASPHALT MARKET SIZE, BY APPLICATION, 2018-2030 (USD MILLION)
- TABLE 90. SWITZERLAND ASPHALT MARKET SIZE, BY MANUFACTURING METHOD, 2018-2030 (USD MILLION)
- TABLE 91. SWITZERLAND ASPHALT MARKET SIZE, BY APPLICATION, 2018-2030 (USD MILLION)
- TABLE 92. TURKEY ASPHALT MARKET SIZE, BY MANUFACTURING METHOD, 2018-2030 (USD MILLION)
- TABLE 93. TURKEY ASPHALT MARKET SIZE, BY APPLICATION, 2018-2030 (USD MILLION)
- TABLE 94. UNITED ARAB EMIRATES ASPHALT MARKET SIZE, BY MANUFACTURING METHOD, 2018-2030 (USD MILLION)
- TABLE 95. UNITED ARAB EMIRATES ASPHALT MARKET SIZE, BY APPLICATION, 2018-2030 (USD MILLION)
- TABLE 96. UNITED KINGDOM ASPHALT MARKET SIZE, BY MANUFACTURING METHOD, 2018-2030 (USD MILLION)
- TABLE 97. UNITED KINGDOM ASPHALT MARKET SIZE, BY APPLICATION, 2018-2030 (USD MILLION)
- TABLE 98. ASPHALT MARKET, FPNV POSITIONING MATRIX, 2023
- TABLE 99. ASPHALT MARKET SHARE, BY KEY PLAYER, 2023
- TABLE 100. ASPHALT MARKET LICENSE & PRICING
 2024-2032 年按產品、瀝青類型、應用、最終用途部門和地區分類的瀝青市場報告
 瀝青瓦全球市場規模、佔有率、成長分析、按產品類型、分銷管道、按應用分類 - 2023-2030 年行業預測
 瀝青改質劑 - 市場佔有率分析、產業趨勢與統計、成長預測(2024 - 2029 年)
 瀝青添加劑市場報告:2030 年趨勢、預測與競爭分析
 2024 年瀝青瓦世界市場報告
 瀝青改質劑市場:按類型、來源、技術、銷售管道、最終用戶分類 - 全球預測 2024-2030
 瀝青添加劑市場:按類型、技術和應用分類 - 2024-2030 年全球預測
 全球瀝青瓦市場評估:按材料類型、按產品類型、按建築類型、按應用、按地區、機會、預測(2016-2030)
 瀝青添加劑全球市場報告 2024年
 2024 年瀝青、潤滑油和潤滑脂全球市場報告