


 |
市場調查報告書
商品編碼
1434764
人工光合作用市場:按技術、按應用分類 - 2024-2030 年全球預測Artificial Photosynthesis Market by Technology (Co-Electrolysis, Hybrid Process, Nanotechnology), Application (Dry Agriculture, Hydrocarbons, Hydrogen) - Global Forecast 2024-2030 |
||||||
※ 本網頁內容可能與最新版本有所差異。詳細情況請與我們聯繫。
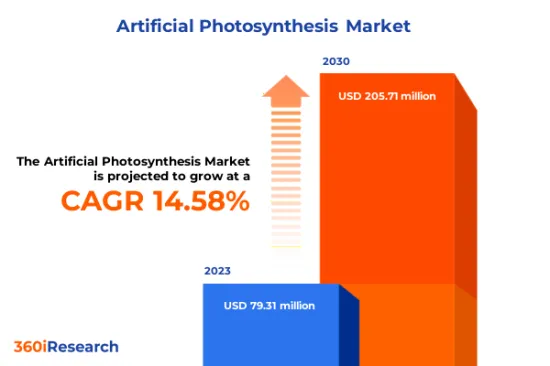
預計2023年人工光合作用市場規模為7,931萬美元,預估2024年將達9,028萬美元,2030年將達2,0,571萬美元,複合年成長率為14.58%。
人工光合作用的世界市場
| 主要市場統計 | |
|---|---|
| 基準年[2023] | 7931萬美元 |
| 預測年份 [2024] | 9028萬美元 |
| 預測年份 [2030] | 20571萬美元 |
| 複合年成長率(%) | 14.58% |
人工光合作用是指複製自然光合作用現象的過程,其中植物、藻類和一些細菌將陽光、水和大氣二氧化碳轉化為葡萄糖和氧氣形式的能量。人工光合作用的主要訊息是產生永續環保的能源來源來取代石化燃料。這種創新方法因其在解決當前能源挑戰(如氣候變遷、能源安全和不可可再生資源枯竭)方面的潛在應用而吸引了全世界的廣泛關注。人工光合作用能夠生產太陽能燃料,從而在發電的同時減少溫室氣體排放,從而提供了一個有前途的解決方案。奈米技術的研究和發展使得創造高效的光催化劑成為可能,加速人工光合作用過程所需的化學反應。然而,人工光合作用商業化的限制與可擴展性有關,迄今為止,大多數成功的人工光合作用系統仍處於實驗室的小規模。市場相關人員正在努力將這些技術擴展到更大規模的工業應用,同時保持高效率水準。
此外,現有系統通常依賴鉑金和其他稀有金屬等昂貴的材料,這對於大規模部署來說在經濟上可能不可行。研究人員正在開發在分子層面上模仿天然植物結構的新材料,這可能會導致更有效率、更具成本效益的太陽能電池。此外,透過與風能和水力發電等其他可再生能源技術的整合,可以進一步最佳化人工光合作用的潛力。機器學習(ML)和人工智慧(AI)技術的採用為加速該領域新型材料的發現和最佳化過程提供了機會。
區域洞察
美洲擁有一些著名的研究機構,專注於建立高效的太陽能到燃料轉換系統,並且正在進行人工光合作用的重大研究。美國和加拿大的私人和政府機構正在開發模仿自然光合作用過程的創新技術。人工光合作用聯合中心 (JCAP) 和太陽能燃料研究所 (SOFI) 等舉措正在建立具有成本效益和高效的人工光合作用技術的研發方案。包括中國、日本和韓國在內的亞洲國家透過開發新型光催化劑和光電極材料以提高光吸收效率,在推動AP研究方面發揮重要作用。該地區得到了資金充足的地區研究機構的支持,這些機構旨在投資實施可為多個最終用戶服務的大型研究計劃。幾個亞洲國家的目標是到 2040 年將該技術商業化,化學品製造商將採用該技術。歐洲國家透過「地平線2020」框架計畫資助的各種研究計劃,高度關注人工光合作用。 A-LEAF計劃旨在開發用於太陽能水分解和二氧化碳減排的光電化學裝置,而 Sun-To-Liquid舉措則旨在利用集中陽光可再生運輸燃料。幾家歐洲公司正在利用改良的藍菌開發氣體液化技術和可再生化學品生產的 AP。
FPNV定位矩陣
FPNV定位矩陣對於評估人工光合作用市場至關重要。我們檢視與業務策略和產品滿意度相關的關鍵指標,以對供應商進行全面評估。這種深入的分析使用戶能夠根據自己的要求做出明智的決策。根據評估,供應商被分為四個成功程度不同的像限:前沿(F)、探路者(P)、利基(N)和重要(V)。
市場佔有率分析
市場佔有率分析是一種綜合工具,可以對人工光合作用市場中供應商的現狀進行深入而詳細的研究。全面比較和分析供應商在整體收益、基本客群和其他關鍵指標方面的貢獻,以便更好地了解公司的績效及其在爭奪市場佔有率時面臨的挑戰。此外,該分析還提供了對該行業競爭特徵的寶貴見解,包括在研究基準年觀察到的累積、分散主導地位和合併特徵等因素。這種詳細程度的提高使供應商能夠做出更明智的決策並制定有效的策略,從而在市場上獲得競爭優勢。
該報告對以下幾個方面提供了寶貴的見解:
1-市場滲透率:提供有關主要企業所服務的市場的全面資訊。
2-市場開拓:我們深入研究利潤豐厚的新興市場,並分析它們在成熟細分市場中的滲透率。
3- 市場多元化:提供有關新產品發布、開拓地區、最新發展和投資的詳細資訊。
4-競爭力評估與資訊:對主要企業的市場佔有率、策略、產品、認證、監管狀況、專利狀況、製造能力等進行全面評估。
5- 產品開發與創新:提供對未來技術、研發活動和突破性產品開發的見解。
本報告解決了以下關鍵問題:
1-人工光合作用市場的市場規模與預測是多少?
2-在人工光合作用市場的預測期間內,有哪些產品、細分市場、應用和領域需要考慮投資?
3-人工光合作用市場的技術趨勢和法律規範是什麼?
4-人工光合作用市場主要供應商的市場佔有率是多少?
5-進入人工光合作用市場的合適型態和策略手段是什麼?
目錄
第1章 前言
第2章調查方法
第3章執行摘要
第4章市場概況
第5章市場洞察
- 市場動態
- 促進因素
- 持續投資清潔能源產出,滿足不斷電系統需求
- 政府推出優惠政策和措施支持清潔能源產出
- 透過高效、經濟的人工光合作用進行太陽能轉換和儲存
- 抑制因素
- 對高初始成本的擔憂
- 機會
- 技術進步與市場相關人員的日益融合
- 擴大綠色H2的採用並引入環保液體燃料
- 任務
- 對最佳化催化劑和光陽極陽極材料穩定性缺乏認知和基礎設施不足
- 促進因素
- 市場區隔分析
- 技術:研究開發奈米技術,提高人工光合作用的功能
- 應用:擴大人工光合作用在碳氫化合物和氫氣生產的潛力
- 市場趨勢分析
- 高通膨的累積效應
- 波特五力分析
- 價值鍊和關鍵路徑分析
- 法律規範
第6章人工光合作用市場:依技術分類
- 共電解
- 混合工藝
- 奈米科技
- 催化作用
第7章人工光合作用市場:依應用分類
- 旱季農業
- 烴
- 氫
第8章美洲人工光合作用市場
- 阿根廷
- 巴西
- 加拿大
- 墨西哥
- 美國
第9章亞太地區人工光合作用市場
- 澳洲
- 中國
- 印度
- 印尼
- 日本
- 馬來西亞
- 菲律賓
- 新加坡
- 韓國
- 台灣
- 泰國
- 越南
第10章歐洲、中東和非洲人工光合作用市場
- 丹麥
- 埃及
- 芬蘭
- 法國
- 德國
- 以色列
- 義大利
- 荷蘭
- 奈及利亞
- 挪威
- 波蘭
- 卡達
- 俄羅斯
- 沙烏地阿拉伯
- 南非
- 西班牙
- 瑞典
- 瑞士
- 土耳其
- 阿拉伯聯合大公國
- 英國
第11章競爭形勢
- FPNV定位矩陣
- 市場佔有率分析:主要企業
- 主要企業競爭情境分析
- 新產品發布和功能增強
第12章競爭產品組合
- 主要公司簡介
- Air Company
- Cemvita Factory, Inc.
- Climeworks AG
- Elcogen AS
- Engie SA
- ENSEK Ltd
- Evonik Industries AG
- Fujitsu Limited by Furukawa Group
- H2U Technologies, Inc.
- Horiba, Ltd.
- HySolChem
- Idemitsu Kosan Co., Ltd.
- JX Metals Corporation
- Mitsubishi Chemical Group Corporation
- Mitsui Chemicals, Inc.
- Nanjing Tengyu ElectroChemical Technology Co., Ltd.
- Nippon Steel Corporation
- Nydalen Group AS
- Panasonic Holdings Corporation
- PorphyChem SAS
- Provectus Algae Pty Ltd.
- Shimadzu Corporation
- Siemens AG
- SunHydrogen, Inc.
- Synhelion SA
- ThinkRaw
- Toshiba Corporation
- Toyo Engineering Corporation
- Toyota CRDL Inc.
- Twelve Benefit Corporation
- 主要產品系列
第13章附錄
- 討論指南
- 關於許可證和定價
[199 Pages Report] The Artificial Photosynthesis Market size was estimated at USD 79.31 million in 2023 and expected to reach USD 90.28 million in 2024, at a CAGR 14.58% to reach USD 205.71 million by 2030.
Global Artificial Photosynthesis Market
| KEY MARKET STATISTICS | |
|---|---|
| Base Year [2023] | USD 79.31 million |
| Estimated Year [2024] | USD 90.28 million |
| Forecast Year [2030] | USD 205.71 million |
| CAGR (%) | 14.58% |
Artificial photosynthesis refers to the process of replicating the natural phenomenon of photosynthesis, the method by which plants, algae, and some bacteria convert sunlight, water, and carbon dioxide from the atmosphere into energy in the form of glucose and oxygen. The primary aim of artificial photosynthesis is to generate sustainable and environmentally friendly sources of energy that can be utilized as an alternative to fossil fuels. This innovative approach has garnered significant attention worldwide due to its potential applications in resolving current energy challenges such as climate change, energy security concerns, and depletion of non-renewable resources. Artificial photosynthesis offers a promising solution through its ability to produce solar fuels that can mitigate greenhouse gas emissions while generating electricity. Developments in nanotechnology have enabled researchers to create efficient photocatalysts that can facilitate chemical reactions necessary for artificial photosynthesis processes. However, a limitation associated with artificial photosynthesis commercialization is related to scalability, as most successful artificial photosynthesis systems demonstrated so far have only been feasible at small scales in laboratory settings. Market players are working on scaling up these technologies for larger industrial applications while maintaining high efficiency levels.
Additionally, existing systems often rely on expensive materials such as platinum or other rare metals, which may not be economically viable for large-scale deployment. Researchers are developing new materials that mimic natural plant structures at the molecular level, potentially leading to more efficient and cost-effective photovoltaic cells. Additionally, integration with other renewable energy technologies, such as wind and hydroelectric power, can further optimize the potential of artificial photosynthesis. The adoption of machine learning (ML) and artificial intelligence(AI) techniques offers opportunities for accelerating the discovery of novel materials and optimization processes in this field.
Regional Insights
The Americas conducts significant research on artificial photosynthesis with several prominent institutions focusing on creating efficient systems for solar-to-fuel conversion. Private and government institutions across the U.S. and Canada are developing innovative technologies that mimic natural photosynthesis processes. Initiatives such as the Joint Center for Artificial Photosynthesis (JCAP) and the Solar Fuels Institute (SOFI) have established a well-described research and development scenario surrounding cost-effective, efficient artificial photosynthesis technologies. Asian countries, including China, Japan, and South Korea, play vital roles in advancing AP research by developing novel photocatalysts and photoelectrode materials for enhancing light-absorption efficiencies. The region is supported by several well-funded regional research institutions that aim to invest in introducing large-scale artificial photosynthesis projects that can cater to multiple end-users. Several Asian countries aim to commercialize the technology by 2040 by having it adopted by chemical makers. The European countries strongly focus on artificial photosynthesis through various research projects funded under the Horizon 2020 Framework Programme. The A-LEAF project aims to develop photoelectrochemical devices for solar-driven water splitting and CO2 reduction, while the Sun-To-Liquid initiative focuses on producing renewable transportation fuels from concentrated sunlight. Several European companies are progressing in AP development with gas-to-liquid technology and renewable chemicals production using modified cyanobacteria.
FPNV Positioning Matrix
The FPNV Positioning Matrix is pivotal in evaluating the Artificial Photosynthesis Market. It offers a comprehensive assessment of vendors, examining key metrics related to Business Strategy and Product Satisfaction. This in-depth analysis empowers users to make well-informed decisions aligned with their requirements. Based on the evaluation, the vendors are then categorized into four distinct quadrants representing varying levels of success: Forefront (F), Pathfinder (P), Niche (N), or Vital (V).
Market Share Analysis
The Market Share Analysis is a comprehensive tool that provides an insightful and in-depth examination of the current state of vendors in the Artificial Photosynthesis Market. By meticulously comparing and analyzing vendor contributions in terms of overall revenue, customer base, and other key metrics, we can offer companies a greater understanding of their performance and the challenges they face when competing for market share. Additionally, this analysis provides valuable insights into the competitive nature of the sector, including factors such as accumulation, fragmentation dominance, and amalgamation traits observed over the base year period studied. With this expanded level of detail, vendors can make more informed decisions and devise effective strategies to gain a competitive edge in the market.
Key Company Profiles
The report delves into recent significant developments in the Artificial Photosynthesis Market, highlighting leading vendors and their innovative profiles. These include Air Company, Cemvita Factory, Inc., Climeworks AG, Elcogen AS, Engie SA, ENSEK Ltd, Evonik Industries AG, Fujitsu Limited by Furukawa Group, H2U Technologies, Inc., Horiba, Ltd., HySolChem, Idemitsu Kosan Co., Ltd., JX Metals Corporation, Mitsubishi Chemical Group Corporation, Mitsui Chemicals, Inc., Nanjing Tengyu ElectroChemical Technology Co., Ltd., Nippon Steel Corporation, Nydalen Group AS, Panasonic Holdings Corporation, PorphyChem SAS, Provectus Algae Pty Ltd., Shimadzu Corporation, Siemens AG, SunHydrogen, Inc., Synhelion SA, ThinkRaw, Toshiba Corporation, Toyo Engineering Corporation, Toyota CRDL Inc., and Twelve Benefit Corporation.
Market Segmentation & Coverage
This research report categorizes the Artificial Photosynthesis Market to forecast the revenues and analyze trends in each of the following sub-markets:
- Technology
- Co-Electrolysis
- Hybrid Process
- Nanotechnology
- Photo-Electro Catalysis
- Application
- Dry Agriculture
- Hydrocarbons
- Hydrogen
- Region
- Americas
- Argentina
- Brazil
- Canada
- Mexico
- United States
- California
- Florida
- Illinois
- New York
- Ohio
- Pennsylvania
- Texas
- Asia-Pacific
- Australia
- China
- India
- Indonesia
- Japan
- Malaysia
- Philippines
- Singapore
- South Korea
- Taiwan
- Thailand
- Vietnam
- Europe, Middle East & Africa
- Denmark
- Egypt
- Finland
- France
- Germany
- Israel
- Italy
- Netherlands
- Nigeria
- Norway
- Poland
- Qatar
- Russia
- Saudi Arabia
- South Africa
- Spain
- Sweden
- Switzerland
- Turkey
- United Arab Emirates
- United Kingdom
- Americas
The report offers valuable insights on the following aspects:
1. Market Penetration: It presents comprehensive information on the market provided by key players.
2. Market Development: It delves deep into lucrative emerging markets and analyzes the penetration across mature market segments.
3. Market Diversification: It provides detailed information on new product launches, untapped geographic regions, recent developments, and investments.
4. Competitive Assessment & Intelligence: It conducts an exhaustive assessment of market shares, strategies, products, certifications, regulatory approvals, patent landscape, and manufacturing capabilities of the leading players.
5. Product Development & Innovation: It offers intelligent insights on future technologies, R&D activities, and breakthrough product developments.
The report addresses key questions such as:
1. What is the market size and forecast of the Artificial Photosynthesis Market?
2. Which products, segments, applications, and areas should one consider investing in over the forecast period in the Artificial Photosynthesis Market?
3. What are the technology trends and regulatory frameworks in the Artificial Photosynthesis Market?
4. What is the market share of the leading vendors in the Artificial Photosynthesis Market?
5. Which modes and strategic moves are suitable for entering the Artificial Photosynthesis Market?
Table of Contents
1. Preface
- 1.1. Objectives of the Study
- 1.2. Market Segmentation & Coverage
- 1.3. Years Considered for the Study
- 1.4. Currency & Pricing
- 1.5. Language
- 1.6. Limitations
- 1.7. Assumptions
- 1.8. Stakeholders
2. Research Methodology
- 2.1. Define: Research Objective
- 2.2. Determine: Research Design
- 2.3. Prepare: Research Instrument
- 2.4. Collect: Data Source
- 2.5. Analyze: Data Interpretation
- 2.6. Formulate: Data Verification
- 2.7. Publish: Research Report
- 2.8. Repeat: Report Update
3. Executive Summary
4. Market Overview
- 4.1. Introduction
- 4.2. Artificial Photosynthesis Market, by Region
5. Market Insights
- 5.1. Market Dynamics
- 5.1.1. Drivers
- 5.1.1.1. Ongoing investments in clean energy generation for fulfilling the need for an uninterrupted power supply
- 5.1.1.2. Government increasing favorable policies and initiatives for supporting clean energy generation
- 5.1.1.3. Conversion and storage of solar energy through artificial photosynthesis making it efficient and economic
- 5.1.2. Restraints
- 5.1.2.1. Concerns regarding high initial costs
- 5.1.3. Opportunities
- 5.1.3.1. Technological advancements and rising amalgamation among the market players
- 5.1.3.2. Growing adoption for green H2 and the introduction of eco-friendly liquid fuels
- 5.1.4. Challenges
- 5.1.4.1. Lack of awareness and insufficient infrastructure for optimized catalyst and stability of photoanode material
- 5.1.1. Drivers
- 5.2. Market Segmentation Analysis
- 5.2.1. Technology: Research & Development in nanotechnology to advance the capabilities of artificial photosynthesis
- 5.2.2. Application: Expansive potential of artificial photosynthesis in hydrocarbon and hydrogen generation
- 5.3. Market Trend Analysis
- 5.4. Cumulative Impact of High Inflation
- 5.5. Porter's Five Forces Analysis
- 5.5.1. Threat of New Entrants
- 5.5.2. Threat of Substitutes
- 5.5.3. Bargaining Power of Customers
- 5.5.4. Bargaining Power of Suppliers
- 5.5.5. Industry Rivalry
- 5.6. Value Chain & Critical Path Analysis
- 5.7. Regulatory Framework
6. Artificial Photosynthesis Market, by Technology
- 6.1. Introduction
- 6.2. Co-Electrolysis
- 6.3. Hybrid Process
- 6.4. Nanotechnology
- 6.5. Photo-Electro Catalysis
7. Artificial Photosynthesis Market, by Application
- 7.1. Introduction
- 7.2. Dry Agriculture
- 7.3. Hydrocarbons
- 7.4. Hydrogen
8. Americas Artificial Photosynthesis Market
- 8.1. Introduction
- 8.2. Argentina
- 8.3. Brazil
- 8.4. Canada
- 8.5. Mexico
- 8.6. United States
9. Asia-Pacific Artificial Photosynthesis Market
- 9.1. Introduction
- 9.2. Australia
- 9.3. China
- 9.4. India
- 9.5. Indonesia
- 9.6. Japan
- 9.7. Malaysia
- 9.8. Philippines
- 9.9. Singapore
- 9.10. South Korea
- 9.11. Taiwan
- 9.12. Thailand
- 9.13. Vietnam
10. Europe, Middle East & Africa Artificial Photosynthesis Market
- 10.1. Introduction
- 10.2. Denmark
- 10.3. Egypt
- 10.4. Finland
- 10.5. France
- 10.6. Germany
- 10.7. Israel
- 10.8. Italy
- 10.9. Netherlands
- 10.10. Nigeria
- 10.11. Norway
- 10.12. Poland
- 10.13. Qatar
- 10.14. Russia
- 10.15. Saudi Arabia
- 10.16. South Africa
- 10.17. Spain
- 10.18. Sweden
- 10.19. Switzerland
- 10.20. Turkey
- 10.21. United Arab Emirates
- 10.22. United Kingdom
11. Competitive Landscape
- 11.1. FPNV Positioning Matrix
- 11.2. Market Share Analysis, By Key Player
- 11.3. Competitive Scenario Analysis, By Key Player
- 11.3.1. New Product Launch & Enhancement
- 11.3.1.1. IISER, IIT Researchers Develop New Artificial Photosynthetic System To Capture Solar Energy
- 11.3.1.2. New 'Artificial' Photosynthesis Is 10x More Efficient than Previous Attempts
- 11.3.1. New Product Launch & Enhancement
12. Competitive Portfolio
- 12.1. Key Company Profiles
- 12.1.1. Air Company
- 12.1.2. Cemvita Factory, Inc.
- 12.1.3. Climeworks AG
- 12.1.4. Elcogen AS
- 12.1.5. Engie SA
- 12.1.6. ENSEK Ltd
- 12.1.7. Evonik Industries AG
- 12.1.8. Fujitsu Limited by Furukawa Group
- 12.1.9. H2U Technologies, Inc.
- 12.1.10. Horiba, Ltd.
- 12.1.11. HySolChem
- 12.1.12. Idemitsu Kosan Co., Ltd.
- 12.1.13. JX Metals Corporation
- 12.1.14. Mitsubishi Chemical Group Corporation
- 12.1.15. Mitsui Chemicals, Inc.
- 12.1.16. Nanjing Tengyu ElectroChemical Technology Co., Ltd.
- 12.1.17. Nippon Steel Corporation
- 12.1.18. Nydalen Group AS
- 12.1.19. Panasonic Holdings Corporation
- 12.1.20. PorphyChem SAS
- 12.1.21. Provectus Algae Pty Ltd.
- 12.1.22. Shimadzu Corporation
- 12.1.23. Siemens AG
- 12.1.24. SunHydrogen, Inc.
- 12.1.25. Synhelion SA
- 12.1.26. ThinkRaw
- 12.1.27. Toshiba Corporation
- 12.1.28. Toyo Engineering Corporation
- 12.1.29. Toyota CRDL Inc.
- 12.1.30. Twelve Benefit Corporation
- 12.2. Key Product Portfolio
13. Appendix
- 13.1. Discussion Guide
- 13.2. License & Pricing
LIST OF FIGURES
- FIGURE 1. ARTIFICIAL PHOTOSYNTHESIS MARKET RESEARCH PROCESS
- FIGURE 2. ARTIFICIAL PHOTOSYNTHESIS MARKET SIZE, 2023 VS 2030
- FIGURE 3. ARTIFICIAL PHOTOSYNTHESIS MARKET SIZE, 2018-2030 (USD MILLION)
- FIGURE 4. ARTIFICIAL PHOTOSYNTHESIS MARKET SIZE, BY REGION, 2023 VS 2030 (%)
- FIGURE 5. ARTIFICIAL PHOTOSYNTHESIS MARKET SIZE, BY REGION, 2023 VS 2024 VS 2030 (USD MILLION)
- FIGURE 6. ARTIFICIAL PHOTOSYNTHESIS MARKET DYNAMICS
- FIGURE 7. ARTIFICIAL PHOTOSYNTHESIS MARKET SIZE, BY TECHNOLOGY, 2023 VS 2030 (%)
- FIGURE 8. ARTIFICIAL PHOTOSYNTHESIS MARKET SIZE, BY TECHNOLOGY, 2023 VS 2024 VS 2030 (USD MILLION)
- FIGURE 9. ARTIFICIAL PHOTOSYNTHESIS MARKET SIZE, BY APPLICATION, 2023 VS 2030 (%)
- FIGURE 10. ARTIFICIAL PHOTOSYNTHESIS MARKET SIZE, BY APPLICATION, 2023 VS 2024 VS 2030 (USD MILLION)
- FIGURE 11. AMERICAS ARTIFICIAL PHOTOSYNTHESIS MARKET SIZE, BY COUNTRY, 2023 VS 2030 (%)
- FIGURE 12. AMERICAS ARTIFICIAL PHOTOSYNTHESIS MARKET SIZE, BY COUNTRY, 2023 VS 2024 VS 2030 (USD MILLION)
- FIGURE 13. UNITED STATES ARTIFICIAL PHOTOSYNTHESIS MARKET SIZE, BY STATE, 2023 VS 2030 (%)
- FIGURE 14. UNITED STATES ARTIFICIAL PHOTOSYNTHESIS MARKET SIZE, BY STATE, 2023 VS 2024 VS 2030 (USD MILLION)
- FIGURE 15. ASIA-PACIFIC ARTIFICIAL PHOTOSYNTHESIS MARKET SIZE, BY COUNTRY, 2023 VS 2030 (%)
- FIGURE 16. ASIA-PACIFIC ARTIFICIAL PHOTOSYNTHESIS MARKET SIZE, BY COUNTRY, 2023 VS 2024 VS 2030 (USD MILLION)
- FIGURE 17. EUROPE, MIDDLE EAST & AFRICA ARTIFICIAL PHOTOSYNTHESIS MARKET SIZE, BY COUNTRY, 2023 VS 2030 (%)
- FIGURE 18. EUROPE, MIDDLE EAST & AFRICA ARTIFICIAL PHOTOSYNTHESIS MARKET SIZE, BY COUNTRY, 2023 VS 2024 VS 2030 (USD MILLION)
- FIGURE 19. ARTIFICIAL PHOTOSYNTHESIS MARKET, FPNV POSITIONING MATRIX, 2023
- FIGURE 20. ARTIFICIAL PHOTOSYNTHESIS MARKET SHARE, BY KEY PLAYER, 2023
LIST OF TABLES
- TABLE 1. ARTIFICIAL PHOTOSYNTHESIS MARKET SEGMENTATION & COVERAGE
- TABLE 2. UNITED STATES DOLLAR EXCHANGE RATE, 2018-2023
- TABLE 3. ARTIFICIAL PHOTOSYNTHESIS MARKET SIZE, 2018-2030 (USD MILLION)
- TABLE 4. GLOBAL ARTIFICIAL PHOTOSYNTHESIS MARKET SIZE, BY REGION, 2018-2030 (USD MILLION)
- TABLE 5. ARTIFICIAL PHOTOSYNTHESIS MARKET SIZE, BY TECHNOLOGY, 2018-2030 (USD MILLION)
- TABLE 6. ARTIFICIAL PHOTOSYNTHESIS MARKET SIZE, BY CO-ELECTROLYSIS, BY REGION, 2018-2030 (USD MILLION)
- TABLE 7. ARTIFICIAL PHOTOSYNTHESIS MARKET SIZE, BY HYBRID PROCESS, BY REGION, 2018-2030 (USD MILLION)
- TABLE 8. ARTIFICIAL PHOTOSYNTHESIS MARKET SIZE, BY NANOTECHNOLOGY, BY REGION, 2018-2030 (USD MILLION)
- TABLE 9. ARTIFICIAL PHOTOSYNTHESIS MARKET SIZE, BY PHOTO-ELECTRO CATALYSIS, BY REGION, 2018-2030 (USD MILLION)
- TABLE 10. ARTIFICIAL PHOTOSYNTHESIS MARKET SIZE, BY APPLICATION, 2018-2030 (USD MILLION)
- TABLE 11. ARTIFICIAL PHOTOSYNTHESIS MARKET SIZE, BY DRY AGRICULTURE, BY REGION, 2018-2030 (USD MILLION)
- TABLE 12. ARTIFICIAL PHOTOSYNTHESIS MARKET SIZE, BY HYDROCARBONS, BY REGION, 2018-2030 (USD MILLION)
- TABLE 13. ARTIFICIAL PHOTOSYNTHESIS MARKET SIZE, BY HYDROGEN, BY REGION, 2018-2030 (USD MILLION)
- TABLE 14. AMERICAS ARTIFICIAL PHOTOSYNTHESIS MARKET SIZE, BY TECHNOLOGY, 2018-2030 (USD MILLION)
- TABLE 15. AMERICAS ARTIFICIAL PHOTOSYNTHESIS MARKET SIZE, BY APPLICATION, 2018-2030 (USD MILLION)
- TABLE 16. AMERICAS ARTIFICIAL PHOTOSYNTHESIS MARKET SIZE, BY COUNTRY, 2018-2030 (USD MILLION)
- TABLE 17. ARGENTINA ARTIFICIAL PHOTOSYNTHESIS MARKET SIZE, BY TECHNOLOGY, 2018-2030 (USD MILLION)
- TABLE 18. ARGENTINA ARTIFICIAL PHOTOSYNTHESIS MARKET SIZE, BY APPLICATION, 2018-2030 (USD MILLION)
- TABLE 19. BRAZIL ARTIFICIAL PHOTOSYNTHESIS MARKET SIZE, BY TECHNOLOGY, 2018-2030 (USD MILLION)
- TABLE 20. BRAZIL ARTIFICIAL PHOTOSYNTHESIS MARKET SIZE, BY APPLICATION, 2018-2030 (USD MILLION)
- TABLE 21. CANADA ARTIFICIAL PHOTOSYNTHESIS MARKET SIZE, BY TECHNOLOGY, 2018-2030 (USD MILLION)
- TABLE 22. CANADA ARTIFICIAL PHOTOSYNTHESIS MARKET SIZE, BY APPLICATION, 2018-2030 (USD MILLION)
- TABLE 23. MEXICO ARTIFICIAL PHOTOSYNTHESIS MARKET SIZE, BY TECHNOLOGY, 2018-2030 (USD MILLION)
- TABLE 24. MEXICO ARTIFICIAL PHOTOSYNTHESIS MARKET SIZE, BY APPLICATION, 2018-2030 (USD MILLION)
- TABLE 25. UNITED STATES ARTIFICIAL PHOTOSYNTHESIS MARKET SIZE, BY TECHNOLOGY, 2018-2030 (USD MILLION)
- TABLE 26. UNITED STATES ARTIFICIAL PHOTOSYNTHESIS MARKET SIZE, BY APPLICATION, 2018-2030 (USD MILLION)
- TABLE 27. UNITED STATES ARTIFICIAL PHOTOSYNTHESIS MARKET SIZE, BY STATE, 2018-2030 (USD MILLION)
- TABLE 28. ASIA-PACIFIC ARTIFICIAL PHOTOSYNTHESIS MARKET SIZE, BY TECHNOLOGY, 2018-2030 (USD MILLION)
- TABLE 29. ASIA-PACIFIC ARTIFICIAL PHOTOSYNTHESIS MARKET SIZE, BY APPLICATION, 2018-2030 (USD MILLION)
- TABLE 30. ASIA-PACIFIC ARTIFICIAL PHOTOSYNTHESIS MARKET SIZE, BY COUNTRY, 2018-2030 (USD MILLION)
- TABLE 31. AUSTRALIA ARTIFICIAL PHOTOSYNTHESIS MARKET SIZE, BY TECHNOLOGY, 2018-2030 (USD MILLION)
- TABLE 32. AUSTRALIA ARTIFICIAL PHOTOSYNTHESIS MARKET SIZE, BY APPLICATION, 2018-2030 (USD MILLION)
- TABLE 33. CHINA ARTIFICIAL PHOTOSYNTHESIS MARKET SIZE, BY TECHNOLOGY, 2018-2030 (USD MILLION)
- TABLE 34. CHINA ARTIFICIAL PHOTOSYNTHESIS MARKET SIZE, BY APPLICATION, 2018-2030 (USD MILLION)
- TABLE 35. INDIA ARTIFICIAL PHOTOSYNTHESIS MARKET SIZE, BY TECHNOLOGY, 2018-2030 (USD MILLION)
- TABLE 36. INDIA ARTIFICIAL PHOTOSYNTHESIS MARKET SIZE, BY APPLICATION, 2018-2030 (USD MILLION)
- TABLE 37. INDONESIA ARTIFICIAL PHOTOSYNTHESIS MARKET SIZE, BY TECHNOLOGY, 2018-2030 (USD MILLION)
- TABLE 38. INDONESIA ARTIFICIAL PHOTOSYNTHESIS MARKET SIZE, BY APPLICATION, 2018-2030 (USD MILLION)
- TABLE 39. JAPAN ARTIFICIAL PHOTOSYNTHESIS MARKET SIZE, BY TECHNOLOGY, 2018-2030 (USD MILLION)
- TABLE 40. JAPAN ARTIFICIAL PHOTOSYNTHESIS MARKET SIZE, BY APPLICATION, 2018-2030 (USD MILLION)
- TABLE 41. MALAYSIA ARTIFICIAL PHOTOSYNTHESIS MARKET SIZE, BY TECHNOLOGY, 2018-2030 (USD MILLION)
- TABLE 42. MALAYSIA ARTIFICIAL PHOTOSYNTHESIS MARKET SIZE, BY APPLICATION, 2018-2030 (USD MILLION)
- TABLE 43. PHILIPPINES ARTIFICIAL PHOTOSYNTHESIS MARKET SIZE, BY TECHNOLOGY, 2018-2030 (USD MILLION)
- TABLE 44. PHILIPPINES ARTIFICIAL PHOTOSYNTHESIS MARKET SIZE, BY APPLICATION, 2018-2030 (USD MILLION)
- TABLE 45. SINGAPORE ARTIFICIAL PHOTOSYNTHESIS MARKET SIZE, BY TECHNOLOGY, 2018-2030 (USD MILLION)
- TABLE 46. SINGAPORE ARTIFICIAL PHOTOSYNTHESIS MARKET SIZE, BY APPLICATION, 2018-2030 (USD MILLION)
- TABLE 47. SOUTH KOREA ARTIFICIAL PHOTOSYNTHESIS MARKET SIZE, BY TECHNOLOGY, 2018-2030 (USD MILLION)
- TABLE 48. SOUTH KOREA ARTIFICIAL PHOTOSYNTHESIS MARKET SIZE, BY APPLICATION, 2018-2030 (USD MILLION)
- TABLE 49. TAIWAN ARTIFICIAL PHOTOSYNTHESIS MARKET SIZE, BY TECHNOLOGY, 2018-2030 (USD MILLION)
- TABLE 50. TAIWAN ARTIFICIAL PHOTOSYNTHESIS MARKET SIZE, BY APPLICATION, 2018-2030 (USD MILLION)
- TABLE 51. THAILAND ARTIFICIAL PHOTOSYNTHESIS MARKET SIZE, BY TECHNOLOGY, 2018-2030 (USD MILLION)
- TABLE 52. THAILAND ARTIFICIAL PHOTOSYNTHESIS MARKET SIZE, BY APPLICATION, 2018-2030 (USD MILLION)
- TABLE 53. VIETNAM ARTIFICIAL PHOTOSYNTHESIS MARKET SIZE, BY TECHNOLOGY, 2018-2030 (USD MILLION)
- TABLE 54. VIETNAM ARTIFICIAL PHOTOSYNTHESIS MARKET SIZE, BY APPLICATION, 2018-2030 (USD MILLION)
- TABLE 55. EUROPE, MIDDLE EAST & AFRICA ARTIFICIAL PHOTOSYNTHESIS MARKET SIZE, BY TECHNOLOGY, 2018-2030 (USD MILLION)
- TABLE 56. EUROPE, MIDDLE EAST & AFRICA ARTIFICIAL PHOTOSYNTHESIS MARKET SIZE, BY APPLICATION, 2018-2030 (USD MILLION)
- TABLE 57. EUROPE, MIDDLE EAST & AFRICA ARTIFICIAL PHOTOSYNTHESIS MARKET SIZE, BY COUNTRY, 2018-2030 (USD MILLION)
- TABLE 58. DENMARK ARTIFICIAL PHOTOSYNTHESIS MARKET SIZE, BY TECHNOLOGY, 2018-2030 (USD MILLION)
- TABLE 59. DENMARK ARTIFICIAL PHOTOSYNTHESIS MARKET SIZE, BY APPLICATION, 2018-2030 (USD MILLION)
- TABLE 60. EGYPT ARTIFICIAL PHOTOSYNTHESIS MARKET SIZE, BY TECHNOLOGY, 2018-2030 (USD MILLION)
- TABLE 61. EGYPT ARTIFICIAL PHOTOSYNTHESIS MARKET SIZE, BY APPLICATION, 2018-2030 (USD MILLION)
- TABLE 62. FINLAND ARTIFICIAL PHOTOSYNTHESIS MARKET SIZE, BY TECHNOLOGY, 2018-2030 (USD MILLION)
- TABLE 63. FINLAND ARTIFICIAL PHOTOSYNTHESIS MARKET SIZE, BY APPLICATION, 2018-2030 (USD MILLION)
- TABLE 64. FRANCE ARTIFICIAL PHOTOSYNTHESIS MARKET SIZE, BY TECHNOLOGY, 2018-2030 (USD MILLION)
- TABLE 65. FRANCE ARTIFICIAL PHOTOSYNTHESIS MARKET SIZE, BY APPLICATION, 2018-2030 (USD MILLION)
- TABLE 66. GERMANY ARTIFICIAL PHOTOSYNTHESIS MARKET SIZE, BY TECHNOLOGY, 2018-2030 (USD MILLION)
- TABLE 67. GERMANY ARTIFICIAL PHOTOSYNTHESIS MARKET SIZE, BY APPLICATION, 2018-2030 (USD MILLION)
- TABLE 68. ISRAEL ARTIFICIAL PHOTOSYNTHESIS MARKET SIZE, BY TECHNOLOGY, 2018-2030 (USD MILLION)
- TABLE 69. ISRAEL ARTIFICIAL PHOTOSYNTHESIS MARKET SIZE, BY APPLICATION, 2018-2030 (USD MILLION)
- TABLE 70. ITALY ARTIFICIAL PHOTOSYNTHESIS MARKET SIZE, BY TECHNOLOGY, 2018-2030 (USD MILLION)
- TABLE 71. ITALY ARTIFICIAL PHOTOSYNTHESIS MARKET SIZE, BY APPLICATION, 2018-2030 (USD MILLION)
- TABLE 72. NETHERLANDS ARTIFICIAL PHOTOSYNTHESIS MARKET SIZE, BY TECHNOLOGY, 2018-2030 (USD MILLION)
- TABLE 73. NETHERLANDS ARTIFICIAL PHOTOSYNTHESIS MARKET SIZE, BY APPLICATION, 2018-2030 (USD MILLION)
- TABLE 74. NIGERIA ARTIFICIAL PHOTOSYNTHESIS MARKET SIZE, BY TECHNOLOGY, 2018-2030 (USD MILLION)
- TABLE 75. NIGERIA ARTIFICIAL PHOTOSYNTHESIS MARKET SIZE, BY APPLICATION, 2018-2030 (USD MILLION)
- TABLE 76. NORWAY ARTIFICIAL PHOTOSYNTHESIS MARKET SIZE, BY TECHNOLOGY, 2018-2030 (USD MILLION)
- TABLE 77. NORWAY ARTIFICIAL PHOTOSYNTHESIS MARKET SIZE, BY APPLICATION, 2018-2030 (USD MILLION)
- TABLE 78. POLAND ARTIFICIAL PHOTOSYNTHESIS MARKET SIZE, BY TECHNOLOGY, 2018-2030 (USD MILLION)
- TABLE 79. POLAND ARTIFICIAL PHOTOSYNTHESIS MARKET SIZE, BY APPLICATION, 2018-2030 (USD MILLION)
- TABLE 80. QATAR ARTIFICIAL PHOTOSYNTHESIS MARKET SIZE, BY TECHNOLOGY, 2018-2030 (USD MILLION)
- TABLE 81. QATAR ARTIFICIAL PHOTOSYNTHESIS MARKET SIZE, BY APPLICATION, 2018-2030 (USD MILLION)
- TABLE 82. RUSSIA ARTIFICIAL PHOTOSYNTHESIS MARKET SIZE, BY TECHNOLOGY, 2018-2030 (USD MILLION)
- TABLE 83. RUSSIA ARTIFICIAL PHOTOSYNTHESIS MARKET SIZE, BY APPLICATION, 2018-2030 (USD MILLION)
- TABLE 84. SAUDI ARABIA ARTIFICIAL PHOTOSYNTHESIS MARKET SIZE, BY TECHNOLOGY, 2018-2030 (USD MILLION)
- TABLE 85. SAUDI ARABIA ARTIFICIAL PHOTOSYNTHESIS MARKET SIZE, BY APPLICATION, 2018-2030 (USD MILLION)
- TABLE 86. SOUTH AFRICA ARTIFICIAL PHOTOSYNTHESIS MARKET SIZE, BY TECHNOLOGY, 2018-2030 (USD MILLION)
- TABLE 87. SOUTH AFRICA ARTIFICIAL PHOTOSYNTHESIS MARKET SIZE, BY APPLICATION, 2018-2030 (USD MILLION)
- TABLE 88. SPAIN ARTIFICIAL PHOTOSYNTHESIS MARKET SIZE, BY TECHNOLOGY, 2018-2030 (USD MILLION)
- TABLE 89. SPAIN ARTIFICIAL PHOTOSYNTHESIS MARKET SIZE, BY APPLICATION, 2018-2030 (USD MILLION)
- TABLE 90. SWEDEN ARTIFICIAL PHOTOSYNTHESIS MARKET SIZE, BY TECHNOLOGY, 2018-2030 (USD MILLION)
- TABLE 91. SWEDEN ARTIFICIAL PHOTOSYNTHESIS MARKET SIZE, BY APPLICATION, 2018-2030 (USD MILLION)
- TABLE 92. SWITZERLAND ARTIFICIAL PHOTOSYNTHESIS MARKET SIZE, BY TECHNOLOGY, 2018-2030 (USD MILLION)
- TABLE 93. SWITZERLAND ARTIFICIAL PHOTOSYNTHESIS MARKET SIZE, BY APPLICATION, 2018-2030 (USD MILLION)
- TABLE 94. TURKEY ARTIFICIAL PHOTOSYNTHESIS MARKET SIZE, BY TECHNOLOGY, 2018-2030 (USD MILLION)
- TABLE 95. TURKEY ARTIFICIAL PHOTOSYNTHESIS MARKET SIZE, BY APPLICATION, 2018-2030 (USD MILLION)
- TABLE 96. UNITED ARAB EMIRATES ARTIFICIAL PHOTOSYNTHESIS MARKET SIZE, BY TECHNOLOGY, 2018-2030 (USD MILLION)
- TABLE 97. UNITED ARAB EMIRATES ARTIFICIAL PHOTOSYNTHESIS MARKET SIZE, BY APPLICATION, 2018-2030 (USD MILLION)
- TABLE 98. UNITED KINGDOM ARTIFICIAL PHOTOSYNTHESIS MARKET SIZE, BY TECHNOLOGY, 2018-2030 (USD MILLION)
- TABLE 99. UNITED KINGDOM ARTIFICIAL PHOTOSYNTHESIS MARKET SIZE, BY APPLICATION, 2018-2030 (USD MILLION)
- TABLE 100. ARTIFICIAL PHOTOSYNTHESIS MARKET, FPNV POSITIONING MATRIX, 2023
- TABLE 101. ARTIFICIAL PHOTOSYNTHESIS MARKET SHARE, BY KEY PLAYER, 2023
- TABLE 102. ARTIFICIAL PHOTOSYNTHESIS MARKET LICENSE & PRICING
 集光性材料市場(類型:有機、無機、混合及其他;及應用:太陽能電池、光電探測器、光計算、光化學及其他) - 2023-2031年全球行業分析、規模、佔有率、成長、趨勢和預測
 人工光合作用市場(產品類型:烴,氫,化學,技術:奈米技術,混合,電解,光觸媒)-全球產業分析,規模,佔有率,成長,趨勢,預測,2023-2031年
 人工光合作用的世界市場規模和佔有率的分析:各用途,各技術 - 產業需求預測(~2030年)
 人工光合作用的全球市場調查報告-產業分析,規模,佔有率,成長,趨勢,2022年~2028年前的預測
 人工光合作用的全球市場(2022年~2028年)
 人工光合作用的全球市場 - 市場佔有率,規模,趨勢,產業分析:各技術,各用途,各地區,市場區隔預測(2022年~2030年)
 全球人工光合作用市場規模:按技術(共電解分解,光電催化,其他(納米技術,混合工藝)),應用(碳氫化合物,氫氣,化學品),地區預測2022-2028
 人工光合作用的全球市場預測:各催化劑、類型(光電化學電池單元、光電池驅動型電解槽)、技術、地區的世界分析(~2028年)