


 |
市場調查報告書
商品編碼
1434471
線上賭博市場:按遊戲、設備和付款方式分類 - 2023-2030 年全球預測Online Gambling Market by Game (Bingo, Casino/Poker, Lottery), Device (Desktop, Mobile), Payment Mode - Global Forecast 2023-2030 |
||||||
※ 本網頁內容可能與最新版本有所差異。詳細情況請與我們聯繫。
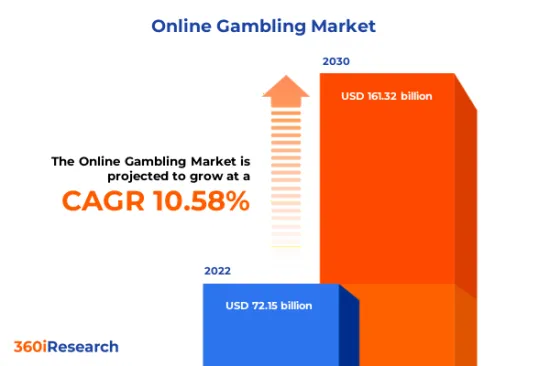
預計2022年線上博彩市場規模將達721.5億美元,2023年將達798億美元,預計2030年將達到1,613.2億美元,複合年成長率為10.58%。
全球線上賭博市場
| 主要市場統計 | |
|---|---|
| 基準年[2022] | 721.5億美元 |
| 預測年份 [2023] | 798億美元 |
| 預測年份 [2030] | 1613.2億美元 |
| 複合年成長率(%) | 10.58% |
線上賭博包括透過網路提供的遠端遊戲活動,包括線上投注、賭場遊戲、撲克、彩票和其他賭博服務。全球網路服務的便利性、線上平台的便利性以及智慧型手機和其他設備的普及正在推動市場成長,並為消費者提供多樣化的參與賭博活動的方式。線上賭博應用程式已遍布各種數位平台,包括桌上型電腦和行動裝置。行動技術和使用者體驗的不斷創新、對賭博的接受度和文化變革正在推動線上賭博的成長和需求。然而,各個司法管轄區的監管限制、網路安全威脅以及對與賭博成癮相關的社會影響的擔憂正在阻礙市場成長。主要企業正在探索先進的加密技術,以提高資料安全性並減輕與線上賭博相關的隱私問題。此外,利用擴增實境(AR)和虛擬實境(VR)來增強用戶參與度並利用人工智慧來個人化遊戲體驗的舉措將為線上賭博市場提供新的成長途徑,這是有可能的。
區域洞察
由於政府合法化框架的到位、潛在消費者基礎的不斷成長以及網際網路的高普及,美洲的線上賭博市場正在快速成長。美國經濟的大部分領域正在加速賭博合法化的進程。 AR/VR 技術以及與人工智慧的整合等技術創新正在推動消費者對線上賭博的偏好。亞太地區線上博彩市場提供了利潤豐厚的成長機會。該地區的競爭形勢高度分散,且線上賭博網站的法律存取限制不明確。由於歐洲對線上賭博平台的法律規範多樣化以及智慧型手機和普及的高普及率,因此對線上賭博的需求很高。有利的法律和合法化對於擴大線上賭博的法律空間發揮著重要作用。中東的線上賭博市場受阿拉伯賭博法監管,各國的法律有所不同,儘管一些國家的賭博合法化,但整個中東地區的線上賭博仍然是非法的。以色列、黎巴嫩和摩洛哥放寬了有關彩票銷售和體育博彩的法律。
FPNV定位矩陣
FPNV定位矩陣對於評估線上博弈市場至關重要。我們檢視與業務策略和產品滿意度相關的關鍵指標,以對供應商進行全面評估。這種深入的分析使用戶能夠根據自己的要求做出明智的決策。根據評估,供應商被分為四個成功程度不同的像限:前沿(F)、探路者(P)、利基(N)和重要(V)。
市場佔有率分析
市場佔有率分析是一種綜合工具,可對線上博彩市場供應商的現狀進行深入而詳細的研究。全面比較和分析供應商在整體收益、基本客群和其他關鍵指標方面的貢獻,以便更好地了解公司的績效及其在爭奪市場佔有率時面臨的挑戰。此外,該分析還提供了對該行業競爭特徵的寶貴見解,包括在研究基準年觀察到的累積、分散主導地位和合併特徵等因素。這種詳細程度的提高使供應商能夠做出更明智的決策並制定有效的策略,從而在市場上獲得競爭優勢。
該報告對以下幾個方面提供了寶貴的見解:
1-市場滲透率:提供有關主要企業所服務的市場的全面資訊。
2-市場開拓:我們深入研究利潤豐厚的新興市場,並分析它們在成熟細分市場中的滲透率。
3- 市場多元化:提供有關新產品發布、開拓地區、最新發展和投資的詳細資訊。
4-競爭力評估與資訊:對主要企業的市場佔有率、策略、產品、認證、監管狀況、專利狀況、製造能力等進行全面評估。
5- 產品開發與創新:提供對未來技術、研發活動和突破性產品開發的見解。
本報告解決了以下關鍵問題:
1-線上博弈市場的市場規模和預測是多少?
2-線上博弈市場預測期間需要考慮投資的產品、細分市場、應用程式和領域有哪些?
3-線上博彩市場的技術趨勢和法律規範是什麼?
4-線上賭博市場主要供應商的市場佔有率是多少?
5-進入網路博弈市場的合適型態和策略手段是什麼?
目錄
第1章 前言
第2章調查方法
第3章執行摘要
第4章市場概況
第5章市場洞察
- 市場動態
- 促進因素
- 加上網路的高普及,智慧型手機的普及也不斷提高。
- 網路賭博逐步合法化,政府法規政策放寬
- 抑制因素
- 與線上賭博平台相關的網路犯罪和駭客問題
- 機會
- 線上賭博平台的技術進步
- 用於付款處理的虛擬貨幣和區塊鏈
- 任務
- 文化障礙與日益嚴重的成癮行為問題
- 線上賭博的採用速度放緩,有利於實體賭場
- 促進因素
- 市場區隔分析
- 遊戲:老虎機、二十一點和輪盤等賭場/撲克日益流行
- 設備:桌上型電腦廣泛用於線上賭博,因為它們提供穩定且令人滿意的遊戲體驗。
- 付款方式:虛擬在規避風險的人群中的潛力不斷增加
- 市場趨勢分析
- 博彩平台的法律變化和技術進步正在加強美洲地區線上博彩的採用
- 亞太地區不斷變化的線上賭博法律形勢為國際公司擴大在該地區的客戶群提供了機會
- 歐洲/中東/非洲地區主要市場參與者的強大影響力以及對線上賭博平台有利的政府政策將支持新賭博平台的部署
- 高通膨的累積效應
- 波特五力分析
- 價值鍊和關鍵路徑分析
- 法律規範
第6章 線上博弈市場(按遊戲)
- 答對了
- 賭場/撲克
- 抽籤
- 社交遊戲
- 體育博彩
第 7 章 線上賭博市場:按設備
- 桌面
- 智慧型手機
第8章 線上賭博市場:按付款方式
- 真錢
- 虛擬貨幣
第 9 章 美洲線上博弈市場
- 阿根廷
- 巴西
- 加拿大
- 墨西哥
- 美國
第10章亞太線上博弈市場
- 澳洲
- 中國
- 印度
- 印尼
- 日本
- 馬來西亞
- 菲律賓
- 新加坡
- 韓國
- 台灣
- 泰國
- 越南
第11章 歐洲、中東和非洲的線上博弈市場
- 丹麥
- 埃及
- 芬蘭
- 法國
- 德國
- 以色列
- 義大利
- 荷蘭
- 奈及利亞
- 挪威
- 波蘭
- 卡達
- 俄羅斯
- 沙烏地阿拉伯
- 南非
- 西班牙
- 瑞典
- 瑞士
- 土耳其
- 阿拉伯聯合大公國
- 英國
第12章競爭形勢
- FPNV定位矩陣
- 市場佔有率分析:主要企業
- 主要企業競爭情境分析
- 併購
- 合約、合作和夥伴關係
- 新產品發布和功能增強
- 獎項/獎勵/擴展
第13章競爭產品組合
- 主要公司簡介
- 1xBet
- 888 Holdings PLC
- Action Network, Inc. by Better Collective A/S
- beBettor Limited
- Bet365 Group Ltd.
- Betsson AB
- Blaze by Prolific Trade NV
- Bovada
- Caesars Entertainment, Inc.
- Dafabet
- Entain PLC
- Evolution Gaming Group
- Flutter Entertainment PLC
- Fortuna Entertainment Group AS
- Gamesys Group PLC by Bally's Corporation
- Genius Sports Group
- Huddle Gaming Inc.
- Huuuge, Inc.
- Jackpocket, Inc.
- Kindred Group PLC
- Light & Wonder, Inc.
- MGM Resorts International
- Playstar Gaming Group
- Practice Ignition Group
- Rush Street Interactive, Inc.
- SGHC Limited
- SportPesa
- The Hong Kong Jockey Club
- Zodiac Casino by Casino Rewards
- 主要產品系列
第14章附錄
- 討論指南
- 關於許可證和定價
[195 Pages Report] The Online Gambling Market size was estimated at USD 72.15 billion in 2022 and expected to reach USD 79.80 billion in 2023, at a CAGR 10.58% to reach USD 161.32 billion by 2030.
Global Online Gambling Market
| KEY MARKET STATISTICS | |
|---|---|
| Base Year [2022] | USD 72.15 billion |
| Estimated Year [2023] | USD 79.80 billion |
| Forecast Year [2030] | USD 161.32 billion |
| CAGR (%) | 10.58% |
Online gambling encompasses the remote gaming activities offered through the internet, which includes online betting, casino games, poker, lotteries, and other gambling services. The accessibility of internet services globally, the convenience of online platforms, and the widespread use of smartphones and other devices foster the growth of the market and provide diverse ways for consumers to participate in gambling activities. Applications for online gambling extend across various digital platforms, including desktop and mobile devices. Growing innovations in mobile technology and user experience with increased acceptance and cultural changes toward gambling are driving the growth and demand for online gambling. However, regulatory constraints in various jurisdictions, cybersecurity threats, and concerns related to the social impact associated with gambling addiction hamper the growth of the market. Key players are exploring advanced encryption technologies to promote data security and mitigate privacy issues associated with online gambling. Furthermore, the growing use of augmented reality (AR) and virtual reality (VR) to enhance user engagement and AI to personalize gaming experiences can provide new avenues of growth for the online gambling market.
Regional Insights
The online gambling market in the Americas is rapidly growing due to favorable governmental legalization frameworks, a growing potential consumer base, and high internet penetration. The move toward legalizing gambling throughout most of America's economies is gaining momentum. Technological innovations such as AR/VR technologies and integration with AI have driven consumer preference for online gambling. The online gambling market in the APAC region is presenting lucrative growth opportunities. The competitive landscape in the region is quite fragmented and unclear regarding restricted legal access to online gambling websites. Europe represents a strong demand for online gambling due to high smartphone and internet penetration with diverse regulatory frameworks for online gambling platforms. Favorable legislation and legalization have played an essential role in opening more legal spaces for online gambling. The Middle East online gambling market is regulated by Arabic gambling laws that vary by country, and a few countries have legal gambling; however, online gambling is still illegal throughout the Middle East. There are liberalized laws for lottery sales and sports betting in Israel, Lebanon, and Morocco.
FPNV Positioning Matrix
The FPNV Positioning Matrix is pivotal in evaluating the Online Gambling Market. It offers a comprehensive assessment of vendors, examining key metrics related to Business Strategy and Product Satisfaction. This in-depth analysis empowers users to make well-informed decisions aligned with their requirements. Based on the evaluation, the vendors are then categorized into four distinct quadrants representing varying levels of success: Forefront (F), Pathfinder (P), Niche (N), or Vital (V).
Market Share Analysis
The Market Share Analysis is a comprehensive tool that provides an insightful and in-depth examination of the current state of vendors in the Online Gambling Market. By meticulously comparing and analyzing vendor contributions in terms of overall revenue, customer base, and other key metrics, we can offer companies a greater understanding of their performance and the challenges they face when competing for market share. Additionally, this analysis provides valuable insights into the competitive nature of the sector, including factors such as accumulation, fragmentation dominance, and amalgamation traits observed over the base year period studied. With this expanded level of detail, vendors can make more informed decisions and devise effective strategies to gain a competitive edge in the market.
Key Company Profiles
The report delves into recent significant developments in the Online Gambling Market, highlighting leading vendors and their innovative profiles. These include 1xBet, 888 Holdings PLC, Action Network, Inc. by Better Collective A/S, beBettor Limited, Bet365 Group Ltd., Betsson AB, Blaze by Prolific Trade N.V., Bovada, Caesars Entertainment, Inc., Dafabet, Entain PLC, Evolution Gaming Group, Flutter Entertainment PLC, Fortuna Entertainment Group A.S., Gamesys Group PLC by Bally's Corporation, Genius Sports Group, Huddle Gaming Inc., Huuuge, Inc., Jackpocket, Inc., Kindred Group PLC, Light & Wonder, Inc., MGM Resorts International, Playstar Gaming Group, Practice Ignition Group, Rush Street Interactive, Inc., SGHC Limited, SportPesa, The Hong Kong Jockey Club, and Zodiac Casino by Casino Rewards.
Market Segmentation & Coverage
This research report categorizes the Online Gambling Market to forecast the revenues and analyze trends in each of the following sub-markets:
- Game
- Bingo
- Casino/Poker
- Lottery
- Social Gaming
- Sports Betting
- Device
- Desktop
- Mobile
- Payment Mode
- Real Money
- Virtual Money
- Region
- Americas
- Argentina
- Brazil
- Canada
- Mexico
- United States
- California
- Florida
- Illinois
- New York
- Ohio
- Pennsylvania
- Texas
- Asia-Pacific
- Australia
- China
- India
- Indonesia
- Japan
- Malaysia
- Philippines
- Singapore
- South Korea
- Taiwan
- Thailand
- Vietnam
- Europe, Middle East & Africa
- Denmark
- Egypt
- Finland
- France
- Germany
- Israel
- Italy
- Netherlands
- Nigeria
- Norway
- Poland
- Qatar
- Russia
- Saudi Arabia
- South Africa
- Spain
- Sweden
- Switzerland
- Turkey
- United Arab Emirates
- United Kingdom
- Americas
The report offers valuable insights on the following aspects:
1. Market Penetration: It presents comprehensive information on the market provided by key players.
2. Market Development: It delves deep into lucrative emerging markets and analyzes the penetration across mature market segments.
3. Market Diversification: It provides detailed information on new product launches, untapped geographic regions, recent developments, and investments.
4. Competitive Assessment & Intelligence: It conducts an exhaustive assessment of market shares, strategies, products, certifications, regulatory approvals, patent landscape, and manufacturing capabilities of the leading players.
5. Product Development & Innovation: It offers intelligent insights on future technologies, R&D activities, and breakthrough product developments.
The report addresses key questions such as:
1. What is the market size and forecast of the Online Gambling Market?
2. Which products, segments, applications, and areas should one consider investing in over the forecast period in the Online Gambling Market?
3. What are the technology trends and regulatory frameworks in the Online Gambling Market?
4. What is the market share of the leading vendors in the Online Gambling Market?
5. Which modes and strategic moves are suitable for entering the Online Gambling Market?
Table of Contents
1. Preface
- 1.1. Objectives of the Study
- 1.2. Market Segmentation & Coverage
- 1.3. Years Considered for the Study
- 1.4. Currency & Pricing
- 1.5. Language
- 1.6. Limitations
- 1.7. Assumptions
- 1.8. Stakeholders
2. Research Methodology
- 2.1. Define: Research Objective
- 2.2. Determine: Research Design
- 2.3. Prepare: Research Instrument
- 2.4. Collect: Data Source
- 2.5. Analyze: Data Interpretation
- 2.6. Formulate: Data Verification
- 2.7. Publish: Research Report
- 2.8. Repeat: Report Update
3. Executive Summary
4. Market Overview
- 4.1. Introduction
- 4.2. Online Gambling Market, by Region
5. Market Insights
- 5.1. Market Dynamics
- 5.1.1. Drivers
- 5.1.1.1. Increasing smartphone adoption coupled with the high internet penetration
- 5.1.1.2. Gradual legalization of online gambling and relaxation of government regulations & policies
- 5.1.2. Restraints
- 5.1.2.1. Cybercrime & hacking issues related to the online gambling platform
- 5.1.3. Opportunities
- 5.1.3.1. Technology advancements in online gambling platforms
- 5.1.3.2. Adoption of virtual currencies and blockchain for payment processing
- 5.1.4. Challenges
- 5.1.4.1. Cultural barriers & rising addiction behavior issues
- 5.1.4.2. Slow adoption of online gambling in favor of land-based casinos
- 5.1.1. Drivers
- 5.2. Market Segmentation Analysis
- 5.2.1. Game: Growing popularity of casino/poker such as slots, blackjack, and roulette
- 5.2.2. Device: Significant adoption of desktops for online gambling as it provides a stable and enriched gaming experience
- 5.2.3. Payment Mode: Rising potential of virtual money among risk-averse audience
- 5.3. Market Trend Analysis
- 5.3.1. Enhancing adoption of online gambling in Americas region driven by legislative changes and technology advancements in betting platforms
- 5.3.2. Evolving legal landscape for online gambling in APAC opening opportunities for international companies to expand their customer base in the region
- 5.3.3. Strong presence of key market players with favorable government policies for online gambling platforms in the EMEA region assists in the deployment of novel gambling platforms
- 5.4. Cumulative Impact of High Inflation
- 5.5. Porter's Five Forces Analysis
- 5.5.1. Threat of New Entrants
- 5.5.2. Threat of Substitutes
- 5.5.3. Bargaining Power of Customers
- 5.5.4. Bargaining Power of Suppliers
- 5.5.5. Industry Rivalry
- 5.6. Value Chain & Critical Path Analysis
- 5.7. Regulatory Framework
6. Online Gambling Market, by Game
- 6.1. Introduction
- 6.2. Bingo
- 6.3. Casino/Poker
- 6.4. Lottery
- 6.5. Social Gaming
- 6.6. Sports Betting
7. Online Gambling Market, by Device
- 7.1. Introduction
- 7.2. Desktop
- 7.3. Mobile
8. Online Gambling Market, by Payment Mode
- 8.1. Introduction
- 8.2. Real Money
- 8.3. Virtual Money
9. Americas Online Gambling Market
- 9.1. Introduction
- 9.2. Argentina
- 9.3. Brazil
- 9.4. Canada
- 9.5. Mexico
- 9.6. United States
10. Asia-Pacific Online Gambling Market
- 10.1. Introduction
- 10.2. Australia
- 10.3. China
- 10.4. India
- 10.5. Indonesia
- 10.6. Japan
- 10.7. Malaysia
- 10.8. Philippines
- 10.9. Singapore
- 10.10. South Korea
- 10.11. Taiwan
- 10.12. Thailand
- 10.13. Vietnam
11. Europe, Middle East & Africa Online Gambling Market
- 11.1. Introduction
- 11.2. Denmark
- 11.3. Egypt
- 11.4. Finland
- 11.5. France
- 11.6. Germany
- 11.7. Israel
- 11.8. Italy
- 11.9. Netherlands
- 11.10. Nigeria
- 11.11. Norway
- 11.12. Poland
- 11.13. Qatar
- 11.14. Russia
- 11.15. Saudi Arabia
- 11.16. South Africa
- 11.17. Spain
- 11.18. Sweden
- 11.19. Switzerland
- 11.20. Turkey
- 11.21. United Arab Emirates
- 11.22. United Kingdom
12. Competitive Landscape
- 12.1. FPNV Positioning Matrix
- 12.2. Market Share Analysis, By Key Player
- 12.3. Competitive Scenario Analysis, By Key Player
- 12.3.1. Merger & Acquisition
- 12.3.1.1. Sega Sammy to acquire GAN for USD 107.6 million
- 12.3.1.2. Entain to buy Poland-based Betting Operator for USD 946 million
- 12.3.2. Agreement, Collaboration, & Partnership
- 12.3.2.1. Super Group's Betway becomes Global Betting Partner of Arsenal
- 12.3.2.2. CORRECTING and REPLACING Gambling.com Group Enters Into First International Media Partnership with the Independent
- 12.3.2.3. Inspired Announces Long-Term Contract Extension with bet365
- 12.3.2.4. PokerStars Joins the Portuguese Online Betting and Gambling Association as its Newest Affiliate Member
- 12.3.2.5. BETER is now the Official eSports Provider for the Fortuna Entertainment Group
- 12.3.2.6. Gannett and Gambling.com Group Announce Strategic Partnership
- 12.3.3. New Product Launch & Enhancement
- 12.3.3.1. BetMGM and Inspired Entertainment Launch MGM Bonus City, Revolutionary Hybrid Dealer Game
- 12.3.4. Award, Recognition, & Expansion
- 12.3.4.1. Light & Wonder Launches Authentic Gaming Live Dealer Games in U.S.
- 12.3.4.2. Rush Street Interactive Becomes First U.S.-based Online Gaming & Betting Company to Receive Accreditations Under the Responsible Gambling Council's RG Check
- 12.3.1. Merger & Acquisition
13. Competitive Portfolio
- 13.1. Key Company Profiles
- 13.1.1. 1xBet
- 13.1.2. 888 Holdings PLC
- 13.1.3. Action Network, Inc. by Better Collective A/S
- 13.1.4. beBettor Limited
- 13.1.5. Bet365 Group Ltd.
- 13.1.6. Betsson AB
- 13.1.7. Blaze by Prolific Trade N.V.
- 13.1.8. Bovada
- 13.1.9. Caesars Entertainment, Inc.
- 13.1.10. Dafabet
- 13.1.11. Entain PLC
- 13.1.12. Evolution Gaming Group
- 13.1.13. Flutter Entertainment PLC
- 13.1.14. Fortuna Entertainment Group A.S.
- 13.1.15. Gamesys Group PLC by Bally's Corporation
- 13.1.16. Genius Sports Group
- 13.1.17. Huddle Gaming Inc.
- 13.1.18. Huuuge, Inc.
- 13.1.19. Jackpocket, Inc.
- 13.1.20. Kindred Group PLC
- 13.1.21. Light & Wonder, Inc.
- 13.1.22. MGM Resorts International
- 13.1.23. Playstar Gaming Group
- 13.1.24. Practice Ignition Group
- 13.1.25. Rush Street Interactive, Inc.
- 13.1.26. SGHC Limited
- 13.1.27. SportPesa
- 13.1.28. The Hong Kong Jockey Club
- 13.1.29. Zodiac Casino by Casino Rewards
- 13.2. Key Product Portfolio
14. Appendix
- 14.1. Discussion Guide
- 14.2. License & Pricing
LIST OF FIGURES
- FIGURE 1. ONLINE GAMBLING MARKET RESEARCH PROCESS
- FIGURE 2. ONLINE GAMBLING MARKET SIZE, 2022 VS 2030
- FIGURE 3. ONLINE GAMBLING MARKET SIZE, 2018-2030 (USD MILLION)
- FIGURE 4. ONLINE GAMBLING MARKET SIZE, BY REGION, 2022 VS 2030 (%)
- FIGURE 5. ONLINE GAMBLING MARKET SIZE, BY REGION, 2022 VS 2023 VS 2030 (USD MILLION)
- FIGURE 6. ONLINE GAMBLING MARKET DYNAMICS
- FIGURE 7. ONLINE GAMBLING MARKET SIZE, BY GAME, 2022 VS 2030 (%)
- FIGURE 8. ONLINE GAMBLING MARKET SIZE, BY GAME, 2022 VS 2023 VS 2030 (USD MILLION)
- FIGURE 9. ONLINE GAMBLING MARKET SIZE, BY DEVICE, 2022 VS 2030 (%)
- FIGURE 10. ONLINE GAMBLING MARKET SIZE, BY DEVICE, 2022 VS 2023 VS 2030 (USD MILLION)
- FIGURE 11. ONLINE GAMBLING MARKET SIZE, BY PAYMENT MODE, 2022 VS 2030 (%)
- FIGURE 12. ONLINE GAMBLING MARKET SIZE, BY PAYMENT MODE, 2022 VS 2023 VS 2030 (USD MILLION)
- FIGURE 13. AMERICAS ONLINE GAMBLING MARKET SIZE, BY COUNTRY, 2022 VS 2030 (%)
- FIGURE 14. AMERICAS ONLINE GAMBLING MARKET SIZE, BY COUNTRY, 2022 VS 2023 VS 2030 (USD MILLION)
- FIGURE 15. UNITED STATES ONLINE GAMBLING MARKET SIZE, BY STATE, 2022 VS 2030 (%)
- FIGURE 16. UNITED STATES ONLINE GAMBLING MARKET SIZE, BY STATE, 2022 VS 2023 VS 2030 (USD MILLION)
- FIGURE 17. ASIA-PACIFIC ONLINE GAMBLING MARKET SIZE, BY COUNTRY, 2022 VS 2030 (%)
- FIGURE 18. ASIA-PACIFIC ONLINE GAMBLING MARKET SIZE, BY COUNTRY, 2022 VS 2023 VS 2030 (USD MILLION)
- FIGURE 19. EUROPE, MIDDLE EAST & AFRICA ONLINE GAMBLING MARKET SIZE, BY COUNTRY, 2022 VS 2030 (%)
- FIGURE 20. EUROPE, MIDDLE EAST & AFRICA ONLINE GAMBLING MARKET SIZE, BY COUNTRY, 2022 VS 2023 VS 2030 (USD MILLION)
- FIGURE 21. ONLINE GAMBLING MARKET, FPNV POSITIONING MATRIX, 2022
- FIGURE 22. ONLINE GAMBLING MARKET SHARE, BY KEY PLAYER, 2022
LIST OF TABLES
- TABLE 1. ONLINE GAMBLING MARKET SEGMENTATION & COVERAGE
- TABLE 2. UNITED STATES DOLLAR EXCHANGE RATE, 2018-2022
- TABLE 3. ONLINE GAMBLING MARKET SIZE, 2018-2030 (USD MILLION)
- TABLE 4. GLOBAL ONLINE GAMBLING MARKET SIZE, BY REGION, 2018-2030 (USD MILLION)
- TABLE 5. ONLINE GAMBLING MARKET SIZE, BY GAME, 2018-2030 (USD MILLION)
- TABLE 6. ONLINE GAMBLING MARKET SIZE, BY BINGO, BY REGION, 2018-2030 (USD MILLION)
- TABLE 7. ONLINE GAMBLING MARKET SIZE, BY CASINO/POKER, BY REGION, 2018-2030 (USD MILLION)
- TABLE 8. ONLINE GAMBLING MARKET SIZE, BY LOTTERY, BY REGION, 2018-2030 (USD MILLION)
- TABLE 9. ONLINE GAMBLING MARKET SIZE, BY SOCIAL GAMING, BY REGION, 2018-2030 (USD MILLION)
- TABLE 10. ONLINE GAMBLING MARKET SIZE, BY SPORTS BETTING, BY REGION, 2018-2030 (USD MILLION)
- TABLE 11. ONLINE GAMBLING MARKET SIZE, BY DEVICE, 2018-2030 (USD MILLION)
- TABLE 12. ONLINE GAMBLING MARKET SIZE, BY DESKTOP, BY REGION, 2018-2030 (USD MILLION)
- TABLE 13. ONLINE GAMBLING MARKET SIZE, BY MOBILE, BY REGION, 2018-2030 (USD MILLION)
- TABLE 14. ONLINE GAMBLING MARKET SIZE, BY PAYMENT MODE, 2018-2030 (USD MILLION)
- TABLE 15. ONLINE GAMBLING MARKET SIZE, BY REAL MONEY, BY REGION, 2018-2030 (USD MILLION)
- TABLE 16. ONLINE GAMBLING MARKET SIZE, BY VIRTUAL MONEY, BY REGION, 2018-2030 (USD MILLION)
- TABLE 17. AMERICAS ONLINE GAMBLING MARKET SIZE, BY GAME, 2018-2030 (USD MILLION)
- TABLE 18. AMERICAS ONLINE GAMBLING MARKET SIZE, BY DEVICE, 2018-2030 (USD MILLION)
- TABLE 19. AMERICAS ONLINE GAMBLING MARKET SIZE, BY PAYMENT MODE, 2018-2030 (USD MILLION)
- TABLE 20. AMERICAS ONLINE GAMBLING MARKET SIZE, BY COUNTRY, 2018-2030 (USD MILLION)
- TABLE 21. ARGENTINA ONLINE GAMBLING MARKET SIZE, BY GAME, 2018-2030 (USD MILLION)
- TABLE 22. ARGENTINA ONLINE GAMBLING MARKET SIZE, BY DEVICE, 2018-2030 (USD MILLION)
- TABLE 23. ARGENTINA ONLINE GAMBLING MARKET SIZE, BY PAYMENT MODE, 2018-2030 (USD MILLION)
- TABLE 24. BRAZIL ONLINE GAMBLING MARKET SIZE, BY GAME, 2018-2030 (USD MILLION)
- TABLE 25. BRAZIL ONLINE GAMBLING MARKET SIZE, BY DEVICE, 2018-2030 (USD MILLION)
- TABLE 26. BRAZIL ONLINE GAMBLING MARKET SIZE, BY PAYMENT MODE, 2018-2030 (USD MILLION)
- TABLE 27. CANADA ONLINE GAMBLING MARKET SIZE, BY GAME, 2018-2030 (USD MILLION)
- TABLE 28. CANADA ONLINE GAMBLING MARKET SIZE, BY DEVICE, 2018-2030 (USD MILLION)
- TABLE 29. CANADA ONLINE GAMBLING MARKET SIZE, BY PAYMENT MODE, 2018-2030 (USD MILLION)
- TABLE 30. MEXICO ONLINE GAMBLING MARKET SIZE, BY GAME, 2018-2030 (USD MILLION)
- TABLE 31. MEXICO ONLINE GAMBLING MARKET SIZE, BY DEVICE, 2018-2030 (USD MILLION)
- TABLE 32. MEXICO ONLINE GAMBLING MARKET SIZE, BY PAYMENT MODE, 2018-2030 (USD MILLION)
- TABLE 33. UNITED STATES ONLINE GAMBLING MARKET SIZE, BY GAME, 2018-2030 (USD MILLION)
- TABLE 34. UNITED STATES ONLINE GAMBLING MARKET SIZE, BY DEVICE, 2018-2030 (USD MILLION)
- TABLE 35. UNITED STATES ONLINE GAMBLING MARKET SIZE, BY PAYMENT MODE, 2018-2030 (USD MILLION)
- TABLE 36. UNITED STATES ONLINE GAMBLING MARKET SIZE, BY STATE, 2018-2030 (USD MILLION)
- TABLE 37. ASIA-PACIFIC ONLINE GAMBLING MARKET SIZE, BY GAME, 2018-2030 (USD MILLION)
- TABLE 38. ASIA-PACIFIC ONLINE GAMBLING MARKET SIZE, BY DEVICE, 2018-2030 (USD MILLION)
- TABLE 39. ASIA-PACIFIC ONLINE GAMBLING MARKET SIZE, BY PAYMENT MODE, 2018-2030 (USD MILLION)
- TABLE 40. ASIA-PACIFIC ONLINE GAMBLING MARKET SIZE, BY COUNTRY, 2018-2030 (USD MILLION)
- TABLE 41. AUSTRALIA ONLINE GAMBLING MARKET SIZE, BY GAME, 2018-2030 (USD MILLION)
- TABLE 42. AUSTRALIA ONLINE GAMBLING MARKET SIZE, BY DEVICE, 2018-2030 (USD MILLION)
- TABLE 43. AUSTRALIA ONLINE GAMBLING MARKET SIZE, BY PAYMENT MODE, 2018-2030 (USD MILLION)
- TABLE 44. CHINA ONLINE GAMBLING MARKET SIZE, BY GAME, 2018-2030 (USD MILLION)
- TABLE 45. CHINA ONLINE GAMBLING MARKET SIZE, BY DEVICE, 2018-2030 (USD MILLION)
- TABLE 46. CHINA ONLINE GAMBLING MARKET SIZE, BY PAYMENT MODE, 2018-2030 (USD MILLION)
- TABLE 47. INDIA ONLINE GAMBLING MARKET SIZE, BY GAME, 2018-2030 (USD MILLION)
- TABLE 48. INDIA ONLINE GAMBLING MARKET SIZE, BY DEVICE, 2018-2030 (USD MILLION)
- TABLE 49. INDIA ONLINE GAMBLING MARKET SIZE, BY PAYMENT MODE, 2018-2030 (USD MILLION)
- TABLE 50. INDONESIA ONLINE GAMBLING MARKET SIZE, BY GAME, 2018-2030 (USD MILLION)
- TABLE 51. INDONESIA ONLINE GAMBLING MARKET SIZE, BY DEVICE, 2018-2030 (USD MILLION)
- TABLE 52. INDONESIA ONLINE GAMBLING MARKET SIZE, BY PAYMENT MODE, 2018-2030 (USD MILLION)
- TABLE 53. JAPAN ONLINE GAMBLING MARKET SIZE, BY GAME, 2018-2030 (USD MILLION)
- TABLE 54. JAPAN ONLINE GAMBLING MARKET SIZE, BY DEVICE, 2018-2030 (USD MILLION)
- TABLE 55. JAPAN ONLINE GAMBLING MARKET SIZE, BY PAYMENT MODE, 2018-2030 (USD MILLION)
- TABLE 56. MALAYSIA ONLINE GAMBLING MARKET SIZE, BY GAME, 2018-2030 (USD MILLION)
- TABLE 57. MALAYSIA ONLINE GAMBLING MARKET SIZE, BY DEVICE, 2018-2030 (USD MILLION)
- TABLE 58. MALAYSIA ONLINE GAMBLING MARKET SIZE, BY PAYMENT MODE, 2018-2030 (USD MILLION)
- TABLE 59. PHILIPPINES ONLINE GAMBLING MARKET SIZE, BY GAME, 2018-2030 (USD MILLION)
- TABLE 60. PHILIPPINES ONLINE GAMBLING MARKET SIZE, BY DEVICE, 2018-2030 (USD MILLION)
- TABLE 61. PHILIPPINES ONLINE GAMBLING MARKET SIZE, BY PAYMENT MODE, 2018-2030 (USD MILLION)
- TABLE 62. SINGAPORE ONLINE GAMBLING MARKET SIZE, BY GAME, 2018-2030 (USD MILLION)
- TABLE 63. SINGAPORE ONLINE GAMBLING MARKET SIZE, BY DEVICE, 2018-2030 (USD MILLION)
- TABLE 64. SINGAPORE ONLINE GAMBLING MARKET SIZE, BY PAYMENT MODE, 2018-2030 (USD MILLION)
- TABLE 65. SOUTH KOREA ONLINE GAMBLING MARKET SIZE, BY GAME, 2018-2030 (USD MILLION)
- TABLE 66. SOUTH KOREA ONLINE GAMBLING MARKET SIZE, BY DEVICE, 2018-2030 (USD MILLION)
- TABLE 67. SOUTH KOREA ONLINE GAMBLING MARKET SIZE, BY PAYMENT MODE, 2018-2030 (USD MILLION)
- TABLE 68. TAIWAN ONLINE GAMBLING MARKET SIZE, BY GAME, 2018-2030 (USD MILLION)
- TABLE 69. TAIWAN ONLINE GAMBLING MARKET SIZE, BY DEVICE, 2018-2030 (USD MILLION)
- TABLE 70. TAIWAN ONLINE GAMBLING MARKET SIZE, BY PAYMENT MODE, 2018-2030 (USD MILLION)
- TABLE 71. THAILAND ONLINE GAMBLING MARKET SIZE, BY GAME, 2018-2030 (USD MILLION)
- TABLE 72. THAILAND ONLINE GAMBLING MARKET SIZE, BY DEVICE, 2018-2030 (USD MILLION)
- TABLE 73. THAILAND ONLINE GAMBLING MARKET SIZE, BY PAYMENT MODE, 2018-2030 (USD MILLION)
- TABLE 74. VIETNAM ONLINE GAMBLING MARKET SIZE, BY GAME, 2018-2030 (USD MILLION)
- TABLE 75. VIETNAM ONLINE GAMBLING MARKET SIZE, BY DEVICE, 2018-2030 (USD MILLION)
- TABLE 76. VIETNAM ONLINE GAMBLING MARKET SIZE, BY PAYMENT MODE, 2018-2030 (USD MILLION)
- TABLE 77. EUROPE, MIDDLE EAST & AFRICA ONLINE GAMBLING MARKET SIZE, BY GAME, 2018-2030 (USD MILLION)
- TABLE 78. EUROPE, MIDDLE EAST & AFRICA ONLINE GAMBLING MARKET SIZE, BY DEVICE, 2018-2030 (USD MILLION)
- TABLE 79. EUROPE, MIDDLE EAST & AFRICA ONLINE GAMBLING MARKET SIZE, BY PAYMENT MODE, 2018-2030 (USD MILLION)
- TABLE 80. EUROPE, MIDDLE EAST & AFRICA ONLINE GAMBLING MARKET SIZE, BY COUNTRY, 2018-2030 (USD MILLION)
- TABLE 81. DENMARK ONLINE GAMBLING MARKET SIZE, BY GAME, 2018-2030 (USD MILLION)
- TABLE 82. DENMARK ONLINE GAMBLING MARKET SIZE, BY DEVICE, 2018-2030 (USD MILLION)
- TABLE 83. DENMARK ONLINE GAMBLING MARKET SIZE, BY PAYMENT MODE, 2018-2030 (USD MILLION)
- TABLE 84. EGYPT ONLINE GAMBLING MARKET SIZE, BY GAME, 2018-2030 (USD MILLION)
- TABLE 85. EGYPT ONLINE GAMBLING MARKET SIZE, BY DEVICE, 2018-2030 (USD MILLION)
- TABLE 86. EGYPT ONLINE GAMBLING MARKET SIZE, BY PAYMENT MODE, 2018-2030 (USD MILLION)
- TABLE 87. FINLAND ONLINE GAMBLING MARKET SIZE, BY GAME, 2018-2030 (USD MILLION)
- TABLE 88. FINLAND ONLINE GAMBLING MARKET SIZE, BY DEVICE, 2018-2030 (USD MILLION)
- TABLE 89. FINLAND ONLINE GAMBLING MARKET SIZE, BY PAYMENT MODE, 2018-2030 (USD MILLION)
- TABLE 90. FRANCE ONLINE GAMBLING MARKET SIZE, BY GAME, 2018-2030 (USD MILLION)
- TABLE 91. FRANCE ONLINE GAMBLING MARKET SIZE, BY DEVICE, 2018-2030 (USD MILLION)
- TABLE 92. FRANCE ONLINE GAMBLING MARKET SIZE, BY PAYMENT MODE, 2018-2030 (USD MILLION)
- TABLE 93. GERMANY ONLINE GAMBLING MARKET SIZE, BY GAME, 2018-2030 (USD MILLION)
- TABLE 94. GERMANY ONLINE GAMBLING MARKET SIZE, BY DEVICE, 2018-2030 (USD MILLION)
- TABLE 95. GERMANY ONLINE GAMBLING MARKET SIZE, BY PAYMENT MODE, 2018-2030 (USD MILLION)
- TABLE 96. ISRAEL ONLINE GAMBLING MARKET SIZE, BY GAME, 2018-2030 (USD MILLION)
- TABLE 97. ISRAEL ONLINE GAMBLING MARKET SIZE, BY DEVICE, 2018-2030 (USD MILLION)
- TABLE 98. ISRAEL ONLINE GAMBLING MARKET SIZE, BY PAYMENT MODE, 2018-2030 (USD MILLION)
- TABLE 99. ITALY ONLINE GAMBLING MARKET SIZE, BY GAME, 2018-2030 (USD MILLION)
- TABLE 100. ITALY ONLINE GAMBLING MARKET SIZE, BY DEVICE, 2018-2030 (USD MILLION)
- TABLE 101. ITALY ONLINE GAMBLING MARKET SIZE, BY PAYMENT MODE, 2018-2030 (USD MILLION)
- TABLE 102. NETHERLANDS ONLINE GAMBLING MARKET SIZE, BY GAME, 2018-2030 (USD MILLION)
- TABLE 103. NETHERLANDS ONLINE GAMBLING MARKET SIZE, BY DEVICE, 2018-2030 (USD MILLION)
- TABLE 104. NETHERLANDS ONLINE GAMBLING MARKET SIZE, BY PAYMENT MODE, 2018-2030 (USD MILLION)
- TABLE 105. NIGERIA ONLINE GAMBLING MARKET SIZE, BY GAME, 2018-2030 (USD MILLION)
- TABLE 106. NIGERIA ONLINE GAMBLING MARKET SIZE, BY DEVICE, 2018-2030 (USD MILLION)
- TABLE 107. NIGERIA ONLINE GAMBLING MARKET SIZE, BY PAYMENT MODE, 2018-2030 (USD MILLION)
- TABLE 108. NORWAY ONLINE GAMBLING MARKET SIZE, BY GAME, 2018-2030 (USD MILLION)
- TABLE 109. NORWAY ONLINE GAMBLING MARKET SIZE, BY DEVICE, 2018-2030 (USD MILLION)
- TABLE 110. NORWAY ONLINE GAMBLING MARKET SIZE, BY PAYMENT MODE, 2018-2030 (USD MILLION)
- TABLE 111. POLAND ONLINE GAMBLING MARKET SIZE, BY GAME, 2018-2030 (USD MILLION)
- TABLE 112. POLAND ONLINE GAMBLING MARKET SIZE, BY DEVICE, 2018-2030 (USD MILLION)
- TABLE 113. POLAND ONLINE GAMBLING MARKET SIZE, BY PAYMENT MODE, 2018-2030 (USD MILLION)
- TABLE 114. QATAR ONLINE GAMBLING MARKET SIZE, BY GAME, 2018-2030 (USD MILLION)
- TABLE 115. QATAR ONLINE GAMBLING MARKET SIZE, BY DEVICE, 2018-2030 (USD MILLION)
- TABLE 116. QATAR ONLINE GAMBLING MARKET SIZE, BY PAYMENT MODE, 2018-2030 (USD MILLION)
- TABLE 117. RUSSIA ONLINE GAMBLING MARKET SIZE, BY GAME, 2018-2030 (USD MILLION)
- TABLE 118. RUSSIA ONLINE GAMBLING MARKET SIZE, BY DEVICE, 2018-2030 (USD MILLION)
- TABLE 119. RUSSIA ONLINE GAMBLING MARKET SIZE, BY PAYMENT MODE, 2018-2030 (USD MILLION)
- TABLE 120. SAUDI ARABIA ONLINE GAMBLING MARKET SIZE, BY GAME, 2018-2030 (USD MILLION)
- TABLE 121. SAUDI ARABIA ONLINE GAMBLING MARKET SIZE, BY DEVICE, 2018-2030 (USD MILLION)
- TABLE 122. SAUDI ARABIA ONLINE GAMBLING MARKET SIZE, BY PAYMENT MODE, 2018-2030 (USD MILLION)
- TABLE 123. SOUTH AFRICA ONLINE GAMBLING MARKET SIZE, BY GAME, 2018-2030 (USD MILLION)
- TABLE 124. SOUTH AFRICA ONLINE GAMBLING MARKET SIZE, BY DEVICE, 2018-2030 (USD MILLION)
- TABLE 125. SOUTH AFRICA ONLINE GAMBLING MARKET SIZE, BY PAYMENT MODE, 2018-2030 (USD MILLION)
- TABLE 126. SPAIN ONLINE GAMBLING MARKET SIZE, BY GAME, 2018-2030 (USD MILLION)
- TABLE 127. SPAIN ONLINE GAMBLING MARKET SIZE, BY DEVICE, 2018-2030 (USD MILLION)
- TABLE 128. SPAIN ONLINE GAMBLING MARKET SIZE, BY PAYMENT MODE, 2018-2030 (USD MILLION)
- TABLE 129. SWEDEN ONLINE GAMBLING MARKET SIZE, BY GAME, 2018-2030 (USD MILLION)
- TABLE 130. SWEDEN ONLINE GAMBLING MARKET SIZE, BY DEVICE, 2018-2030 (USD MILLION)
- TABLE 131. SWEDEN ONLINE GAMBLING MARKET SIZE, BY PAYMENT MODE, 2018-2030 (USD MILLION)
- TABLE 132. SWITZERLAND ONLINE GAMBLING MARKET SIZE, BY GAME, 2018-2030 (USD MILLION)
- TABLE 133. SWITZERLAND ONLINE GAMBLING MARKET SIZE, BY DEVICE, 2018-2030 (USD MILLION)
- TABLE 134. SWITZERLAND ONLINE GAMBLING MARKET SIZE, BY PAYMENT MODE, 2018-2030 (USD MILLION)
- TABLE 135. TURKEY ONLINE GAMBLING MARKET SIZE, BY GAME, 2018-2030 (USD MILLION)
- TABLE 136. TURKEY ONLINE GAMBLING MARKET SIZE, BY DEVICE, 2018-2030 (USD MILLION)
- TABLE 137. TURKEY ONLINE GAMBLING MARKET SIZE, BY PAYMENT MODE, 2018-2030 (USD MILLION)
- TABLE 138. UNITED ARAB EMIRATES ONLINE GAMBLING MARKET SIZE, BY GAME, 2018-2030 (USD MILLION)
- TABLE 139. UNITED ARAB EMIRATES ONLINE GAMBLING MARKET SIZE, BY DEVICE, 2018-2030 (USD MILLION)
- TABLE 140. UNITED ARAB EMIRATES ONLINE GAMBLING MARKET SIZE, BY PAYMENT MODE, 2018-2030 (USD MILLION)
- TABLE 141. UNITED KINGDOM ONLINE GAMBLING MARKET SIZE, BY GAME, 2018-2030 (USD MILLION)
- TABLE 142. UNITED KINGDOM ONLINE GAMBLING MARKET SIZE, BY DEVICE, 2018-2030 (USD MILLION)
- TABLE 143. UNITED KINGDOM ONLINE GAMBLING MARKET SIZE, BY PAYMENT MODE, 2018-2030 (USD MILLION)
- TABLE 144. ONLINE GAMBLING MARKET, FPNV POSITIONING MATRIX, 2022
- TABLE 145. ONLINE GAMBLING MARKET SHARE, BY KEY PLAYER, 2022
- TABLE 146. ONLINE GAMBLING MARKET LICENSE & PRICING
 2024 年線上博弈世界市場報告
 2024-2032 年按遊戲類型(體育博彩、賭場等)、設備(桌上型電腦、行動裝置等)和地區分類的線上博彩市場報告
 2024-2028 年全球線上博弈市場
 VR 賭博市場:賭博遊戲的類型、與虛擬實境的整合、平台 - 2023-2030 年全球預測
 VR 賭博的全球市場
 行動·賭博的全球市場
 線上·賭博&投注的全球市場
 在線博彩:全球展望和預測 (2023-2028)
 在線博彩市場規模,份額,趨勢分析報告,按類型(體育博彩,賭場,撲克,賓果),設備(桌面,移動),地區(北美,歐洲,亞太地區,拉丁美洲,MEA)和預測細分市場,2023-2030
 在線博彩市場 - 增長、趨勢和預測 (2023-2028)