


 |
市場調查報告書
商品編碼
1434314
農業潤滑油市場:按類型、應用分類 - 2024-2030 年全球預測Agricultural Lubricants Market by Type (Bio-based, Mineral Oil, Synthetic), Application (Engines, Gears & Transmission, Greasing) - Global Forecast 2024-2030 |
||||||
※ 本網頁內容可能與最新版本有所差異。詳細情況請與我們聯繫。
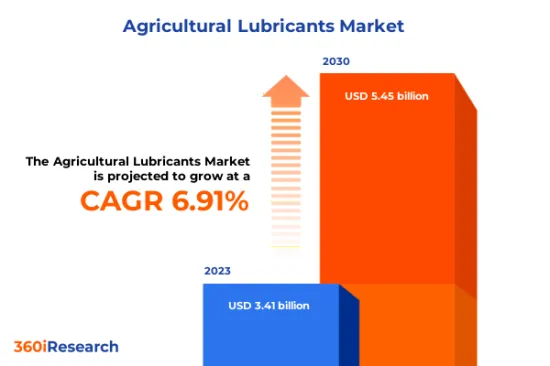
預計2023年農用潤滑油市場規模為34.1億美元,預計2024年將達36.4億美元,2030年將達54.5億美元,複合年成長率為6.91%。
全球農用潤滑油市場
| 主要市場統計 | |
|---|---|
| 基準年[2023] | 34.1億美元 |
| 預測年份 [2024] | 36.4億美元 |
| 預測年份 [2030] | 54.5億美元 |
| 複合年成長率(%) | 6.91% |
FPNV定位矩陣
FPNV定位矩陣對於評估農業潤滑油市場至關重要。我們檢視與業務策略和產品滿意度相關的關鍵指標,以對供應商進行全面評估。這種深入的分析使用戶能夠根據自己的要求做出明智的決策。根據評估,供應商被分為四個成功程度不同的像限:前沿(F)、探路者(P)、利基(N)和重要(V)。
市場佔有率分析
市場佔有率分析是一種綜合工具,可以對農用潤滑油市場供應商的現狀進行深入而詳細的研究。全面比較和分析供應商在整體收益、基本客群和其他關鍵指標方面的貢獻,以便更好地了解公司的績效及其在爭奪市場佔有率時面臨的挑戰。此外,該分析還提供了對該行業競爭特徵的寶貴見解,包括在研究基準年觀察到的累積、分散主導地位和合併特徵等因素。這種詳細程度的提高使供應商能夠做出更明智的決策並制定有效的策略,從而在市場上獲得競爭優勢。
該報告對以下幾個方面提供了寶貴的見解:
1-市場滲透率:提供有關主要企業所服務的市場的全面資訊。
2-市場開拓:我們深入研究利潤豐厚的新興市場,並分析它們在成熟細分市場中的滲透率。
3- 市場多元化:提供有關新產品發布、開拓地區、最新發展和投資的詳細資訊。
4-競爭力評估與資訊:對主要企業的市場佔有率、策略、產品、認證、監管狀況、專利狀況、製造能力等進行全面評估。
5- 產品開發與創新:提供對未來技術、研發活動和突破性產品開發的見解。
本報告解決了以下關鍵問題:
1-農用潤滑油市場規模及預測是多少?
2-在農業潤滑油市場的預測期內,有哪些產品、細分市場、應用和領域需要考慮投資?
3-農用潤滑油市場的技術趨勢和法律規範是什麼?
4-農用潤滑油市場主要供應商的市場佔有率是多少?
5-進入農用潤滑油市場合適的型態和策略手段是什麼?
目錄
第1章 前言
第2章調查方法
第3章執行摘要
第4章市場概況
第5章市場洞察
- 市場動態
- 促進因素
- 人事費用增加,農業勞動力供給減少
- 農業機械政府補貼
- 世界人口的快速成長增加了提高糧食生產力的需求
- 抑制因素
- 新興國家的農民收入較低。
- 機會
- 中國和印度農業機械化規模龐大
- 農民對先進農業機械的使用持懷疑態度
- 任務
- 原油價格波動對農用潤滑油產業構成挑戰
- 促進因素
- 市場區隔分析
- 市場趨勢分析
- 高通膨的累積效應
- 波特五力分析
- 價值鍊和關鍵路徑分析
- 法律規範
第6章農用潤滑油市場:依類型
- 生物基
- 礦物油
- 合成
第7章農用潤滑油市場:依應用分類
- 引擎
- 齒輪及傳動裝置
- 潤滑脂
- 油壓
- 用具
第8章美洲農用潤滑油市場
- 阿根廷
- 巴西
- 加拿大
- 墨西哥
- 美國
第9章亞太地區農業潤滑油市場
- 澳洲
- 中國
- 印度
- 印尼
- 日本
- 馬來西亞
- 菲律賓
- 新加坡
- 韓國
- 台灣
- 泰國
- 越南
第10章歐洲、中東和非洲農業潤滑油市場
- 丹麥
- 埃及
- 芬蘭
- 法國
- 德國
- 以色列
- 義大利
- 荷蘭
- 奈及利亞
- 挪威
- 波蘭
- 卡達
- 俄羅斯
- 沙烏地阿拉伯
- 南非
- 西班牙
- 瑞典
- 瑞士
- 土耳其
- 阿拉伯聯合大公國
- 英國
第11章競爭形勢
- FPNV定位矩陣
- 市場佔有率分析:主要企業
- 主要企業競爭情境分析
第12章競爭產品組合
- 主要公司簡介
- Castrol Limited
- Chevron Corporation
- CHS Inc
- Condat Group
- Cougar Lubricants International Ltd
- Exol Lubricants Limited
- Exxon Mobil Corporation
- Frontier Performance Lubricants, Inc.
- Fuchs Petrolub SE
- Gulf Oil International Ltd
- International Products Corporation
- Kuwait Petroleum NV
- Lubrita Europe BV
- Midlands Lubricants Ltd.
- MOL Group
- Oscar Lubricants LLC
- Pennine Lubricants Limited
- PETRONAS Lubricants International Sdn. Bhd.
- Repsol Group
- Rix Petroleum Limited
- Rizol Petro Products Pvt. Ltd.
- Royal Dutch Shell PLC
- Rymax BV
- Schaeffer Manufacturing Co.
- SGS Societe Generale de Surveillance SA
- Smith and Allan Ltd.
- The Phillips 66 Group of Companies
- Valvoline Inc.
- 主要產品系列
第13章附錄
- 討論指南
- 關於許可證和定價
[197 Pages Report] The Agricultural Lubricants Market size was estimated at USD 3.41 billion in 2023 and expected to reach USD 3.64 billion in 2024, at a CAGR 6.91% to reach USD 5.45 billion by 2030.
Global Agricultural Lubricants Market
| KEY MARKET STATISTICS | |
|---|---|
| Base Year [2023] | USD 3.41 billion |
| Estimated Year [2024] | USD 3.64 billion |
| Forecast Year [2030] | USD 5.45 billion |
| CAGR (%) | 6.91% |
FPNV Positioning Matrix
The FPNV Positioning Matrix is pivotal in evaluating the Agricultural Lubricants Market. It offers a comprehensive assessment of vendors, examining key metrics related to Business Strategy and Product Satisfaction. This in-depth analysis empowers users to make well-informed decisions aligned with their requirements. Based on the evaluation, the vendors are then categorized into four distinct quadrants representing varying levels of success: Forefront (F), Pathfinder (P), Niche (N), or Vital (V).
Market Share Analysis
The Market Share Analysis is a comprehensive tool that provides an insightful and in-depth examination of the current state of vendors in the Agricultural Lubricants Market. By meticulously comparing and analyzing vendor contributions in terms of overall revenue, customer base, and other key metrics, we can offer companies a greater understanding of their performance and the challenges they face when competing for market share. Additionally, this analysis provides valuable insights into the competitive nature of the sector, including factors such as accumulation, fragmentation dominance, and amalgamation traits observed over the base year period studied. With this expanded level of detail, vendors can make more informed decisions and devise effective strategies to gain a competitive edge in the market.
Key Company Profiles
The report delves into recent significant developments in the Agricultural Lubricants Market, highlighting leading vendors and their innovative profiles. These include Castrol Limited, Chevron Corporation, CHS Inc, Condat Group, Cougar Lubricants International Ltd, Exol Lubricants Limited, Exxon Mobil Corporation, Frontier Performance Lubricants, Inc., Fuchs Petrolub SE, Gulf Oil International Ltd, International Products Corporation, Kuwait Petroleum N.V., Lubrita Europe B.V., Midlands Lubricants Ltd., MOL Group, Oscar Lubricants LLC, Pennine Lubricants Limited, PETRONAS Lubricants International Sdn. Bhd., Repsol Group, Rix Petroleum Limited, Rizol Petro Products Pvt. Ltd., Royal Dutch Shell PLC, Rymax B.V., Schaeffer Manufacturing Co., SGS Societe Generale de Surveillance SA, Smith and Allan Ltd., The Phillips 66 Group of Companies, and Valvoline Inc..
Market Segmentation & Coverage
This research report categorizes the Agricultural Lubricants Market to forecast the revenues and analyze trends in each of the following sub-markets:
- Type
- Bio-based
- Mineral Oil
- Synthetic
- Application
- Engines
- Gears & Transmission
- Greasing
- Hydraulics
- Implements
- Region
- Americas
- Argentina
- Brazil
- Canada
- Mexico
- United States
- California
- Florida
- Illinois
- New York
- Ohio
- Pennsylvania
- Texas
- Asia-Pacific
- Australia
- China
- India
- Indonesia
- Japan
- Malaysia
- Philippines
- Singapore
- South Korea
- Taiwan
- Thailand
- Vietnam
- Europe, Middle East & Africa
- Denmark
- Egypt
- Finland
- France
- Germany
- Israel
- Italy
- Netherlands
- Nigeria
- Norway
- Poland
- Qatar
- Russia
- Saudi Arabia
- South Africa
- Spain
- Sweden
- Switzerland
- Turkey
- United Arab Emirates
- United Kingdom
- Americas
The report offers valuable insights on the following aspects:
1. Market Penetration: It presents comprehensive information on the market provided by key players.
2. Market Development: It delves deep into lucrative emerging markets and analyzes the penetration across mature market segments.
3. Market Diversification: It provides detailed information on new product launches, untapped geographic regions, recent developments, and investments.
4. Competitive Assessment & Intelligence: It conducts an exhaustive assessment of market shares, strategies, products, certifications, regulatory approvals, patent landscape, and manufacturing capabilities of the leading players.
5. Product Development & Innovation: It offers intelligent insights on future technologies, R&D activities, and breakthrough product developments.
The report addresses key questions such as:
1. What is the market size and forecast of the Agricultural Lubricants Market?
2. Which products, segments, applications, and areas should one consider investing in over the forecast period in the Agricultural Lubricants Market?
3. What are the technology trends and regulatory frameworks in the Agricultural Lubricants Market?
4. What is the market share of the leading vendors in the Agricultural Lubricants Market?
5. Which modes and strategic moves are suitable for entering the Agricultural Lubricants Market?
Table of Contents
1. Preface
- 1.1. Objectives of the Study
- 1.2. Market Segmentation & Coverage
- 1.3. Years Considered for the Study
- 1.4. Currency & Pricing
- 1.5. Language
- 1.6. Limitations
- 1.7. Assumptions
- 1.8. Stakeholders
2. Research Methodology
- 2.1. Define: Research Objective
- 2.2. Determine: Research Design
- 2.3. Prepare: Research Instrument
- 2.4. Collect: Data Source
- 2.5. Analyze: Data Interpretation
- 2.6. Formulate: Data Verification
- 2.7. Publish: Research Report
- 2.8. Repeat: Report Update
3. Executive Summary
4. Market Overview
- 4.1. Introduction
- 4.2. Agricultural Lubricants Market, by Region
5. Market Insights
- 5.1. Market Dynamics
- 5.1.1. Drivers
- 5.1.1.1. Increasing labor cost and decreasing availability of agricultural labor
- 5.1.1.2. Government subsidies for agricultural equipment
- 5.1.1.3. Rising need to elevate food productivity attributed to surging global population
- 5.1.2. Restraints
- 5.1.2.1. Low income of farmers in developing countries
- 5.1.3. Opportunities
- 5.1.3.1. Substantial scope for farm mechanization in China and India
- 5.1.3.2. Skepticism among farmers for using advanced agricultural equipment
- 5.1.4. Challenges
- 5.1.4.1. Volatile crude oil prices acts as a challenge for agricultural lubricants industry
- 5.1.1. Drivers
- 5.2. Market Segmentation Analysis
- 5.3. Market Trend Analysis
- 5.4. Cumulative Impact of High Inflation
- 5.5. Porter's Five Forces Analysis
- 5.5.1. Threat of New Entrants
- 5.5.2. Threat of Substitutes
- 5.5.3. Bargaining Power of Customers
- 5.5.4. Bargaining Power of Suppliers
- 5.5.5. Industry Rivalry
- 5.6. Value Chain & Critical Path Analysis
- 5.7. Regulatory Framework
6. Agricultural Lubricants Market, by Type
- 6.1. Introduction
- 6.2. Bio-based
- 6.3. Mineral Oil
- 6.4. Synthetic
7. Agricultural Lubricants Market, by Application
- 7.1. Introduction
- 7.2. Engines
- 7.3. Gears & Transmission
- 7.4. Greasing
- 7.5. Hydraulics
- 7.6. Implements
8. Americas Agricultural Lubricants Market
- 8.1. Introduction
- 8.2. Argentina
- 8.3. Brazil
- 8.4. Canada
- 8.5. Mexico
- 8.6. United States
9. Asia-Pacific Agricultural Lubricants Market
- 9.1. Introduction
- 9.2. Australia
- 9.3. China
- 9.4. India
- 9.5. Indonesia
- 9.6. Japan
- 9.7. Malaysia
- 9.8. Philippines
- 9.9. Singapore
- 9.10. South Korea
- 9.11. Taiwan
- 9.12. Thailand
- 9.13. Vietnam
10. Europe, Middle East & Africa Agricultural Lubricants Market
- 10.1. Introduction
- 10.2. Denmark
- 10.3. Egypt
- 10.4. Finland
- 10.5. France
- 10.6. Germany
- 10.7. Israel
- 10.8. Italy
- 10.9. Netherlands
- 10.10. Nigeria
- 10.11. Norway
- 10.12. Poland
- 10.13. Qatar
- 10.14. Russia
- 10.15. Saudi Arabia
- 10.16. South Africa
- 10.17. Spain
- 10.18. Sweden
- 10.19. Switzerland
- 10.20. Turkey
- 10.21. United Arab Emirates
- 10.22. United Kingdom
11. Competitive Landscape
- 11.1. FPNV Positioning Matrix
- 11.2. Market Share Analysis, By Key Player
- 11.3. Competitive Scenario Analysis, By Key Player
12. Competitive Portfolio
- 12.1. Key Company Profiles
- 12.1.1. Castrol Limited
- 12.1.2. Chevron Corporation
- 12.1.3. CHS Inc
- 12.1.4. Condat Group
- 12.1.5. Cougar Lubricants International Ltd
- 12.1.6. Exol Lubricants Limited
- 12.1.7. Exxon Mobil Corporation
- 12.1.8. Frontier Performance Lubricants, Inc.
- 12.1.9. Fuchs Petrolub SE
- 12.1.10. Gulf Oil International Ltd
- 12.1.11. International Products Corporation
- 12.1.12. Kuwait Petroleum N.V.
- 12.1.13. Lubrita Europe B.V.
- 12.1.14. Midlands Lubricants Ltd.
- 12.1.15. MOL Group
- 12.1.16. Oscar Lubricants LLC
- 12.1.17. Pennine Lubricants Limited
- 12.1.18. PETRONAS Lubricants International Sdn. Bhd.
- 12.1.19. Repsol Group
- 12.1.20. Rix Petroleum Limited
- 12.1.21. Rizol Petro Products Pvt. Ltd.
- 12.1.22. Royal Dutch Shell PLC
- 12.1.23. Rymax B.V.
- 12.1.24. Schaeffer Manufacturing Co.
- 12.1.25. SGS Societe Generale de Surveillance SA
- 12.1.26. Smith and Allan Ltd.
- 12.1.27. The Phillips 66 Group of Companies
- 12.1.28. Valvoline Inc.
- 12.2. Key Product Portfolio
13. Appendix
- 13.1. Discussion Guide
- 13.2. License & Pricing
LIST OF FIGURES
- FIGURE 1. AGRICULTURAL LUBRICANTS MARKET RESEARCH PROCESS
- FIGURE 2. AGRICULTURAL LUBRICANTS MARKET SIZE, 2023 VS 2030
- FIGURE 3. AGRICULTURAL LUBRICANTS MARKET SIZE, 2018-2030 (USD MILLION)
- FIGURE 4. AGRICULTURAL LUBRICANTS MARKET SIZE, BY REGION, 2023 VS 2030 (%)
- FIGURE 5. AGRICULTURAL LUBRICANTS MARKET SIZE, BY REGION, 2023 VS 2024 VS 2030 (USD MILLION)
- FIGURE 6. AGRICULTURAL LUBRICANTS MARKET DYNAMICS
- FIGURE 7. AGRICULTURAL LUBRICANTS MARKET SIZE, BY TYPE, 2023 VS 2030 (%)
- FIGURE 8. AGRICULTURAL LUBRICANTS MARKET SIZE, BY TYPE, 2023 VS 2024 VS 2030 (USD MILLION)
- FIGURE 9. AGRICULTURAL LUBRICANTS MARKET SIZE, BY APPLICATION, 2023 VS 2030 (%)
- FIGURE 10. AGRICULTURAL LUBRICANTS MARKET SIZE, BY APPLICATION, 2023 VS 2024 VS 2030 (USD MILLION)
- FIGURE 11. AMERICAS AGRICULTURAL LUBRICANTS MARKET SIZE, BY COUNTRY, 2023 VS 2030 (%)
- FIGURE 12. AMERICAS AGRICULTURAL LUBRICANTS MARKET SIZE, BY COUNTRY, 2023 VS 2024 VS 2030 (USD MILLION)
- FIGURE 13. UNITED STATES AGRICULTURAL LUBRICANTS MARKET SIZE, BY STATE, 2023 VS 2030 (%)
- FIGURE 14. UNITED STATES AGRICULTURAL LUBRICANTS MARKET SIZE, BY STATE, 2023 VS 2024 VS 2030 (USD MILLION)
- FIGURE 15. ASIA-PACIFIC AGRICULTURAL LUBRICANTS MARKET SIZE, BY COUNTRY, 2023 VS 2030 (%)
- FIGURE 16. ASIA-PACIFIC AGRICULTURAL LUBRICANTS MARKET SIZE, BY COUNTRY, 2023 VS 2024 VS 2030 (USD MILLION)
- FIGURE 17. EUROPE, MIDDLE EAST & AFRICA AGRICULTURAL LUBRICANTS MARKET SIZE, BY COUNTRY, 2023 VS 2030 (%)
- FIGURE 18. EUROPE, MIDDLE EAST & AFRICA AGRICULTURAL LUBRICANTS MARKET SIZE, BY COUNTRY, 2023 VS 2024 VS 2030 (USD MILLION)
- FIGURE 19. AGRICULTURAL LUBRICANTS MARKET, FPNV POSITIONING MATRIX, 2023
- FIGURE 20. AGRICULTURAL LUBRICANTS MARKET SHARE, BY KEY PLAYER, 2023
LIST OF TABLES
- TABLE 1. AGRICULTURAL LUBRICANTS MARKET SEGMENTATION & COVERAGE
- TABLE 2. UNITED STATES DOLLAR EXCHANGE RATE, 2018-2023
- TABLE 3. AGRICULTURAL LUBRICANTS MARKET SIZE, 2018-2030 (USD MILLION)
- TABLE 4. GLOBAL AGRICULTURAL LUBRICANTS MARKET SIZE, BY REGION, 2018-2030 (USD MILLION)
- TABLE 5. AGRICULTURAL LUBRICANTS MARKET SIZE, BY TYPE, 2018-2030 (USD MILLION)
- TABLE 6. AGRICULTURAL LUBRICANTS MARKET SIZE, BY BIO-BASED, BY REGION, 2018-2030 (USD MILLION)
- TABLE 7. AGRICULTURAL LUBRICANTS MARKET SIZE, BY MINERAL OIL, BY REGION, 2018-2030 (USD MILLION)
- TABLE 8. AGRICULTURAL LUBRICANTS MARKET SIZE, BY SYNTHETIC, BY REGION, 2018-2030 (USD MILLION)
- TABLE 9. AGRICULTURAL LUBRICANTS MARKET SIZE, BY APPLICATION, 2018-2030 (USD MILLION)
- TABLE 10. AGRICULTURAL LUBRICANTS MARKET SIZE, BY ENGINES, BY REGION, 2018-2030 (USD MILLION)
- TABLE 11. AGRICULTURAL LUBRICANTS MARKET SIZE, BY GEARS & TRANSMISSION, BY REGION, 2018-2030 (USD MILLION)
- TABLE 12. AGRICULTURAL LUBRICANTS MARKET SIZE, BY GREASING, BY REGION, 2018-2030 (USD MILLION)
- TABLE 13. AGRICULTURAL LUBRICANTS MARKET SIZE, BY HYDRAULICS, BY REGION, 2018-2030 (USD MILLION)
- TABLE 14. AGRICULTURAL LUBRICANTS MARKET SIZE, BY IMPLEMENTS, BY REGION, 2018-2030 (USD MILLION)
- TABLE 15. AMERICAS AGRICULTURAL LUBRICANTS MARKET SIZE, BY TYPE, 2018-2030 (USD MILLION)
- TABLE 16. AMERICAS AGRICULTURAL LUBRICANTS MARKET SIZE, BY APPLICATION, 2018-2030 (USD MILLION)
- TABLE 17. AMERICAS AGRICULTURAL LUBRICANTS MARKET SIZE, BY COUNTRY, 2018-2030 (USD MILLION)
- TABLE 18. ARGENTINA AGRICULTURAL LUBRICANTS MARKET SIZE, BY TYPE, 2018-2030 (USD MILLION)
- TABLE 19. ARGENTINA AGRICULTURAL LUBRICANTS MARKET SIZE, BY APPLICATION, 2018-2030 (USD MILLION)
- TABLE 20. BRAZIL AGRICULTURAL LUBRICANTS MARKET SIZE, BY TYPE, 2018-2030 (USD MILLION)
- TABLE 21. BRAZIL AGRICULTURAL LUBRICANTS MARKET SIZE, BY APPLICATION, 2018-2030 (USD MILLION)
- TABLE 22. CANADA AGRICULTURAL LUBRICANTS MARKET SIZE, BY TYPE, 2018-2030 (USD MILLION)
- TABLE 23. CANADA AGRICULTURAL LUBRICANTS MARKET SIZE, BY APPLICATION, 2018-2030 (USD MILLION)
- TABLE 24. MEXICO AGRICULTURAL LUBRICANTS MARKET SIZE, BY TYPE, 2018-2030 (USD MILLION)
- TABLE 25. MEXICO AGRICULTURAL LUBRICANTS MARKET SIZE, BY APPLICATION, 2018-2030 (USD MILLION)
- TABLE 26. UNITED STATES AGRICULTURAL LUBRICANTS MARKET SIZE, BY TYPE, 2018-2030 (USD MILLION)
- TABLE 27. UNITED STATES AGRICULTURAL LUBRICANTS MARKET SIZE, BY APPLICATION, 2018-2030 (USD MILLION)
- TABLE 28. UNITED STATES AGRICULTURAL LUBRICANTS MARKET SIZE, BY STATE, 2018-2030 (USD MILLION)
- TABLE 29. ASIA-PACIFIC AGRICULTURAL LUBRICANTS MARKET SIZE, BY TYPE, 2018-2030 (USD MILLION)
- TABLE 30. ASIA-PACIFIC AGRICULTURAL LUBRICANTS MARKET SIZE, BY APPLICATION, 2018-2030 (USD MILLION)
- TABLE 31. ASIA-PACIFIC AGRICULTURAL LUBRICANTS MARKET SIZE, BY COUNTRY, 2018-2030 (USD MILLION)
- TABLE 32. AUSTRALIA AGRICULTURAL LUBRICANTS MARKET SIZE, BY TYPE, 2018-2030 (USD MILLION)
- TABLE 33. AUSTRALIA AGRICULTURAL LUBRICANTS MARKET SIZE, BY APPLICATION, 2018-2030 (USD MILLION)
- TABLE 34. CHINA AGRICULTURAL LUBRICANTS MARKET SIZE, BY TYPE, 2018-2030 (USD MILLION)
- TABLE 35. CHINA AGRICULTURAL LUBRICANTS MARKET SIZE, BY APPLICATION, 2018-2030 (USD MILLION)
- TABLE 36. INDIA AGRICULTURAL LUBRICANTS MARKET SIZE, BY TYPE, 2018-2030 (USD MILLION)
- TABLE 37. INDIA AGRICULTURAL LUBRICANTS MARKET SIZE, BY APPLICATION, 2018-2030 (USD MILLION)
- TABLE 38. INDONESIA AGRICULTURAL LUBRICANTS MARKET SIZE, BY TYPE, 2018-2030 (USD MILLION)
- TABLE 39. INDONESIA AGRICULTURAL LUBRICANTS MARKET SIZE, BY APPLICATION, 2018-2030 (USD MILLION)
- TABLE 40. JAPAN AGRICULTURAL LUBRICANTS MARKET SIZE, BY TYPE, 2018-2030 (USD MILLION)
- TABLE 41. JAPAN AGRICULTURAL LUBRICANTS MARKET SIZE, BY APPLICATION, 2018-2030 (USD MILLION)
- TABLE 42. MALAYSIA AGRICULTURAL LUBRICANTS MARKET SIZE, BY TYPE, 2018-2030 (USD MILLION)
- TABLE 43. MALAYSIA AGRICULTURAL LUBRICANTS MARKET SIZE, BY APPLICATION, 2018-2030 (USD MILLION)
- TABLE 44. PHILIPPINES AGRICULTURAL LUBRICANTS MARKET SIZE, BY TYPE, 2018-2030 (USD MILLION)
- TABLE 45. PHILIPPINES AGRICULTURAL LUBRICANTS MARKET SIZE, BY APPLICATION, 2018-2030 (USD MILLION)
- TABLE 46. SINGAPORE AGRICULTURAL LUBRICANTS MARKET SIZE, BY TYPE, 2018-2030 (USD MILLION)
- TABLE 47. SINGAPORE AGRICULTURAL LUBRICANTS MARKET SIZE, BY APPLICATION, 2018-2030 (USD MILLION)
- TABLE 48. SOUTH KOREA AGRICULTURAL LUBRICANTS MARKET SIZE, BY TYPE, 2018-2030 (USD MILLION)
- TABLE 49. SOUTH KOREA AGRICULTURAL LUBRICANTS MARKET SIZE, BY APPLICATION, 2018-2030 (USD MILLION)
- TABLE 50. TAIWAN AGRICULTURAL LUBRICANTS MARKET SIZE, BY TYPE, 2018-2030 (USD MILLION)
- TABLE 51. TAIWAN AGRICULTURAL LUBRICANTS MARKET SIZE, BY APPLICATION, 2018-2030 (USD MILLION)
- TABLE 52. THAILAND AGRICULTURAL LUBRICANTS MARKET SIZE, BY TYPE, 2018-2030 (USD MILLION)
- TABLE 53. THAILAND AGRICULTURAL LUBRICANTS MARKET SIZE, BY APPLICATION, 2018-2030 (USD MILLION)
- TABLE 54. VIETNAM AGRICULTURAL LUBRICANTS MARKET SIZE, BY TYPE, 2018-2030 (USD MILLION)
- TABLE 55. VIETNAM AGRICULTURAL LUBRICANTS MARKET SIZE, BY APPLICATION, 2018-2030 (USD MILLION)
- TABLE 56. EUROPE, MIDDLE EAST & AFRICA AGRICULTURAL LUBRICANTS MARKET SIZE, BY TYPE, 2018-2030 (USD MILLION)
- TABLE 57. EUROPE, MIDDLE EAST & AFRICA AGRICULTURAL LUBRICANTS MARKET SIZE, BY APPLICATION, 2018-2030 (USD MILLION)
- TABLE 58. EUROPE, MIDDLE EAST & AFRICA AGRICULTURAL LUBRICANTS MARKET SIZE, BY COUNTRY, 2018-2030 (USD MILLION)
- TABLE 59. DENMARK AGRICULTURAL LUBRICANTS MARKET SIZE, BY TYPE, 2018-2030 (USD MILLION)
- TABLE 60. DENMARK AGRICULTURAL LUBRICANTS MARKET SIZE, BY APPLICATION, 2018-2030 (USD MILLION)
- TABLE 61. EGYPT AGRICULTURAL LUBRICANTS MARKET SIZE, BY TYPE, 2018-2030 (USD MILLION)
- TABLE 62. EGYPT AGRICULTURAL LUBRICANTS MARKET SIZE, BY APPLICATION, 2018-2030 (USD MILLION)
- TABLE 63. FINLAND AGRICULTURAL LUBRICANTS MARKET SIZE, BY TYPE, 2018-2030 (USD MILLION)
- TABLE 64. FINLAND AGRICULTURAL LUBRICANTS MARKET SIZE, BY APPLICATION, 2018-2030 (USD MILLION)
- TABLE 65. FRANCE AGRICULTURAL LUBRICANTS MARKET SIZE, BY TYPE, 2018-2030 (USD MILLION)
- TABLE 66. FRANCE AGRICULTURAL LUBRICANTS MARKET SIZE, BY APPLICATION, 2018-2030 (USD MILLION)
- TABLE 67. GERMANY AGRICULTURAL LUBRICANTS MARKET SIZE, BY TYPE, 2018-2030 (USD MILLION)
- TABLE 68. GERMANY AGRICULTURAL LUBRICANTS MARKET SIZE, BY APPLICATION, 2018-2030 (USD MILLION)
- TABLE 69. ISRAEL AGRICULTURAL LUBRICANTS MARKET SIZE, BY TYPE, 2018-2030 (USD MILLION)
- TABLE 70. ISRAEL AGRICULTURAL LUBRICANTS MARKET SIZE, BY APPLICATION, 2018-2030 (USD MILLION)
- TABLE 71. ITALY AGRICULTURAL LUBRICANTS MARKET SIZE, BY TYPE, 2018-2030 (USD MILLION)
- TABLE 72. ITALY AGRICULTURAL LUBRICANTS MARKET SIZE, BY APPLICATION, 2018-2030 (USD MILLION)
- TABLE 73. NETHERLANDS AGRICULTURAL LUBRICANTS MARKET SIZE, BY TYPE, 2018-2030 (USD MILLION)
- TABLE 74. NETHERLANDS AGRICULTURAL LUBRICANTS MARKET SIZE, BY APPLICATION, 2018-2030 (USD MILLION)
- TABLE 75. NIGERIA AGRICULTURAL LUBRICANTS MARKET SIZE, BY TYPE, 2018-2030 (USD MILLION)
- TABLE 76. NIGERIA AGRICULTURAL LUBRICANTS MARKET SIZE, BY APPLICATION, 2018-2030 (USD MILLION)
- TABLE 77. NORWAY AGRICULTURAL LUBRICANTS MARKET SIZE, BY TYPE, 2018-2030 (USD MILLION)
- TABLE 78. NORWAY AGRICULTURAL LUBRICANTS MARKET SIZE, BY APPLICATION, 2018-2030 (USD MILLION)
- TABLE 79. POLAND AGRICULTURAL LUBRICANTS MARKET SIZE, BY TYPE, 2018-2030 (USD MILLION)
- TABLE 80. POLAND AGRICULTURAL LUBRICANTS MARKET SIZE, BY APPLICATION, 2018-2030 (USD MILLION)
- TABLE 81. QATAR AGRICULTURAL LUBRICANTS MARKET SIZE, BY TYPE, 2018-2030 (USD MILLION)
- TABLE 82. QATAR AGRICULTURAL LUBRICANTS MARKET SIZE, BY APPLICATION, 2018-2030 (USD MILLION)
- TABLE 83. RUSSIA AGRICULTURAL LUBRICANTS MARKET SIZE, BY TYPE, 2018-2030 (USD MILLION)
- TABLE 84. RUSSIA AGRICULTURAL LUBRICANTS MARKET SIZE, BY APPLICATION, 2018-2030 (USD MILLION)
- TABLE 85. SAUDI ARABIA AGRICULTURAL LUBRICANTS MARKET SIZE, BY TYPE, 2018-2030 (USD MILLION)
- TABLE 86. SAUDI ARABIA AGRICULTURAL LUBRICANTS MARKET SIZE, BY APPLICATION, 2018-2030 (USD MILLION)
- TABLE 87. SOUTH AFRICA AGRICULTURAL LUBRICANTS MARKET SIZE, BY TYPE, 2018-2030 (USD MILLION)
- TABLE 88. SOUTH AFRICA AGRICULTURAL LUBRICANTS MARKET SIZE, BY APPLICATION, 2018-2030 (USD MILLION)
- TABLE 89. SPAIN AGRICULTURAL LUBRICANTS MARKET SIZE, BY TYPE, 2018-2030 (USD MILLION)
- TABLE 90. SPAIN AGRICULTURAL LUBRICANTS MARKET SIZE, BY APPLICATION, 2018-2030 (USD MILLION)
- TABLE 91. SWEDEN AGRICULTURAL LUBRICANTS MARKET SIZE, BY TYPE, 2018-2030 (USD MILLION)
- TABLE 92. SWEDEN AGRICULTURAL LUBRICANTS MARKET SIZE, BY APPLICATION, 2018-2030 (USD MILLION)
- TABLE 93. SWITZERLAND AGRICULTURAL LUBRICANTS MARKET SIZE, BY TYPE, 2018-2030 (USD MILLION)
- TABLE 94. SWITZERLAND AGRICULTURAL LUBRICANTS MARKET SIZE, BY APPLICATION, 2018-2030 (USD MILLION)
- TABLE 95. TURKEY AGRICULTURAL LUBRICANTS MARKET SIZE, BY TYPE, 2018-2030 (USD MILLION)
- TABLE 96. TURKEY AGRICULTURAL LUBRICANTS MARKET SIZE, BY APPLICATION, 2018-2030 (USD MILLION)
- TABLE 97. UNITED ARAB EMIRATES AGRICULTURAL LUBRICANTS MARKET SIZE, BY TYPE, 2018-2030 (USD MILLION)
- TABLE 98. UNITED ARAB EMIRATES AGRICULTURAL LUBRICANTS MARKET SIZE, BY APPLICATION, 2018-2030 (USD MILLION)
- TABLE 99. UNITED KINGDOM AGRICULTURAL LUBRICANTS MARKET SIZE, BY TYPE, 2018-2030 (USD MILLION)
- TABLE 100. UNITED KINGDOM AGRICULTURAL LUBRICANTS MARKET SIZE, BY APPLICATION, 2018-2030 (USD MILLION)
- TABLE 101. AGRICULTURAL LUBRICANTS MARKET, FPNV POSITIONING MATRIX, 2023
- TABLE 102. AGRICULTURAL LUBRICANTS MARKET SHARE, BY KEY PLAYER, 2023
- TABLE 103. AGRICULTURAL LUBRICANTS MARKET LICENSE & PRICING
 農業潤滑油的全球市場:依產品類型(引擎油、UTTO、冷卻劑、潤滑脂)、依類別(礦物油基、合成油基、生物基)、銷售管道、農業設備、區域 - 2028預測高達
 農用潤滑油:市場佔有率分析、產業趨勢與統計、成長預測(2024-2029)
 全球農用潤滑油市場研究報告 - 行業分析、規模、佔有率、成長、趨勢及2023年至2030年預測
 到 2028 年的農業潤滑油市場預測——按類型、農業設備、應用和地區進行的全球分析
 農業用潤滑油的全球市場(2016年~2032年)
 農業用潤滑油的全球市場
 農業用潤滑劑的世界市場規模,佔有率,成長分析:各類型,各用途 - 產業預測(2022年~2028年)
 全球農業潤滑油市場:展望與預測(2022-2027 年)