


 |
市場調查報告書
商品編碼
1434243
羊膜市場:按產品、應用和最終用戶 - 2023-2030 年全球預測Amniotic Membrane Market by Product (Cryopreserved Amniotic Membrane, Lyophilization Amniotic Membrane), Application (Ophthalmology, Surgical Wound), End User - Global Forecast 2023-2030 |
||||||
※ 本網頁內容可能與最新版本有所差異。詳細情況請與我們聯繫。
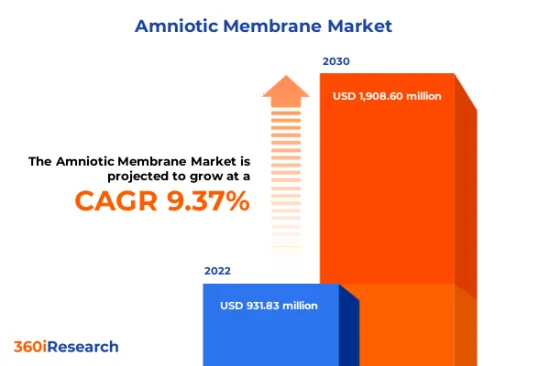
預計2022年羊膜市場規模為9,3183萬美元,2023年達10,2673萬美元,預估至2030年將達1,90,860萬美元,複合年成長率為9.37%。
全球羊膜市場
| 主要市場統計 | |
|---|---|
| 基準年[2022] | 93183萬美元 |
| 預計年份 [2023] | 10.2673 億美元 |
| 預測年份 [2030] | 19.086 億美元 |
| 複合年成長率(%) | 9.37% |
羊膜市場包括用於各種醫療應用的羊膜的生產、分銷和銷售。羊膜源自胎盤的最內層,含有獨特的細胞和細胞外基質組合,並具有再生特性,可用於各種治療實踐,特別是眼科、創傷護理和外科手術。羊膜由於其發炎、抗纖維化和抗菌特性以及支持幹細胞增殖的能力而具有多種醫學應用。然而,羊膜市場的成長面臨一些限制和挑戰因素,例如道德約束、法規和成本約束。冷凍保存和脫水產品等保存技術的進步促進了這些薄膜的儲存和運輸,延長了其可用性和保存期限。正在進行的研究正在發現羊膜的新治療用途並開拓更多市場。醫療保健專業人員和患者對羊膜產品益處的認知不斷提高,也為市場擴張創造了機會。
區域洞察
由於先進的醫療基礎設施的強大存在、醫療保健專業人員和患者的意識不斷提高以及有利的報銷政策,美洲的羊膜市場正在經歷顯著成長。美國因其完善的醫療保健體系和再生醫學領域的主要企業而成為重要市場。由於眼科和傷口護理領域的採用增加,歐洲、中東和非洲地區對羊膜的需求正在增加。歐洲市場尤其強勁,有嚴格的歐盟法規支持,確保產品品質和安全。慢性病的增加和人口老化導致了這種不斷成長的需求。由於醫療基礎設施投資增加,中東顯示出成長潛力,但與歐洲相比,市場滲透率仍處於起步階段。在非洲,由於醫療設施有限、認知度低等問題,市場相對不發達,但醫療體係正在逐步完善,未來有成長的潛力。由於醫療基礎設施的快速進步、再生醫學投資的增加以及患者人數的增加,亞太地區預計將成為羊膜成長最快的市場。中國、日本和印度等國家正在引領這一成長軌跡。
FPNV定位矩陣
FPNV定位矩陣對於評估羊膜市場至關重要。我們檢視與商務策略和產品滿意度相關的關鍵指標,以對供應商進行全面評估。這種詳細的分析使用戶能夠根據自己的要求做出明智的決策。根據評級,供應商被分為四個不同的象限,代表不同的成功程度:前沿 (F)、探路者 (P)、利基 (N) 或重要 (V)。
市場佔有率分析
市場佔有率分析是一種綜合工具,可以對羊膜市場供應商的現狀進行深入而深入的研究。仔細比較和分析供應商在整體收益、客戶群和其他關鍵指標方面的貢獻,幫助企業更好地了解其績效以及在爭奪市場佔有率時面臨的挑戰。此外,該分析還提供了對該行業競爭特徵的寶貴見解,包括在研究基準年期間觀察到的累積、分散優勢和合併特徵等因素。這種擴展的詳細程度使供應商能夠做出更明智的決策並制定有效的策略,以獲得市場競爭優勢。
本報告在以下方面提供了寶貴的見解:
1-市場滲透率:顯示主要企業提供的有關市場的全面資訊。
2- 市場發現:深入研究盈利的新興市場並分析其在成熟細分市場的滲透率。
3- 市場多樣性:提供有關新產品發布、未開發地區、最新發展和投資的詳細資訊。
4- 競爭評估和情報:對主要企業的市場佔有率、策略、產品、認證、監管核准、專利形勢和製造能力進行全面評估。
5- 產品開發與創新:提供對未來技術、研發活動和突破性產品開發的智慧見解。
本報告解決了以下關鍵問題:
1-羊膜市場的市場規模和預測是多少?
2-在羊膜市場預測期內,需要考慮投資哪些產品、細分市場、應用和領域?
3-羊膜市場的技術趨勢和法律規範是什麼?
4-羊膜市場主要供應商的市場佔有率是多少?
5- 進入Amnion市場適合的模式和策略舉措有哪些?
目錄
第1章 前言
第2章調查方法
第3章執行摘要
第4章市場概況
第5章市場洞察
- 市場動態
- 促進因素
- 羊膜移植需求
- 世界各地的老年人口正在增加
- 事故和創傷事件發生率增加
- 抑制因素
- 醫療保健領域缺乏熟練的專業人員
- 機會
- 增加羊膜動物再生醫學和幹細胞生物學的研究和開發活動
- 提高人們對羊膜囊和分娩組織捐贈益處的認知
- 任務
- 保持適當的儲存溫度水平
- 促進因素
- 市場區隔分析
- 產品:增加冷凍羊膜活細胞療法的使用
- 應用:眼科採用羊膜治療複雜的眼表疾病
- 最終使用者:整個醫院外科手術中關鍵使用的產品。
- 市場趨勢分析
- COVID-19 的累積影響
- 俄羅斯-烏克蘭衝突的累積影響
- 高通膨的累積效應
- 波特五力分析
- 價值鍊和關鍵路徑分析
- 法律規範
- 客戶客製化
第6章羊膜市場:依產品
- 冷凍羊膜
- 凍乾羊膜
第7章羊膜市場:依應用分類
- 眼科
- 手術疤痕
第 8 章 Amnion 市場:依最終用戶分類
- 門診手術中心
- 醫院
- 研究中心實驗室
- 專科診所
第9章 美洲羊膜市場
- 阿根廷
- 巴西
- 加拿大
- 墨西哥
- 美國
第10章亞太地區羊膜市場
- 澳洲
- 中國
- 印度
- 印尼
- 日本
- 馬來西亞
- 菲律賓
- 新加坡
- 韓國
- 台灣
- 泰國
- 越南
第11章 歐洲、中東、非洲羊膜市場
- 丹麥
- 埃及
- 芬蘭
- 法國
- 德國
- 以色列
- 義大利
- 荷蘭
- 奈及利亞
- 挪威
- 波蘭
- 卡達
- 俄羅斯
- 沙烏地阿拉伯
- 南非
- 西班牙
- 瑞典
- 瑞士
- 土耳其
- 阿拉伯聯合大公國
- 英國
第12章競爭形勢
- FPNV定位矩陣
- 市場佔有率分析:主要企業
- 主要企業競爭情境分析
- 併購
- 合約、合作和夥伴關係
第13章競爭產品組合
- 主要公司簡介
- Applied Biologics, LLC
- BioStem Technologies, Inc.
- BioTissue Holdings, Inc.
- Celularity Inc.
- FzioMed Inc.
- Genesis Biologics Inc.
- Integra LifeSciences Holdings Corporation
- Katena Products, Inc.
- Laboratoire CCD
- Lucina BioSciences, LLC
- Merakris Therapeutics
- MiMedx Group, Inc.
- Next Biosciences(Pty)Limited
- NuVision Biotherapies Ltd
- Organogenesis Holdings Inc.
- PuraGraft
- Seed Biotech, Inc.
- Skye Biologics Holdings, LLC
- Smith & Nephew PLC
- Stryker Corporation
- Surgenex, LLC
- Surgilogix
- The Electrospinning Company
- Thea Pharma Inc.
- Ventris Medical, LLC
- VIVEX Biologics, Inc.
- 主要產品系列
第14章附錄
- 討論指南
- 關於許可證和定價
[193 Pages Report] The Amniotic Membrane Market size was estimated at USD 931.83 million in 2022 and expected to reach USD 1,026.73 million in 2023, at a CAGR 9.37% to reach USD 1,908.60 million by 2030.
Global Amniotic Membrane Market
| KEY MARKET STATISTICS | |
|---|---|
| Base Year [2022] | USD 931.83 million |
| Estimated Year [2023] | USD 1,026.73 million |
| Forecast Year [2030] | USD 1,908.60 million |
| CAGR (%) | 9.37% |
The amniotic membrane market encompasses producing, distributing, and selling amniotic membranes for various medical applications. Amniotic membranes, derived from the innermost layer of the placenta and contain a unique combination of cells and extracellular matrix, have regenerative properties used in various therapeutic practices, especially in ophthalmology, wound care, and surgical procedures. Amniotic membranes are utilized in various medical applications due to their anti-inflammatory, anti-fibrotic, and anti-microbial properties and their ability to support stem cell proliferation. Nonetheless, the growth of the amniotic membrane market faces several limitations and challenging factors, such as ethical constraints, regulation, and cost constraints. Advances in preservation technologies, such as cryopreservation and dehydrated products, are making storing and transporting these membranes easier, thus expanding their availability and shelf-life. Ongoing research is discovering new therapeutic applications for the amniotic membrane, opening up further markets. Increased awareness among healthcare professionals and patients about the benefits of amniotic membrane-based products is also creating opportunities for market expansion.
Regional Insights
The amniotic membrane market in the Americas is experiencing substantial growth, driven by a strong presence of sophisticated healthcare infrastructure, heightened awareness amongst both practitioners and patients, and favorable reimbursement policies. The United States stands out as the primary market due to its well-established healthcare system and the presence of key players in the regenerative medicine sector. In the EMEA region, demand for amniotic membranes is growing, driven by increased adoption in ophthalmology and wound care. The European market is particularly robust, supported by stringent EU regulations that ensure product quality and safety. The rise in chronic diseases and an aging population contribute to this heightened demand. The Middle East exhibits growth potential with increased investments in healthcare infrastructure, though market penetration is still in its nascent stages compared to Europe. In Africa, the market is relatively underdeveloped, faced with challenges such as limited healthcare facilities and lower awareness levels, but it holds potential for future growth due to a gradual improvement in healthcare systems. The APAC region is anticipated to be the fastest-growing market for amniotic membranes, thanks to rapidly advancing healthcare infrastructure, increasing investments in regenerative medicine, and an expansive patient population. Countries like China, Japan, and India are leading this growth trajectory.
FPNV Positioning Matrix
The FPNV Positioning Matrix is pivotal in evaluating the Amniotic Membrane Market. It offers a comprehensive assessment of vendors, examining key metrics related to Business Strategy and Product Satisfaction. This in-depth analysis empowers users to make well-informed decisions aligned with their requirements. Based on the evaluation, the vendors are then categorized into four distinct quadrants representing varying levels of success: Forefront (F), Pathfinder (P), Niche (N), or Vital (V).
Market Share Analysis
The Market Share Analysis is a comprehensive tool that provides an insightful and in-depth examination of the current state of vendors in the Amniotic Membrane Market. By meticulously comparing and analyzing vendor contributions in terms of overall revenue, customer base, and other key metrics, we can offer companies a greater understanding of their performance and the challenges they face when competing for market share. Additionally, this analysis provides valuable insights into the competitive nature of the sector, including factors such as accumulation, fragmentation dominance, and amalgamation traits observed over the base year period studied. With this expanded level of detail, vendors can make more informed decisions and devise effective strategies to gain a competitive edge in the market.
Key Company Profiles
The report delves into recent significant developments in the Amniotic Membrane Market, highlighting leading vendors and their innovative profiles. These include Applied Biologics, LLC, BioStem Technologies, Inc., BioTissue Holdings, Inc., Celularity Inc., FzioMed Inc., Genesis Biologics Inc., Integra LifeSciences Holdings Corporation, Katena Products, Inc., Laboratoire CCD, Lucina BioSciences, LLC, Merakris Therapeutics, MiMedx Group, Inc., Next Biosciences (Pty) Limited, NuVision Biotherapies Ltd, Organogenesis Holdings Inc., PuraGraft, Seed Biotech, Inc., Skye Biologics Holdings, LLC, Smith & Nephew PLC, Stryker Corporation, Surgenex, LLC, Surgilogix, The Electrospinning Company, Thea Pharma Inc., Ventris Medical, LLC, and VIVEX Biologics, Inc..
Market Segmentation & Coverage
This research report categorizes the Amniotic Membrane Market to forecast the revenues and analyze trends in each of the following sub-markets:
- Product
- Cryopreserved Amniotic Membrane
- Lyophilization Amniotic Membrane
- Application
- Ophthalmology
- Surgical Wound
- End User
- Ambulatory Surgical Center
- Hospital
- Research Centers Laboratory
- Specialized Clinic
- Region
- Americas
- Argentina
- Brazil
- Canada
- Mexico
- United States
- California
- Florida
- Illinois
- New York
- Ohio
- Pennsylvania
- Texas
- Asia-Pacific
- Australia
- China
- India
- Indonesia
- Japan
- Malaysia
- Philippines
- Singapore
- South Korea
- Taiwan
- Thailand
- Vietnam
- Europe, Middle East & Africa
- Denmark
- Egypt
- Finland
- France
- Germany
- Israel
- Italy
- Netherlands
- Nigeria
- Norway
- Poland
- Qatar
- Russia
- Saudi Arabia
- South Africa
- Spain
- Sweden
- Switzerland
- Turkey
- United Arab Emirates
- United Kingdom
- Americas
The report offers valuable insights on the following aspects:
1. Market Penetration: It presents comprehensive information on the market provided by key players.
2. Market Development: It delves deep into lucrative emerging markets and analyzes the penetration across mature market segments.
3. Market Diversification: It provides detailed information on new product launches, untapped geographic regions, recent developments, and investments.
4. Competitive Assessment & Intelligence: It conducts an exhaustive assessment of market shares, strategies, products, certifications, regulatory approvals, patent landscape, and manufacturing capabilities of the leading players.
5. Product Development & Innovation: It offers intelligent insights on future technologies, R&D activities, and breakthrough product developments.
The report addresses key questions such as:
1. What is the market size and forecast of the Amniotic Membrane Market?
2. Which products, segments, applications, and areas should one consider investing in over the forecast period in the Amniotic Membrane Market?
3. What are the technology trends and regulatory frameworks in the Amniotic Membrane Market?
4. What is the market share of the leading vendors in the Amniotic Membrane Market?
5. Which modes and strategic moves are suitable for entering the Amniotic Membrane Market?
Table of Contents
1. Preface
- 1.1. Objectives of the Study
- 1.2. Market Segmentation & Coverage
- 1.3. Years Considered for the Study
- 1.4. Currency & Pricing
- 1.5. Language
- 1.6. Limitations
- 1.7. Assumptions
- 1.8. Stakeholders
2. Research Methodology
- 2.1. Define: Research Objective
- 2.2. Determine: Research Design
- 2.3. Prepare: Research Instrument
- 2.4. Collect: Data Source
- 2.5. Analyze: Data Interpretation
- 2.6. Formulate: Data Verification
- 2.7. Publish: Research Report
- 2.8. Repeat: Report Update
3. Executive Summary
4. Market Overview
- 4.1. Introduction
- 4.2. Amniotic Membrane Market, by Region
5. Market Insights
- 5.1. Market Dynamics
- 5.1.1. Drivers
- 5.1.1.1. Demand for amniotic membrane transplantations
- 5.1.1.2. Rising the geriatric population around the world
- 5.1.1.3. Growing incidence of accident and trauma cases
- 5.1.2. Restraints
- 5.1.2.1. Lack of skilled professionals in healthcare sector
- 5.1.3. Opportunities
- 5.1.3.1. Increasing R&D activities in the amniotic membrane for regenerative medicine and stem cell biology
- 5.1.3.2. Growing awareness of amniotic membrane benefits and birth tissue donations
- 5.1.4. Challenges
- 5.1.4.1. Maintaining sufficient storage temperature level
- 5.1.1. Drivers
- 5.2. Market Segmentation Analysis
- 5.2.1. Product: Increase in use of cryopreserved amniotic membranes live cell therapy
- 5.2.2. Application: Employment of amniotic membrane in ophthalmology treating complex ocular surface diseases
- 5.2.3. End User: Significant use products across Hospitals for surgical procedures
- 5.3. Market Trend Analysis
- 5.4. Cumulative Impact of COVID-19
- 5.5. Cumulative Impact of Russia-Ukraine Conflict
- 5.6. Cumulative Impact of High Inflation
- 5.7. Porter's Five Forces Analysis
- 5.7.1. Threat of New Entrants
- 5.7.2. Threat of Substitutes
- 5.7.3. Bargaining Power of Customers
- 5.7.4. Bargaining Power of Suppliers
- 5.7.5. Industry Rivalry
- 5.8. Value Chain & Critical Path Analysis
- 5.9. Regulatory Framework
- 5.10. Client Customization
6. Amniotic Membrane Market, by Product
- 6.1. Introduction
- 6.2. Cryopreserved Amniotic Membrane
- 6.3. Lyophilization Amniotic Membrane
7. Amniotic Membrane Market, by Application
- 7.1. Introduction
- 7.2. Ophthalmology
- 7.3. Surgical Wound
8. Amniotic Membrane Market, by End User
- 8.1. Introduction
- 8.2. Ambulatory Surgical Center
- 8.3. Hospital
- 8.4. Research Centers Laboratory
- 8.5. Specialized Clinic
9. Americas Amniotic Membrane Market
- 9.1. Introduction
- 9.2. Argentina
- 9.3. Brazil
- 9.4. Canada
- 9.5. Mexico
- 9.6. United States
10. Asia-Pacific Amniotic Membrane Market
- 10.1. Introduction
- 10.2. Australia
- 10.3. China
- 10.4. India
- 10.5. Indonesia
- 10.6. Japan
- 10.7. Malaysia
- 10.8. Philippines
- 10.9. Singapore
- 10.10. South Korea
- 10.11. Taiwan
- 10.12. Thailand
- 10.13. Vietnam
11. Europe, Middle East & Africa Amniotic Membrane Market
- 11.1. Introduction
- 11.2. Denmark
- 11.3. Egypt
- 11.4. Finland
- 11.5. France
- 11.6. Germany
- 11.7. Israel
- 11.8. Italy
- 11.9. Netherlands
- 11.10. Nigeria
- 11.11. Norway
- 11.12. Poland
- 11.13. Qatar
- 11.14. Russia
- 11.15. Saudi Arabia
- 11.16. South Africa
- 11.17. Spain
- 11.18. Sweden
- 11.19. Switzerland
- 11.20. Turkey
- 11.21. United Arab Emirates
- 11.22. United Kingdom
12. Competitive Landscape
- 12.1. FPNV Positioning Matrix
- 12.2. Market Share Analysis, By Key Player
- 12.3. Competitive Scenario Analysis, By Key Player
- 12.3.1. Merger & Acquisition
- 12.3.1.1. Coloplast announces agreement to acquire Kerecis and raises long-term growth expectations
- 12.3.2. Agreement, Collaboration, & Partnership
- 12.3.2.1. NovaBay to commercialize Amniotic Tissue Allograft as Avenova Allograft
- 12.3.1. Merger & Acquisition
13. Competitive Portfolio
- 13.1. Key Company Profiles
- 13.1.1. Applied Biologics, LLC
- 13.1.2. BioStem Technologies, Inc.
- 13.1.3. BioTissue Holdings, Inc.
- 13.1.4. Celularity Inc.
- 13.1.5. FzioMed Inc.
- 13.1.6. Genesis Biologics Inc.
- 13.1.7. Integra LifeSciences Holdings Corporation
- 13.1.8. Katena Products, Inc.
- 13.1.9. Laboratoire CCD
- 13.1.10. Lucina BioSciences, LLC
- 13.1.11. Merakris Therapeutics
- 13.1.12. MiMedx Group, Inc.
- 13.1.13. Next Biosciences (Pty) Limited
- 13.1.14. NuVision Biotherapies Ltd
- 13.1.15. Organogenesis Holdings Inc.
- 13.1.16. PuraGraft
- 13.1.17. Seed Biotech, Inc.
- 13.1.18. Skye Biologics Holdings, LLC
- 13.1.19. Smith & Nephew PLC
- 13.1.20. Stryker Corporation
- 13.1.21. Surgenex, LLC
- 13.1.22. Surgilogix
- 13.1.23. The Electrospinning Company
- 13.1.24. Thea Pharma Inc.
- 13.1.25. Ventris Medical, LLC
- 13.1.26. VIVEX Biologics, Inc.
- 13.2. Key Product Portfolio
14. Appendix
- 14.1. Discussion Guide
- 14.2. License & Pricing
LIST OF FIGURES
- FIGURE 1. AMNIOTIC MEMBRANE MARKET RESEARCH PROCESS
- FIGURE 2. AMNIOTIC MEMBRANE MARKET SIZE, 2022 VS 2030
- FIGURE 3. AMNIOTIC MEMBRANE MARKET SIZE, 2018-2030 (USD MILLION)
- FIGURE 4. AMNIOTIC MEMBRANE MARKET SIZE, BY REGION, 2022 VS 2030 (%)
- FIGURE 5. AMNIOTIC MEMBRANE MARKET SIZE, BY REGION, 2022 VS 2023 VS 2030 (USD MILLION)
- FIGURE 6. AMNIOTIC MEMBRANE MARKET DYNAMICS
- FIGURE 7. AMNIOTIC MEMBRANE MARKET SIZE, BY PRODUCT, 2022 VS 2030 (%)
- FIGURE 8. AMNIOTIC MEMBRANE MARKET SIZE, BY PRODUCT, 2022 VS 2023 VS 2030 (USD MILLION)
- FIGURE 9. AMNIOTIC MEMBRANE MARKET SIZE, BY APPLICATION, 2022 VS 2030 (%)
- FIGURE 10. AMNIOTIC MEMBRANE MARKET SIZE, BY APPLICATION, 2022 VS 2023 VS 2030 (USD MILLION)
- FIGURE 11. AMNIOTIC MEMBRANE MARKET SIZE, BY END USER, 2022 VS 2030 (%)
- FIGURE 12. AMNIOTIC MEMBRANE MARKET SIZE, BY END USER, 2022 VS 2023 VS 2030 (USD MILLION)
- FIGURE 13. AMERICAS AMNIOTIC MEMBRANE MARKET SIZE, BY COUNTRY, 2022 VS 2030 (%)
- FIGURE 14. AMERICAS AMNIOTIC MEMBRANE MARKET SIZE, BY COUNTRY, 2022 VS 2023 VS 2030 (USD MILLION)
- FIGURE 15. UNITED STATES AMNIOTIC MEMBRANE MARKET SIZE, BY STATE, 2022 VS 2030 (%)
- FIGURE 16. UNITED STATES AMNIOTIC MEMBRANE MARKET SIZE, BY STATE, 2022 VS 2023 VS 2030 (USD MILLION)
- FIGURE 17. ASIA-PACIFIC AMNIOTIC MEMBRANE MARKET SIZE, BY COUNTRY, 2022 VS 2030 (%)
- FIGURE 18. ASIA-PACIFIC AMNIOTIC MEMBRANE MARKET SIZE, BY COUNTRY, 2022 VS 2023 VS 2030 (USD MILLION)
- FIGURE 19. EUROPE, MIDDLE EAST & AFRICA AMNIOTIC MEMBRANE MARKET SIZE, BY COUNTRY, 2022 VS 2030 (%)
- FIGURE 20. EUROPE, MIDDLE EAST & AFRICA AMNIOTIC MEMBRANE MARKET SIZE, BY COUNTRY, 2022 VS 2023 VS 2030 (USD MILLION)
- FIGURE 21. AMNIOTIC MEMBRANE MARKET, FPNV POSITIONING MATRIX, 2022
- FIGURE 22. AMNIOTIC MEMBRANE MARKET SHARE, BY KEY PLAYER, 2022
LIST OF TABLES
- TABLE 1. AMNIOTIC MEMBRANE MARKET SEGMENTATION & COVERAGE
- TABLE 2. UNITED STATES DOLLAR EXCHANGE RATE, 2018-2022
- TABLE 3. AMNIOTIC MEMBRANE MARKET SIZE, 2018-2030 (USD MILLION)
- TABLE 4. GLOBAL AMNIOTIC MEMBRANE MARKET SIZE, BY REGION, 2018-2030 (USD MILLION)
- TABLE 5. AMNIOTIC MEMBRANE MARKET SIZE, BY PRODUCT, 2018-2030 (USD MILLION)
- TABLE 6. AMNIOTIC MEMBRANE MARKET SIZE, BY CRYOPRESERVED AMNIOTIC MEMBRANE, BY REGION, 2018-2030 (USD MILLION)
- TABLE 7. AMNIOTIC MEMBRANE MARKET SIZE, BY LYOPHILIZATION AMNIOTIC MEMBRANE, BY REGION, 2018-2030 (USD MILLION)
- TABLE 8. AMNIOTIC MEMBRANE MARKET SIZE, BY APPLICATION, 2018-2030 (USD MILLION)
- TABLE 9. AMNIOTIC MEMBRANE MARKET SIZE, BY OPHTHALMOLOGY, BY REGION, 2018-2030 (USD MILLION)
- TABLE 10. AMNIOTIC MEMBRANE MARKET SIZE, BY SURGICAL WOUND, BY REGION, 2018-2030 (USD MILLION)
- TABLE 11. AMNIOTIC MEMBRANE MARKET SIZE, BY END USER, 2018-2030 (USD MILLION)
- TABLE 12. AMNIOTIC MEMBRANE MARKET SIZE, BY AMBULATORY SURGICAL CENTER, BY REGION, 2018-2030 (USD MILLION)
- TABLE 13. AMNIOTIC MEMBRANE MARKET SIZE, BY HOSPITAL, BY REGION, 2018-2030 (USD MILLION)
- TABLE 14. AMNIOTIC MEMBRANE MARKET SIZE, BY RESEARCH CENTERS LABORATORY, BY REGION, 2018-2030 (USD MILLION)
- TABLE 15. AMNIOTIC MEMBRANE MARKET SIZE, BY SPECIALIZED CLINIC, BY REGION, 2018-2030 (USD MILLION)
- TABLE 16. AMERICAS AMNIOTIC MEMBRANE MARKET SIZE, BY PRODUCT, 2018-2030 (USD MILLION)
- TABLE 17. AMERICAS AMNIOTIC MEMBRANE MARKET SIZE, BY APPLICATION, 2018-2030 (USD MILLION)
- TABLE 18. AMERICAS AMNIOTIC MEMBRANE MARKET SIZE, BY END USER, 2018-2030 (USD MILLION)
- TABLE 19. AMERICAS AMNIOTIC MEMBRANE MARKET SIZE, BY COUNTRY, 2018-2030 (USD MILLION)
- TABLE 20. ARGENTINA AMNIOTIC MEMBRANE MARKET SIZE, BY PRODUCT, 2018-2030 (USD MILLION)
- TABLE 21. ARGENTINA AMNIOTIC MEMBRANE MARKET SIZE, BY APPLICATION, 2018-2030 (USD MILLION)
- TABLE 22. ARGENTINA AMNIOTIC MEMBRANE MARKET SIZE, BY END USER, 2018-2030 (USD MILLION)
- TABLE 23. BRAZIL AMNIOTIC MEMBRANE MARKET SIZE, BY PRODUCT, 2018-2030 (USD MILLION)
- TABLE 24. BRAZIL AMNIOTIC MEMBRANE MARKET SIZE, BY APPLICATION, 2018-2030 (USD MILLION)
- TABLE 25. BRAZIL AMNIOTIC MEMBRANE MARKET SIZE, BY END USER, 2018-2030 (USD MILLION)
- TABLE 26. CANADA AMNIOTIC MEMBRANE MARKET SIZE, BY PRODUCT, 2018-2030 (USD MILLION)
- TABLE 27. CANADA AMNIOTIC MEMBRANE MARKET SIZE, BY APPLICATION, 2018-2030 (USD MILLION)
- TABLE 28. CANADA AMNIOTIC MEMBRANE MARKET SIZE, BY END USER, 2018-2030 (USD MILLION)
- TABLE 29. MEXICO AMNIOTIC MEMBRANE MARKET SIZE, BY PRODUCT, 2018-2030 (USD MILLION)
- TABLE 30. MEXICO AMNIOTIC MEMBRANE MARKET SIZE, BY APPLICATION, 2018-2030 (USD MILLION)
- TABLE 31. MEXICO AMNIOTIC MEMBRANE MARKET SIZE, BY END USER, 2018-2030 (USD MILLION)
- TABLE 32. UNITED STATES AMNIOTIC MEMBRANE MARKET SIZE, BY PRODUCT, 2018-2030 (USD MILLION)
- TABLE 33. UNITED STATES AMNIOTIC MEMBRANE MARKET SIZE, BY APPLICATION, 2018-2030 (USD MILLION)
- TABLE 34. UNITED STATES AMNIOTIC MEMBRANE MARKET SIZE, BY END USER, 2018-2030 (USD MILLION)
- TABLE 35. UNITED STATES AMNIOTIC MEMBRANE MARKET SIZE, BY STATE, 2018-2030 (USD MILLION)
- TABLE 36. ASIA-PACIFIC AMNIOTIC MEMBRANE MARKET SIZE, BY PRODUCT, 2018-2030 (USD MILLION)
- TABLE 37. ASIA-PACIFIC AMNIOTIC MEMBRANE MARKET SIZE, BY APPLICATION, 2018-2030 (USD MILLION)
- TABLE 38. ASIA-PACIFIC AMNIOTIC MEMBRANE MARKET SIZE, BY END USER, 2018-2030 (USD MILLION)
- TABLE 39. ASIA-PACIFIC AMNIOTIC MEMBRANE MARKET SIZE, BY COUNTRY, 2018-2030 (USD MILLION)
- TABLE 40. AUSTRALIA AMNIOTIC MEMBRANE MARKET SIZE, BY PRODUCT, 2018-2030 (USD MILLION)
- TABLE 41. AUSTRALIA AMNIOTIC MEMBRANE MARKET SIZE, BY APPLICATION, 2018-2030 (USD MILLION)
- TABLE 42. AUSTRALIA AMNIOTIC MEMBRANE MARKET SIZE, BY END USER, 2018-2030 (USD MILLION)
- TABLE 43. CHINA AMNIOTIC MEMBRANE MARKET SIZE, BY PRODUCT, 2018-2030 (USD MILLION)
- TABLE 44. CHINA AMNIOTIC MEMBRANE MARKET SIZE, BY APPLICATION, 2018-2030 (USD MILLION)
- TABLE 45. CHINA AMNIOTIC MEMBRANE MARKET SIZE, BY END USER, 2018-2030 (USD MILLION)
- TABLE 46. INDIA AMNIOTIC MEMBRANE MARKET SIZE, BY PRODUCT, 2018-2030 (USD MILLION)
- TABLE 47. INDIA AMNIOTIC MEMBRANE MARKET SIZE, BY APPLICATION, 2018-2030 (USD MILLION)
- TABLE 48. INDIA AMNIOTIC MEMBRANE MARKET SIZE, BY END USER, 2018-2030 (USD MILLION)
- TABLE 49. INDONESIA AMNIOTIC MEMBRANE MARKET SIZE, BY PRODUCT, 2018-2030 (USD MILLION)
- TABLE 50. INDONESIA AMNIOTIC MEMBRANE MARKET SIZE, BY APPLICATION, 2018-2030 (USD MILLION)
- TABLE 51. INDONESIA AMNIOTIC MEMBRANE MARKET SIZE, BY END USER, 2018-2030 (USD MILLION)
- TABLE 52. JAPAN AMNIOTIC MEMBRANE MARKET SIZE, BY PRODUCT, 2018-2030 (USD MILLION)
- TABLE 53. JAPAN AMNIOTIC MEMBRANE MARKET SIZE, BY APPLICATION, 2018-2030 (USD MILLION)
- TABLE 54. JAPAN AMNIOTIC MEMBRANE MARKET SIZE, BY END USER, 2018-2030 (USD MILLION)
- TABLE 55. MALAYSIA AMNIOTIC MEMBRANE MARKET SIZE, BY PRODUCT, 2018-2030 (USD MILLION)
- TABLE 56. MALAYSIA AMNIOTIC MEMBRANE MARKET SIZE, BY APPLICATION, 2018-2030 (USD MILLION)
- TABLE 57. MALAYSIA AMNIOTIC MEMBRANE MARKET SIZE, BY END USER, 2018-2030 (USD MILLION)
- TABLE 58. PHILIPPINES AMNIOTIC MEMBRANE MARKET SIZE, BY PRODUCT, 2018-2030 (USD MILLION)
- TABLE 59. PHILIPPINES AMNIOTIC MEMBRANE MARKET SIZE, BY APPLICATION, 2018-2030 (USD MILLION)
- TABLE 60. PHILIPPINES AMNIOTIC MEMBRANE MARKET SIZE, BY END USER, 2018-2030 (USD MILLION)
- TABLE 61. SINGAPORE AMNIOTIC MEMBRANE MARKET SIZE, BY PRODUCT, 2018-2030 (USD MILLION)
- TABLE 62. SINGAPORE AMNIOTIC MEMBRANE MARKET SIZE, BY APPLICATION, 2018-2030 (USD MILLION)
- TABLE 63. SINGAPORE AMNIOTIC MEMBRANE MARKET SIZE, BY END USER, 2018-2030 (USD MILLION)
- TABLE 64. SOUTH KOREA AMNIOTIC MEMBRANE MARKET SIZE, BY PRODUCT, 2018-2030 (USD MILLION)
- TABLE 65. SOUTH KOREA AMNIOTIC MEMBRANE MARKET SIZE, BY APPLICATION, 2018-2030 (USD MILLION)
- TABLE 66. SOUTH KOREA AMNIOTIC MEMBRANE MARKET SIZE, BY END USER, 2018-2030 (USD MILLION)
- TABLE 67. TAIWAN AMNIOTIC MEMBRANE MARKET SIZE, BY PRODUCT, 2018-2030 (USD MILLION)
- TABLE 68. TAIWAN AMNIOTIC MEMBRANE MARKET SIZE, BY APPLICATION, 2018-2030 (USD MILLION)
- TABLE 69. TAIWAN AMNIOTIC MEMBRANE MARKET SIZE, BY END USER, 2018-2030 (USD MILLION)
- TABLE 70. THAILAND AMNIOTIC MEMBRANE MARKET SIZE, BY PRODUCT, 2018-2030 (USD MILLION)
- TABLE 71. THAILAND AMNIOTIC MEMBRANE MARKET SIZE, BY APPLICATION, 2018-2030 (USD MILLION)
- TABLE 72. THAILAND AMNIOTIC MEMBRANE MARKET SIZE, BY END USER, 2018-2030 (USD MILLION)
- TABLE 73. VIETNAM AMNIOTIC MEMBRANE MARKET SIZE, BY PRODUCT, 2018-2030 (USD MILLION)
- TABLE 74. VIETNAM AMNIOTIC MEMBRANE MARKET SIZE, BY APPLICATION, 2018-2030 (USD MILLION)
- TABLE 75. VIETNAM AMNIOTIC MEMBRANE MARKET SIZE, BY END USER, 2018-2030 (USD MILLION)
- TABLE 76. EUROPE, MIDDLE EAST & AFRICA AMNIOTIC MEMBRANE MARKET SIZE, BY PRODUCT, 2018-2030 (USD MILLION)
- TABLE 77. EUROPE, MIDDLE EAST & AFRICA AMNIOTIC MEMBRANE MARKET SIZE, BY APPLICATION, 2018-2030 (USD MILLION)
- TABLE 78. EUROPE, MIDDLE EAST & AFRICA AMNIOTIC MEMBRANE MARKET SIZE, BY END USER, 2018-2030 (USD MILLION)
- TABLE 79. EUROPE, MIDDLE EAST & AFRICA AMNIOTIC MEMBRANE MARKET SIZE, BY COUNTRY, 2018-2030 (USD MILLION)
- TABLE 80. DENMARK AMNIOTIC MEMBRANE MARKET SIZE, BY PRODUCT, 2018-2030 (USD MILLION)
- TABLE 81. DENMARK AMNIOTIC MEMBRANE MARKET SIZE, BY APPLICATION, 2018-2030 (USD MILLION)
- TABLE 82. DENMARK AMNIOTIC MEMBRANE MARKET SIZE, BY END USER, 2018-2030 (USD MILLION)
- TABLE 83. EGYPT AMNIOTIC MEMBRANE MARKET SIZE, BY PRODUCT, 2018-2030 (USD MILLION)
- TABLE 84. EGYPT AMNIOTIC MEMBRANE MARKET SIZE, BY APPLICATION, 2018-2030 (USD MILLION)
- TABLE 85. EGYPT AMNIOTIC MEMBRANE MARKET SIZE, BY END USER, 2018-2030 (USD MILLION)
- TABLE 86. FINLAND AMNIOTIC MEMBRANE MARKET SIZE, BY PRODUCT, 2018-2030 (USD MILLION)
- TABLE 87. FINLAND AMNIOTIC MEMBRANE MARKET SIZE, BY APPLICATION, 2018-2030 (USD MILLION)
- TABLE 88. FINLAND AMNIOTIC MEMBRANE MARKET SIZE, BY END USER, 2018-2030 (USD MILLION)
- TABLE 89. FRANCE AMNIOTIC MEMBRANE MARKET SIZE, BY PRODUCT, 2018-2030 (USD MILLION)
- TABLE 90. FRANCE AMNIOTIC MEMBRANE MARKET SIZE, BY APPLICATION, 2018-2030 (USD MILLION)
- TABLE 91. FRANCE AMNIOTIC MEMBRANE MARKET SIZE, BY END USER, 2018-2030 (USD MILLION)
- TABLE 92. GERMANY AMNIOTIC MEMBRANE MARKET SIZE, BY PRODUCT, 2018-2030 (USD MILLION)
- TABLE 93. GERMANY AMNIOTIC MEMBRANE MARKET SIZE, BY APPLICATION, 2018-2030 (USD MILLION)
- TABLE 94. GERMANY AMNIOTIC MEMBRANE MARKET SIZE, BY END USER, 2018-2030 (USD MILLION)
- TABLE 95. ISRAEL AMNIOTIC MEMBRANE MARKET SIZE, BY PRODUCT, 2018-2030 (USD MILLION)
- TABLE 96. ISRAEL AMNIOTIC MEMBRANE MARKET SIZE, BY APPLICATION, 2018-2030 (USD MILLION)
- TABLE 97. ISRAEL AMNIOTIC MEMBRANE MARKET SIZE, BY END USER, 2018-2030 (USD MILLION)
- TABLE 98. ITALY AMNIOTIC MEMBRANE MARKET SIZE, BY PRODUCT, 2018-2030 (USD MILLION)
- TABLE 99. ITALY AMNIOTIC MEMBRANE MARKET SIZE, BY APPLICATION, 2018-2030 (USD MILLION)
- TABLE 100. ITALY AMNIOTIC MEMBRANE MARKET SIZE, BY END USER, 2018-2030 (USD MILLION)
- TABLE 101. NETHERLANDS AMNIOTIC MEMBRANE MARKET SIZE, BY PRODUCT, 2018-2030 (USD MILLION)
- TABLE 102. NETHERLANDS AMNIOTIC MEMBRANE MARKET SIZE, BY APPLICATION, 2018-2030 (USD MILLION)
- TABLE 103. NETHERLANDS AMNIOTIC MEMBRANE MARKET SIZE, BY END USER, 2018-2030 (USD MILLION)
- TABLE 104. NIGERIA AMNIOTIC MEMBRANE MARKET SIZE, BY PRODUCT, 2018-2030 (USD MILLION)
- TABLE 105. NIGERIA AMNIOTIC MEMBRANE MARKET SIZE, BY APPLICATION, 2018-2030 (USD MILLION)
- TABLE 106. NIGERIA AMNIOTIC MEMBRANE MARKET SIZE, BY END USER, 2018-2030 (USD MILLION)
- TABLE 107. NORWAY AMNIOTIC MEMBRANE MARKET SIZE, BY PRODUCT, 2018-2030 (USD MILLION)
- TABLE 108. NORWAY AMNIOTIC MEMBRANE MARKET SIZE, BY APPLICATION, 2018-2030 (USD MILLION)
- TABLE 109. NORWAY AMNIOTIC MEMBRANE MARKET SIZE, BY END USER, 2018-2030 (USD MILLION)
- TABLE 110. POLAND AMNIOTIC MEMBRANE MARKET SIZE, BY PRODUCT, 2018-2030 (USD MILLION)
- TABLE 111. POLAND AMNIOTIC MEMBRANE MARKET SIZE, BY APPLICATION, 2018-2030 (USD MILLION)
- TABLE 112. POLAND AMNIOTIC MEMBRANE MARKET SIZE, BY END USER, 2018-2030 (USD MILLION)
- TABLE 113. QATAR AMNIOTIC MEMBRANE MARKET SIZE, BY PRODUCT, 2018-2030 (USD MILLION)
- TABLE 114. QATAR AMNIOTIC MEMBRANE MARKET SIZE, BY APPLICATION, 2018-2030 (USD MILLION)
- TABLE 115. QATAR AMNIOTIC MEMBRANE MARKET SIZE, BY END USER, 2018-2030 (USD MILLION)
- TABLE 116. RUSSIA AMNIOTIC MEMBRANE MARKET SIZE, BY PRODUCT, 2018-2030 (USD MILLION)
- TABLE 117. RUSSIA AMNIOTIC MEMBRANE MARKET SIZE, BY APPLICATION, 2018-2030 (USD MILLION)
- TABLE 118. RUSSIA AMNIOTIC MEMBRANE MARKET SIZE, BY END USER, 2018-2030 (USD MILLION)
- TABLE 119. SAUDI ARABIA AMNIOTIC MEMBRANE MARKET SIZE, BY PRODUCT, 2018-2030 (USD MILLION)
- TABLE 120. SAUDI ARABIA AMNIOTIC MEMBRANE MARKET SIZE, BY APPLICATION, 2018-2030 (USD MILLION)
- TABLE 121. SAUDI ARABIA AMNIOTIC MEMBRANE MARKET SIZE, BY END USER, 2018-2030 (USD MILLION)
- TABLE 122. SOUTH AFRICA AMNIOTIC MEMBRANE MARKET SIZE, BY PRODUCT, 2018-2030 (USD MILLION)
- TABLE 123. SOUTH AFRICA AMNIOTIC MEMBRANE MARKET SIZE, BY APPLICATION, 2018-2030 (USD MILLION)
- TABLE 124. SOUTH AFRICA AMNIOTIC MEMBRANE MARKET SIZE, BY END USER, 2018-2030 (USD MILLION)
- TABLE 125. SPAIN AMNIOTIC MEMBRANE MARKET SIZE, BY PRODUCT, 2018-2030 (USD MILLION)
- TABLE 126. SPAIN AMNIOTIC MEMBRANE MARKET SIZE, BY APPLICATION, 2018-2030 (USD MILLION)
- TABLE 127. SPAIN AMNIOTIC MEMBRANE MARKET SIZE, BY END USER, 2018-2030 (USD MILLION)
- TABLE 128. SWEDEN AMNIOTIC MEMBRANE MARKET SIZE, BY PRODUCT, 2018-2030 (USD MILLION)
- TABLE 129. SWEDEN AMNIOTIC MEMBRANE MARKET SIZE, BY APPLICATION, 2018-2030 (USD MILLION)
- TABLE 130. SWEDEN AMNIOTIC MEMBRANE MARKET SIZE, BY END USER, 2018-2030 (USD MILLION)
- TABLE 131. SWITZERLAND AMNIOTIC MEMBRANE MARKET SIZE, BY PRODUCT, 2018-2030 (USD MILLION)
- TABLE 132. SWITZERLAND AMNIOTIC MEMBRANE MARKET SIZE, BY APPLICATION, 2018-2030 (USD MILLION)
- TABLE 133. SWITZERLAND AMNIOTIC MEMBRANE MARKET SIZE, BY END USER, 2018-2030 (USD MILLION)
- TABLE 134. TURKEY AMNIOTIC MEMBRANE MARKET SIZE, BY PRODUCT, 2018-2030 (USD MILLION)
- TABLE 135. TURKEY AMNIOTIC MEMBRANE MARKET SIZE, BY APPLICATION, 2018-2030 (USD MILLION)
- TABLE 136. TURKEY AMNIOTIC MEMBRANE MARKET SIZE, BY END USER, 2018-2030 (USD MILLION)
- TABLE 137. UNITED ARAB EMIRATES AMNIOTIC MEMBRANE MARKET SIZE, BY PRODUCT, 2018-2030 (USD MILLION)
- TABLE 138. UNITED ARAB EMIRATES AMNIOTIC MEMBRANE MARKET SIZE, BY APPLICATION, 2018-2030 (USD MILLION)
- TABLE 139. UNITED ARAB EMIRATES AMNIOTIC MEMBRANE MARKET SIZE, BY END USER, 2018-2030 (USD MILLION)
- TABLE 140. UNITED KINGDOM AMNIOTIC MEMBRANE MARKET SIZE, BY PRODUCT, 2018-2030 (USD MILLION)
- TABLE 141. UNITED KINGDOM AMNIOTIC MEMBRANE MARKET SIZE, BY APPLICATION, 2018-2030 (USD MILLION)
- TABLE 142. UNITED KINGDOM AMNIOTIC MEMBRANE MARKET SIZE, BY END USER, 2018-2030 (USD MILLION)
- TABLE 143. AMNIOTIC MEMBRANE MARKET, FPNV POSITIONING MATRIX, 2022
- TABLE 144. AMNIOTIC MEMBRANE MARKET SHARE, BY KEY PLAYER, 2022
- TABLE 145. AMNIOTIC MEMBRANE MARKET LICENSE & PRICING
 全球羊膜市場規模、佔有率、成長分析、副產品(冷凍保存和脫水)、依應用(手術傷口、眼科)- 2024-2031 年產業預測
 羊膜市場 - 副產品(冷凍保存、冷凍乾燥)、應用(手術傷口、眼科、幹細胞生物學、再生醫學、產前診斷)、最終用途(醫院、專科診所) - 全球預測,2024 年 - 2032 年
 羊膜市場(產品:冷凍羊膜和冷凍乾燥羊膜;應用:手術傷口、眼科等)- 全球產業分析、規模、佔有率、成長、趨勢和預測,2023-2031 年
 羊膜產品市場 - 全球規模、佔有率、趨勢分析、機會、預測報告,2019-2030
 羊膜市場:2023-2028 年全球產業趨勢、佔有率、規模、成長、機會與預測
 羊膜市場、份額、規模、趨勢、行業分析報告:按產品、按最終用途、按地區、按細分市場、預測,2023-2032年
 羊膜市場:按產品類型、按應用、按最終用戶、按地區
 羊膜產品市場 - 2018-2028 年全球產業規模、佔有率、趨勢、機會與預測,按類型、按應用、最終用戶、地區、競爭細分
 羊膜市場規模、佔有率、趨勢分析報告:按產品、用途、最終用途、地區和細分市場預測,2023-2030
 全球羊膜產品市場預測(按類型(冷凍羊膜,脫水羊膜),應用(傷口護理,眼科,骨科)和最終用戶(醫院,門診手術中心)到2028