


 |
市場調查報告書
商品編碼
1434197
資產完整性管理市場:提供的服務、調查方法、產業 - 全球預測 2024-2030Asset Integrity Management Market by Offering (Hardware, Services, Software), Methodologies (Condition monitoring studies, Damage identification & risk assessment, Process system integrity studies), Industry - Global Forecast 2024-2030 |
||||||
※ 本網頁內容可能與最新版本有所差異。詳細情況請與我們聯繫。
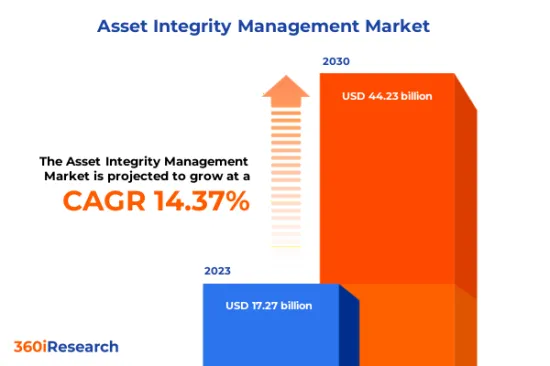
預計2023年資產完整性管理市場規模為172.7億美元,預計2024年將達196.5億美元,2030年將達442.3億美元,複合年成長率為14.37%。
全球資產完整性管理市場
| 主要市場統計 | |
|---|---|
| 基準年[2023] | 172.7億美元 |
| 預測年份 [2024] | 196.5億美元 |
| 預測年份 [2030] | 442.3億美元 |
| 複合年成長率(%) | 14.37% |
資產完整性管理 (AIM) 是一個系統化流程,用於確保工業資產整個生命週期的安全性、可靠性和效率。 AIM 解決方案的綜合方法支援石油和天然氣、發電、化學加工和採礦等行業的各種實體資產的設計、施工、試運行、營運和維護,例如管道、工藝設施、結構和設備。涵蓋退役的各個方面。特別是,由於日益成長的安全問題和高效品管的需要,船舶、工業製造、航太以及石油和天然氣等不斷發展的行業正在採用資產完整性管理解決方案。然而,高昂的實施成本給考慮實施 AIM 解決方案的公司帶來了挑戰。然而,雲端技術與 AIM 服務的整合以及雲端技術的使用使企業能夠存取有關其資產的即時資料,從而推動資產完整性管理系統和解決方案的採用。
區域洞察
由於對業務效率的要求不斷提高、嚴格的法規以及維護老化工業基礎設施的需要,美洲的資產完整性管理市場正在經歷顯著成長。石油和天然氣、石化和發電等行業的快速工業化和擴張,以及對將現有資產維持在最佳性能水準的重視,導致亞太地區擴大採用資產完整性管理解決方案。此外,人們對環境保護和安全措施的認知不斷提高,以及透過對煉油廠和管道等關鍵基礎設施進行大量投資來增加石油產量,正在加速歐洲、中東和非洲地區資產完整性管理解決方案的採用。此外,透過將人工智慧(AI)和物聯網(IoT)等先進技術整合到資產完整性管理解決方案中,企業可以更好地洞察資產績效。
FPNV定位矩陣
FPNV 定位矩陣對於評估資產完整性管理市場至關重要。透過檢視與業務策略和產品滿意度相關的關鍵指標來全面評估供應商。這種深入的分析使用戶能夠根據自己的要求做出明智的決策。根據評估,供應商被分為四個成功程度不同的像限:前沿(F)、探路者(P)、利基(N)和重要(V)。
市場佔有率分析
市場佔有率分析是一種綜合工具,可以對資產完整性管理市場中供應商的現狀進行深入而詳細的研究。全面比較和分析供應商在整體收益、基本客群和其他關鍵指標方面的貢獻,以便更好地了解公司的績效及其在爭奪市場佔有率時面臨的挑戰。此外,該分析還提供了對該行業競爭特徵的寶貴見解,包括在研究基準年觀察到的累積、分散主導地位和合併特徵等因素。這種詳細程度的提高使供應商能夠做出更明智的決策並制定有效的策略,從而在市場上獲得競爭優勢。
該報告對以下幾個方面提供了寶貴的見解:
1-市場滲透率:提供有關主要企業所服務的市場的全面資訊。
2-市場開拓:我們深入研究利潤豐厚的新興市場,並分析它們在成熟細分市場中的滲透率。
3- 市場多元化:提供有關新產品發布、開拓地區、最新發展和投資的詳細資訊。
4-競爭力評估與資訊:對主要企業的市場佔有率、策略、產品、認證、監管狀況、專利狀況、製造能力等進行全面評估。
5- 產品開發與創新:提供對未來技術、研發活動和突破性產品開發的見解。
本報告解決了以下關鍵問題:
1-資產完整性管理市場的市場規模與預測是多少?
2-在資產完整性管理市場的預測期內,需要考慮投資哪些產品、細分市場、應用程式和領域?
3-資產完整性管理市場的技術趨勢和法律規範是什麼?
4-資產完整性管理市場主要供應商的市場佔有率是多少?
5-進入資產完整性管理市場的合適型態和策略手段是什麼?
目錄
第1章 前言
第2章調查方法
第3章執行摘要
第4章市場概況
第5章市場洞察
- 市場動態
- 促進因素
- 日益增加的安全問題和有效品管的需求
- 船舶和工業製造領域的需求不斷成長
- AIM 在航太和石油天然氣產業的潛力
- 抑制因素
- 實施資產完整性管理解決方案的成本高昂
- 機會
- 將先進技術融入資產完整性管理解決方案
- 雲端技術融入資產完整性管理服務
- 任務
- 缺乏熟練人才、缺乏標準化
- 促進因素
- 市場區隔分析
- 市場趨勢分析
- 高通膨的累積效應
- 波特五力分析
- 價值鍊和關鍵路徑分析
- 法律規範
第6章 資產完整性管理市場:透過發行
- 硬體
- 服務
- 軟體
第7章依方法論的資產完整性管理市場
- 狀態監測研究
- 損害識別和風險評估
- 過程系統完整性研究
- 維護注重可靠性
- 基於風險的測試
- 安全與風險管理(HAZID、HAZOP、QRA)
- 安全完整性等級 (SIL) 調查
第8章資產完整性管理市場:依行業
- 航太
- 礦業
- 石油天然氣
- 電力
第9章美洲資產完整性管理市場
- 阿根廷
- 巴西
- 加拿大
- 墨西哥
- 美國
第10章亞太資產完整性管理市場
- 澳洲
- 中國
- 印度
- 印尼
- 日本
- 馬來西亞
- 菲律賓
- 新加坡
- 韓國
- 台灣
- 泰國
- 越南
第11章 歐洲、中東和非洲資產完整性管理市場
- 丹麥
- 埃及
- 芬蘭
- 法國
- 德國
- 以色列
- 義大利
- 荷蘭
- 奈及利亞
- 挪威
- 波蘭
- 卡達
- 俄羅斯
- 沙烏地阿拉伯
- 南非
- 西班牙
- 瑞典
- 瑞士
- 土耳其
- 阿拉伯聯合大公國
- 英國
第12章競爭形勢
- FPNV定位矩陣
- 市場佔有率分析:主要企業
- 主要企業競爭情境分析
- 合約、合作和夥伴關係
- 新產品發布和功能增強
第13章競爭產品組合
- 主要公司簡介
- ABB Group
- ABS Group of Companies, Inc.
- Aker Solutions ASA
- Applus Services SA
- Asset Integrity Engineering
- Axess Group
- Baker Hughes Company
- Bureau Veritas SA
- Dacon Inspection Technologies Co., Ltd.
- Det Norske Veritas Group
- Dexon Technology PLC
- DNV AS
- EM Topco Limited
- EM&I Ltd.
- Fluor Corporation
- FORCE Technology Norway AS
- 創世紀石油天然氣顧問有限公司
- Intertek Group PLC
- John Wood Group PLC
- LifeTech Engineering Ltd.
- Metegrity Inc.
- Oceaneering International, Inc.
- Rosen Swiss AG
- SGS Societe Generale de Surveillance SA
- TechnipFMC plc
- Tuv Nord Group
- Twi Ltd.
- Velosi Asset Integrity Ltd.
- 主要產品系列
第14章附錄
- 討論指南
- 關於許可證和定價
[181 Pages Report] The Asset Integrity Management Market size was estimated at USD 17.27 billion in 2023 and expected to reach USD 19.65 billion in 2024, at a CAGR 14.37% to reach USD 44.23 billion by 2030.
Global Asset Integrity Management Market
| KEY MARKET STATISTICS | |
|---|---|
| Base Year [2023] | USD 17.27 billion |
| Estimated Year [2024] | USD 19.65 billion |
| Forecast Year [2030] | USD 44.23 billion |
| CAGR (%) | 14.37% |
Asset Integrity Management (AIM) is a systematic process employed to ensure industrial assets' safety, reliability, and efficiency throughout their life cycle. AIM solutions' comprehensive approach encompasses all aspects of design, construction, commissioning, operation, maintenance, and decommissioning of various physical assets such as pipelines, process facilities, structures, and equipment in industries such as oil and gas, power generation, chemical processing, and mining. Increasing safety concerns and the need for efficient quality control, particularly across growing industries such as marine, industrial manufacturing, aerospace, and oil & gas, result in adopting asset integrity management solutions. However, high implementation costs pose a challenge for organizations considering adopting AIM solutions. Nevertheless, the convergence of cloud technology with AIM services and leveraging cloud technology can provide organizations access to real-time data about their assets, encouraging the adoption of asset integrity management systems and solutions.
Regional Insights
The asset integrity management market is witnessing significant growth in the Americas owing to the increasing demand for operational efficiency, stringent regulations, and the need to maintain an aging industrial infrastructure. Rapid industrialization and expansion of industries, including oil & gas, petrochemicals, and power generation, and emphasis on maintaining existing assets at optimum performance levels are leading to increased adoption of asset integrity management solutions in the APAC region. Moreover, growing awareness about environmental protection and safety measures and rising oil production with significant investments in critical infrastructures such as refineries and pipelines, have accelerated the adoption of asset integrity management solutions in the EMEA region. Additionally, integrating advanced technologies such as artificial intelligence (AI) and Internet of Things (IoT) into asset integrity management solutions can provide companies with better insights into their assets' performance.
FPNV Positioning Matrix
The FPNV Positioning Matrix is pivotal in evaluating the Asset Integrity Management Market. It offers a comprehensive assessment of vendors, examining key metrics related to Business Strategy and Product Satisfaction. This in-depth analysis empowers users to make well-informed decisions aligned with their requirements. Based on the evaluation, the vendors are then categorized into four distinct quadrants representing varying levels of success: Forefront (F), Pathfinder (P), Niche (N), or Vital (V).
Market Share Analysis
The Market Share Analysis is a comprehensive tool that provides an insightful and in-depth examination of the current state of vendors in the Asset Integrity Management Market. By meticulously comparing and analyzing vendor contributions in terms of overall revenue, customer base, and other key metrics, we can offer companies a greater understanding of their performance and the challenges they face when competing for market share. Additionally, this analysis provides valuable insights into the competitive nature of the sector, including factors such as accumulation, fragmentation dominance, and amalgamation traits observed over the base year period studied. With this expanded level of detail, vendors can make more informed decisions and devise effective strategies to gain a competitive edge in the market.
Key Company Profiles
The report delves into recent significant developments in the Asset Integrity Management Market, highlighting leading vendors and their innovative profiles. These include ABB Group, ABS Group of Companies, Inc., Aker Solutions ASA, Applus Services SA, Asset Integrity Engineering, Axess Group, Baker Hughes Company, Bureau Veritas SA, Dacon Inspection Technologies Co., Ltd., Det Norske Veritas Group, Dexon Technology PLC, DNV AS, EM Topco Limited, EM&I Ltd., Fluor Corporation, FORCE Technology Norway AS, Genesis Oil and Gas Consultants Ltd., Intertek Group PLC, John Wood Group PLC, LifeTech Engineering Ltd., Metegrity Inc., Oceaneering International, Inc., Rosen Swiss AG, SGS Societe Generale de Surveillance SA, TechnipFMC plc, Tuv Nord Group, Twi Ltd., and Velosi Asset Integrity Ltd..
Market Segmentation & Coverage
This research report categorizes the Asset Integrity Management Market to forecast the revenues and analyze trends in each of the following sub-markets:
- Offering
- Hardware
- Services
- Software
- Methodologies
- Condition monitoring studies
- Damage identification & risk assessment
- Process system integrity studies
- Reliability-centred maintenance
- Risk-based inspection
- Safety & risk management (HAZID, HAZOP and QRA)
- Safety integrity level (SIL) studies
- Industry
- Aerospace
- Mining
- Oil & Gas
- Power
- Region
- Americas
- Argentina
- Brazil
- Canada
- Mexico
- United States
- California
- Florida
- Illinois
- New York
- Ohio
- Pennsylvania
- Texas
- Asia-Pacific
- Australia
- China
- India
- Indonesia
- Japan
- Malaysia
- Philippines
- Singapore
- South Korea
- Taiwan
- Thailand
- Vietnam
- Europe, Middle East & Africa
- Denmark
- Egypt
- Finland
- France
- Germany
- Israel
- Italy
- Netherlands
- Nigeria
- Norway
- Poland
- Qatar
- Russia
- Saudi Arabia
- South Africa
- Spain
- Sweden
- Switzerland
- Turkey
- United Arab Emirates
- United Kingdom
- Americas
The report offers valuable insights on the following aspects:
1. Market Penetration: It presents comprehensive information on the market provided by key players.
2. Market Development: It delves deep into lucrative emerging markets and analyzes the penetration across mature market segments.
3. Market Diversification: It provides detailed information on new product launches, untapped geographic regions, recent developments, and investments.
4. Competitive Assessment & Intelligence: It conducts an exhaustive assessment of market shares, strategies, products, certifications, regulatory approvals, patent landscape, and manufacturing capabilities of the leading players.
5. Product Development & Innovation: It offers intelligent insights on future technologies, R&D activities, and breakthrough product developments.
The report addresses key questions such as:
1. What is the market size and forecast of the Asset Integrity Management Market?
2. Which products, segments, applications, and areas should one consider investing in over the forecast period in the Asset Integrity Management Market?
3. What are the technology trends and regulatory frameworks in the Asset Integrity Management Market?
4. What is the market share of the leading vendors in the Asset Integrity Management Market?
5. Which modes and strategic moves are suitable for entering the Asset Integrity Management Market?
Table of Contents
1. Preface
- 1.1. Objectives of the Study
- 1.2. Market Segmentation & Coverage
- 1.3. Years Considered for the Study
- 1.4. Currency & Pricing
- 1.5. Language
- 1.6. Limitations
- 1.7. Assumptions
- 1.8. Stakeholders
2. Research Methodology
- 2.1. Define: Research Objective
- 2.2. Determine: Research Design
- 2.3. Prepare: Research Instrument
- 2.4. Collect: Data Source
- 2.5. Analyze: Data Interpretation
- 2.6. Formulate: Data Verification
- 2.7. Publish: Research Report
- 2.8. Repeat: Report Update
3. Executive Summary
4. Market Overview
- 4.1. Introduction
- 4.2. Asset Integrity Management Market, by Region
5. Market Insights
- 5.1. Market Dynamics
- 5.1.1. Drivers
- 5.1.1.1. Increasing safety concerns and the need for efficient quality control
- 5.1.1.2. Rising demand from the marine and industrial manufacturing sectors
- 5.1.1.3. Potential of AIM in the aerospace and oil & gas industry
- 5.1.2. Restraints
- 5.1.2.1. High cost of implementation of asset integrity management solutions
- 5.1.3. Opportunities
- 5.1.3.1. Integration of advanced technologies in asset integrity management solutions
- 5.1.3.2. Convergence of cloud technology in asset integrity management services
- 5.1.4. Challenges
- 5.1.4.1. Dearth of skilled personnel coupled with and lack of standardization
- 5.1.1. Drivers
- 5.2. Market Segmentation Analysis
- 5.3. Market Trend Analysis
- 5.4. Cumulative Impact of High Inflation
- 5.5. Porter's Five Forces Analysis
- 5.5.1. Threat of New Entrants
- 5.5.2. Threat of Substitutes
- 5.5.3. Bargaining Power of Customers
- 5.5.4. Bargaining Power of Suppliers
- 5.5.5. Industry Rivalry
- 5.6. Value Chain & Critical Path Analysis
- 5.7. Regulatory Framework
6. Asset Integrity Management Market, by Offering
- 6.1. Introduction
- 6.2. Hardware
- 6.3. Services
- 6.4. Software
7. Asset Integrity Management Market, by Methodologies
- 7.1. Introduction
- 7.2. Condition monitoring studies
- 7.3. Damage identification & risk assessment
- 7.4. Process system integrity studies
- 7.5. Reliability-centred maintenance
- 7.6. Risk-based inspection
- 7.7. Safety & risk management (HAZID, HAZOP and QRA)
- 7.8. Safety integrity level (SIL) studies
8. Asset Integrity Management Market, by Industry
- 8.1. Introduction
- 8.2. Aerospace
- 8.3. Mining
- 8.4. Oil & Gas
- 8.5. Power
9. Americas Asset Integrity Management Market
- 9.1. Introduction
- 9.2. Argentina
- 9.3. Brazil
- 9.4. Canada
- 9.5. Mexico
- 9.6. United States
10. Asia-Pacific Asset Integrity Management Market
- 10.1. Introduction
- 10.2. Australia
- 10.3. China
- 10.4. India
- 10.5. Indonesia
- 10.6. Japan
- 10.7. Malaysia
- 10.8. Philippines
- 10.9. Singapore
- 10.10. South Korea
- 10.11. Taiwan
- 10.12. Thailand
- 10.13. Vietnam
11. Europe, Middle East & Africa Asset Integrity Management Market
- 11.1. Introduction
- 11.2. Denmark
- 11.3. Egypt
- 11.4. Finland
- 11.5. France
- 11.6. Germany
- 11.7. Israel
- 11.8. Italy
- 11.9. Netherlands
- 11.10. Nigeria
- 11.11. Norway
- 11.12. Poland
- 11.13. Qatar
- 11.14. Russia
- 11.15. Saudi Arabia
- 11.16. South Africa
- 11.17. Spain
- 11.18. Sweden
- 11.19. Switzerland
- 11.20. Turkey
- 11.21. United Arab Emirates
- 11.22. United Kingdom
12. Competitive Landscape
- 12.1. FPNV Positioning Matrix
- 12.2. Market Share Analysis, By Key Player
- 12.3. Competitive Scenario Analysis, By Key Player
- 12.3.1. Agreement, Collaboration, & Partnership
- 12.3.1.1. Antea North America and Vysus Forge Partnership to Deliver End-to-End Asset Integrity Management and Risk Based Inspection Solutions
- 12.3.2. New Product Launch & Enhancement
- 12.3.2.1. SKY-futures and flyability launch a fully integrated drone-based inspection software-hardware solution
- 12.3.2.2. Saipem and MCS launch asset integrity management system
- 12.3.1. Agreement, Collaboration, & Partnership
13. Competitive Portfolio
- 13.1. Key Company Profiles
- 13.1.1. ABB Group
- 13.1.2. ABS Group of Companies, Inc.
- 13.1.3. Aker Solutions ASA
- 13.1.4. Applus Services SA
- 13.1.5. Asset Integrity Engineering
- 13.1.6. Axess Group
- 13.1.7. Baker Hughes Company
- 13.1.8. Bureau Veritas SA
- 13.1.9. Dacon Inspection Technologies Co., Ltd.
- 13.1.10. Det Norske Veritas Group
- 13.1.11. Dexon Technology PLC
- 13.1.12. DNV AS
- 13.1.13. EM Topco Limited
- 13.1.14. EM&I Ltd.
- 13.1.15. Fluor Corporation
- 13.1.16. FORCE Technology Norway AS
- 13.1.17. Genesis Oil and Gas Consultants Ltd.
- 13.1.18. Intertek Group PLC
- 13.1.19. John Wood Group PLC
- 13.1.20. LifeTech Engineering Ltd.
- 13.1.21. Metegrity Inc.
- 13.1.22. Oceaneering International, Inc.
- 13.1.23. Rosen Swiss AG
- 13.1.24. SGS Societe Generale de Surveillance SA
- 13.1.25. TechnipFMC plc
- 13.1.26. Tuv Nord Group
- 13.1.27. Twi Ltd.
- 13.1.28. Velosi Asset Integrity Ltd.
- 13.2. Key Product Portfolio
14. Appendix
- 14.1. Discussion Guide
- 14.2. License & Pricing
LIST OF FIGURES
- FIGURE 1. ASSET INTEGRITY MANAGEMENT MARKET RESEARCH PROCESS
- FIGURE 2. ASSET INTEGRITY MANAGEMENT MARKET SIZE, 2023 VS 2030
- FIGURE 3. ASSET INTEGRITY MANAGEMENT MARKET SIZE, 2018-2030 (USD MILLION)
- FIGURE 4. ASSET INTEGRITY MANAGEMENT MARKET SIZE, BY REGION, 2023 VS 2030 (%)
- FIGURE 5. ASSET INTEGRITY MANAGEMENT MARKET SIZE, BY REGION, 2023 VS 2024 VS 2030 (USD MILLION)
- FIGURE 6. ASSET INTEGRITY MANAGEMENT MARKET DYNAMICS
- FIGURE 7. ASSET INTEGRITY MANAGEMENT MARKET SIZE, BY OFFERING, 2023 VS 2030 (%)
- FIGURE 8. ASSET INTEGRITY MANAGEMENT MARKET SIZE, BY OFFERING, 2023 VS 2024 VS 2030 (USD MILLION)
- FIGURE 9. ASSET INTEGRITY MANAGEMENT MARKET SIZE, BY METHODOLOGIES, 2023 VS 2030 (%)
- FIGURE 10. ASSET INTEGRITY MANAGEMENT MARKET SIZE, BY METHODOLOGIES, 2023 VS 2024 VS 2030 (USD MILLION)
- FIGURE 11. ASSET INTEGRITY MANAGEMENT MARKET SIZE, BY INDUSTRY, 2023 VS 2030 (%)
- FIGURE 12. ASSET INTEGRITY MANAGEMENT MARKET SIZE, BY INDUSTRY, 2023 VS 2024 VS 2030 (USD MILLION)
- FIGURE 13. AMERICAS ASSET INTEGRITY MANAGEMENT MARKET SIZE, BY COUNTRY, 2023 VS 2030 (%)
- FIGURE 14. AMERICAS ASSET INTEGRITY MANAGEMENT MARKET SIZE, BY COUNTRY, 2023 VS 2024 VS 2030 (USD MILLION)
- FIGURE 15. UNITED STATES ASSET INTEGRITY MANAGEMENT MARKET SIZE, BY STATE, 2023 VS 2030 (%)
- FIGURE 16. UNITED STATES ASSET INTEGRITY MANAGEMENT MARKET SIZE, BY STATE, 2023 VS 2024 VS 2030 (USD MILLION)
- FIGURE 17. ASIA-PACIFIC ASSET INTEGRITY MANAGEMENT MARKET SIZE, BY COUNTRY, 2023 VS 2030 (%)
- FIGURE 18. ASIA-PACIFIC ASSET INTEGRITY MANAGEMENT MARKET SIZE, BY COUNTRY, 2023 VS 2024 VS 2030 (USD MILLION)
- FIGURE 19. EUROPE, MIDDLE EAST & AFRICA ASSET INTEGRITY MANAGEMENT MARKET SIZE, BY COUNTRY, 2023 VS 2030 (%)
- FIGURE 20. EUROPE, MIDDLE EAST & AFRICA ASSET INTEGRITY MANAGEMENT MARKET SIZE, BY COUNTRY, 2023 VS 2024 VS 2030 (USD MILLION)
- FIGURE 21. ASSET INTEGRITY MANAGEMENT MARKET, FPNV POSITIONING MATRIX, 2023
- FIGURE 22. ASSET INTEGRITY MANAGEMENT MARKET SHARE, BY KEY PLAYER, 2023
LIST OF TABLES
- TABLE 1. ASSET INTEGRITY MANAGEMENT MARKET SEGMENTATION & COVERAGE
- TABLE 2. UNITED STATES DOLLAR EXCHANGE RATE, 2018-2023
- TABLE 3. ASSET INTEGRITY MANAGEMENT MARKET SIZE, 2018-2030 (USD MILLION)
- TABLE 4. GLOBAL ASSET INTEGRITY MANAGEMENT MARKET SIZE, BY REGION, 2018-2030 (USD MILLION)
- TABLE 5. ASSET INTEGRITY MANAGEMENT MARKET SIZE, BY OFFERING, 2018-2030 (USD MILLION)
- TABLE 6. ASSET INTEGRITY MANAGEMENT MARKET SIZE, BY HARDWARE, BY REGION, 2018-2030 (USD MILLION)
- TABLE 7. ASSET INTEGRITY MANAGEMENT MARKET SIZE, BY SERVICES, BY REGION, 2018-2030 (USD MILLION)
- TABLE 8. ASSET INTEGRITY MANAGEMENT MARKET SIZE, BY SOFTWARE, BY REGION, 2018-2030 (USD MILLION)
- TABLE 9. ASSET INTEGRITY MANAGEMENT MARKET SIZE, BY METHODOLOGIES, 2018-2030 (USD MILLION)
- TABLE 10. ASSET INTEGRITY MANAGEMENT MARKET SIZE, BY CONDITION MONITORING STUDIES, BY REGION, 2018-2030 (USD MILLION)
- TABLE 11. ASSET INTEGRITY MANAGEMENT MARKET SIZE, BY DAMAGE IDENTIFICATION & RISK ASSESSMENT, BY REGION, 2018-2030 (USD MILLION)
- TABLE 12. ASSET INTEGRITY MANAGEMENT MARKET SIZE, BY PROCESS SYSTEM INTEGRITY STUDIES, BY REGION, 2018-2030 (USD MILLION)
- TABLE 13. ASSET INTEGRITY MANAGEMENT MARKET SIZE, BY RELIABILITY-CENTRED MAINTENANCE, BY REGION, 2018-2030 (USD MILLION)
- TABLE 14. ASSET INTEGRITY MANAGEMENT MARKET SIZE, BY RISK-BASED INSPECTION, BY REGION, 2018-2030 (USD MILLION)
- TABLE 15. ASSET INTEGRITY MANAGEMENT MARKET SIZE, BY SAFETY & RISK MANAGEMENT (HAZID, HAZOP AND QRA), BY REGION, 2018-2030 (USD MILLION)
- TABLE 16. ASSET INTEGRITY MANAGEMENT MARKET SIZE, BY SAFETY INTEGRITY LEVEL (SIL) STUDIES, BY REGION, 2018-2030 (USD MILLION)
- TABLE 17. ASSET INTEGRITY MANAGEMENT MARKET SIZE, BY INDUSTRY, 2018-2030 (USD MILLION)
- TABLE 18. ASSET INTEGRITY MANAGEMENT MARKET SIZE, BY AEROSPACE, BY REGION, 2018-2030 (USD MILLION)
- TABLE 19. ASSET INTEGRITY MANAGEMENT MARKET SIZE, BY MINING, BY REGION, 2018-2030 (USD MILLION)
- TABLE 20. ASSET INTEGRITY MANAGEMENT MARKET SIZE, BY OIL & GAS, BY REGION, 2018-2030 (USD MILLION)
- TABLE 21. ASSET INTEGRITY MANAGEMENT MARKET SIZE, BY POWER, BY REGION, 2018-2030 (USD MILLION)
- TABLE 22. AMERICAS ASSET INTEGRITY MANAGEMENT MARKET SIZE, BY OFFERING, 2018-2030 (USD MILLION)
- TABLE 23. AMERICAS ASSET INTEGRITY MANAGEMENT MARKET SIZE, BY METHODOLOGIES, 2018-2030 (USD MILLION)
- TABLE 24. AMERICAS ASSET INTEGRITY MANAGEMENT MARKET SIZE, BY INDUSTRY, 2018-2030 (USD MILLION)
- TABLE 25. AMERICAS ASSET INTEGRITY MANAGEMENT MARKET SIZE, BY COUNTRY, 2018-2030 (USD MILLION)
- TABLE 26. ARGENTINA ASSET INTEGRITY MANAGEMENT MARKET SIZE, BY OFFERING, 2018-2030 (USD MILLION)
- TABLE 27. ARGENTINA ASSET INTEGRITY MANAGEMENT MARKET SIZE, BY METHODOLOGIES, 2018-2030 (USD MILLION)
- TABLE 28. ARGENTINA ASSET INTEGRITY MANAGEMENT MARKET SIZE, BY INDUSTRY, 2018-2030 (USD MILLION)
- TABLE 29. BRAZIL ASSET INTEGRITY MANAGEMENT MARKET SIZE, BY OFFERING, 2018-2030 (USD MILLION)
- TABLE 30. BRAZIL ASSET INTEGRITY MANAGEMENT MARKET SIZE, BY METHODOLOGIES, 2018-2030 (USD MILLION)
- TABLE 31. BRAZIL ASSET INTEGRITY MANAGEMENT MARKET SIZE, BY INDUSTRY, 2018-2030 (USD MILLION)
- TABLE 32. CANADA ASSET INTEGRITY MANAGEMENT MARKET SIZE, BY OFFERING, 2018-2030 (USD MILLION)
- TABLE 33. CANADA ASSET INTEGRITY MANAGEMENT MARKET SIZE, BY METHODOLOGIES, 2018-2030 (USD MILLION)
- TABLE 34. CANADA ASSET INTEGRITY MANAGEMENT MARKET SIZE, BY INDUSTRY, 2018-2030 (USD MILLION)
- TABLE 35. MEXICO ASSET INTEGRITY MANAGEMENT MARKET SIZE, BY OFFERING, 2018-2030 (USD MILLION)
- TABLE 36. MEXICO ASSET INTEGRITY MANAGEMENT MARKET SIZE, BY METHODOLOGIES, 2018-2030 (USD MILLION)
- TABLE 37. MEXICO ASSET INTEGRITY MANAGEMENT MARKET SIZE, BY INDUSTRY, 2018-2030 (USD MILLION)
- TABLE 38. UNITED STATES ASSET INTEGRITY MANAGEMENT MARKET SIZE, BY OFFERING, 2018-2030 (USD MILLION)
- TABLE 39. UNITED STATES ASSET INTEGRITY MANAGEMENT MARKET SIZE, BY METHODOLOGIES, 2018-2030 (USD MILLION)
- TABLE 40. UNITED STATES ASSET INTEGRITY MANAGEMENT MARKET SIZE, BY INDUSTRY, 2018-2030 (USD MILLION)
- TABLE 41. UNITED STATES ASSET INTEGRITY MANAGEMENT MARKET SIZE, BY STATE, 2018-2030 (USD MILLION)
- TABLE 42. ASIA-PACIFIC ASSET INTEGRITY MANAGEMENT MARKET SIZE, BY OFFERING, 2018-2030 (USD MILLION)
- TABLE 43. ASIA-PACIFIC ASSET INTEGRITY MANAGEMENT MARKET SIZE, BY METHODOLOGIES, 2018-2030 (USD MILLION)
- TABLE 44. ASIA-PACIFIC ASSET INTEGRITY MANAGEMENT MARKET SIZE, BY INDUSTRY, 2018-2030 (USD MILLION)
- TABLE 45. ASIA-PACIFIC ASSET INTEGRITY MANAGEMENT MARKET SIZE, BY COUNTRY, 2018-2030 (USD MILLION)
- TABLE 46. AUSTRALIA ASSET INTEGRITY MANAGEMENT MARKET SIZE, BY OFFERING, 2018-2030 (USD MILLION)
- TABLE 47. AUSTRALIA ASSET INTEGRITY MANAGEMENT MARKET SIZE, BY METHODOLOGIES, 2018-2030 (USD MILLION)
- TABLE 48. AUSTRALIA ASSET INTEGRITY MANAGEMENT MARKET SIZE, BY INDUSTRY, 2018-2030 (USD MILLION)
- TABLE 49. CHINA ASSET INTEGRITY MANAGEMENT MARKET SIZE, BY OFFERING, 2018-2030 (USD MILLION)
- TABLE 50. CHINA ASSET INTEGRITY MANAGEMENT MARKET SIZE, BY METHODOLOGIES, 2018-2030 (USD MILLION)
- TABLE 51. CHINA ASSET INTEGRITY MANAGEMENT MARKET SIZE, BY INDUSTRY, 2018-2030 (USD MILLION)
- TABLE 52. INDIA ASSET INTEGRITY MANAGEMENT MARKET SIZE, BY OFFERING, 2018-2030 (USD MILLION)
- TABLE 53. INDIA ASSET INTEGRITY MANAGEMENT MARKET SIZE, BY METHODOLOGIES, 2018-2030 (USD MILLION)
- TABLE 54. INDIA ASSET INTEGRITY MANAGEMENT MARKET SIZE, BY INDUSTRY, 2018-2030 (USD MILLION)
- TABLE 55. INDONESIA ASSET INTEGRITY MANAGEMENT MARKET SIZE, BY OFFERING, 2018-2030 (USD MILLION)
- TABLE 56. INDONESIA ASSET INTEGRITY MANAGEMENT MARKET SIZE, BY METHODOLOGIES, 2018-2030 (USD MILLION)
- TABLE 57. INDONESIA ASSET INTEGRITY MANAGEMENT MARKET SIZE, BY INDUSTRY, 2018-2030 (USD MILLION)
- TABLE 58. JAPAN ASSET INTEGRITY MANAGEMENT MARKET SIZE, BY OFFERING, 2018-2030 (USD MILLION)
- TABLE 59. JAPAN ASSET INTEGRITY MANAGEMENT MARKET SIZE, BY METHODOLOGIES, 2018-2030 (USD MILLION)
- TABLE 60. JAPAN ASSET INTEGRITY MANAGEMENT MARKET SIZE, BY INDUSTRY, 2018-2030 (USD MILLION)
- TABLE 61. MALAYSIA ASSET INTEGRITY MANAGEMENT MARKET SIZE, BY OFFERING, 2018-2030 (USD MILLION)
- TABLE 62. MALAYSIA ASSET INTEGRITY MANAGEMENT MARKET SIZE, BY METHODOLOGIES, 2018-2030 (USD MILLION)
- TABLE 63. MALAYSIA ASSET INTEGRITY MANAGEMENT MARKET SIZE, BY INDUSTRY, 2018-2030 (USD MILLION)
- TABLE 64. PHILIPPINES ASSET INTEGRITY MANAGEMENT MARKET SIZE, BY OFFERING, 2018-2030 (USD MILLION)
- TABLE 65. PHILIPPINES ASSET INTEGRITY MANAGEMENT MARKET SIZE, BY METHODOLOGIES, 2018-2030 (USD MILLION)
- TABLE 66. PHILIPPINES ASSET INTEGRITY MANAGEMENT MARKET SIZE, BY INDUSTRY, 2018-2030 (USD MILLION)
- TABLE 67. SINGAPORE ASSET INTEGRITY MANAGEMENT MARKET SIZE, BY OFFERING, 2018-2030 (USD MILLION)
- TABLE 68. SINGAPORE ASSET INTEGRITY MANAGEMENT MARKET SIZE, BY METHODOLOGIES, 2018-2030 (USD MILLION)
- TABLE 69. SINGAPORE ASSET INTEGRITY MANAGEMENT MARKET SIZE, BY INDUSTRY, 2018-2030 (USD MILLION)
- TABLE 70. SOUTH KOREA ASSET INTEGRITY MANAGEMENT MARKET SIZE, BY OFFERING, 2018-2030 (USD MILLION)
- TABLE 71. SOUTH KOREA ASSET INTEGRITY MANAGEMENT MARKET SIZE, BY METHODOLOGIES, 2018-2030 (USD MILLION)
- TABLE 72. SOUTH KOREA ASSET INTEGRITY MANAGEMENT MARKET SIZE, BY INDUSTRY, 2018-2030 (USD MILLION)
- TABLE 73. TAIWAN ASSET INTEGRITY MANAGEMENT MARKET SIZE, BY OFFERING, 2018-2030 (USD MILLION)
- TABLE 74. TAIWAN ASSET INTEGRITY MANAGEMENT MARKET SIZE, BY METHODOLOGIES, 2018-2030 (USD MILLION)
- TABLE 75. TAIWAN ASSET INTEGRITY MANAGEMENT MARKET SIZE, BY INDUSTRY, 2018-2030 (USD MILLION)
- TABLE 76. THAILAND ASSET INTEGRITY MANAGEMENT MARKET SIZE, BY OFFERING, 2018-2030 (USD MILLION)
- TABLE 77. THAILAND ASSET INTEGRITY MANAGEMENT MARKET SIZE, BY METHODOLOGIES, 2018-2030 (USD MILLION)
- TABLE 78. THAILAND ASSET INTEGRITY MANAGEMENT MARKET SIZE, BY INDUSTRY, 2018-2030 (USD MILLION)
- TABLE 79. VIETNAM ASSET INTEGRITY MANAGEMENT MARKET SIZE, BY OFFERING, 2018-2030 (USD MILLION)
- TABLE 80. VIETNAM ASSET INTEGRITY MANAGEMENT MARKET SIZE, BY METHODOLOGIES, 2018-2030 (USD MILLION)
- TABLE 81. VIETNAM ASSET INTEGRITY MANAGEMENT MARKET SIZE, BY INDUSTRY, 2018-2030 (USD MILLION)
- TABLE 82. EUROPE, MIDDLE EAST & AFRICA ASSET INTEGRITY MANAGEMENT MARKET SIZE, BY OFFERING, 2018-2030 (USD MILLION)
- TABLE 83. EUROPE, MIDDLE EAST & AFRICA ASSET INTEGRITY MANAGEMENT MARKET SIZE, BY METHODOLOGIES, 2018-2030 (USD MILLION)
- TABLE 84. EUROPE, MIDDLE EAST & AFRICA ASSET INTEGRITY MANAGEMENT MARKET SIZE, BY INDUSTRY, 2018-2030 (USD MILLION)
- TABLE 85. EUROPE, MIDDLE EAST & AFRICA ASSET INTEGRITY MANAGEMENT MARKET SIZE, BY COUNTRY, 2018-2030 (USD MILLION)
- TABLE 86. DENMARK ASSET INTEGRITY MANAGEMENT MARKET SIZE, BY OFFERING, 2018-2030 (USD MILLION)
- TABLE 87. DENMARK ASSET INTEGRITY MANAGEMENT MARKET SIZE, BY METHODOLOGIES, 2018-2030 (USD MILLION)
- TABLE 88. DENMARK ASSET INTEGRITY MANAGEMENT MARKET SIZE, BY INDUSTRY, 2018-2030 (USD MILLION)
- TABLE 89. EGYPT ASSET INTEGRITY MANAGEMENT MARKET SIZE, BY OFFERING, 2018-2030 (USD MILLION)
- TABLE 90. EGYPT ASSET INTEGRITY MANAGEMENT MARKET SIZE, BY METHODOLOGIES, 2018-2030 (USD MILLION)
- TABLE 91. EGYPT ASSET INTEGRITY MANAGEMENT MARKET SIZE, BY INDUSTRY, 2018-2030 (USD MILLION)
- TABLE 92. FINLAND ASSET INTEGRITY MANAGEMENT MARKET SIZE, BY OFFERING, 2018-2030 (USD MILLION)
- TABLE 93. FINLAND ASSET INTEGRITY MANAGEMENT MARKET SIZE, BY METHODOLOGIES, 2018-2030 (USD MILLION)
- TABLE 94. FINLAND ASSET INTEGRITY MANAGEMENT MARKET SIZE, BY INDUSTRY, 2018-2030 (USD MILLION)
- TABLE 95. FRANCE ASSET INTEGRITY MANAGEMENT MARKET SIZE, BY OFFERING, 2018-2030 (USD MILLION)
- TABLE 96. FRANCE ASSET INTEGRITY MANAGEMENT MARKET SIZE, BY METHODOLOGIES, 2018-2030 (USD MILLION)
- TABLE 97. FRANCE ASSET INTEGRITY MANAGEMENT MARKET SIZE, BY INDUSTRY, 2018-2030 (USD MILLION)
- TABLE 98. GERMANY ASSET INTEGRITY MANAGEMENT MARKET SIZE, BY OFFERING, 2018-2030 (USD MILLION)
- TABLE 99. GERMANY ASSET INTEGRITY MANAGEMENT MARKET SIZE, BY METHODOLOGIES, 2018-2030 (USD MILLION)
- TABLE 100. GERMANY ASSET INTEGRITY MANAGEMENT MARKET SIZE, BY INDUSTRY, 2018-2030 (USD MILLION)
- TABLE 101. ISRAEL ASSET INTEGRITY MANAGEMENT MARKET SIZE, BY OFFERING, 2018-2030 (USD MILLION)
- TABLE 102. ISRAEL ASSET INTEGRITY MANAGEMENT MARKET SIZE, BY METHODOLOGIES, 2018-2030 (USD MILLION)
- TABLE 103. ISRAEL ASSET INTEGRITY MANAGEMENT MARKET SIZE, BY INDUSTRY, 2018-2030 (USD MILLION)
- TABLE 104. ITALY ASSET INTEGRITY MANAGEMENT MARKET SIZE, BY OFFERING, 2018-2030 (USD MILLION)
- TABLE 105. ITALY ASSET INTEGRITY MANAGEMENT MARKET SIZE, BY METHODOLOGIES, 2018-2030 (USD MILLION)
- TABLE 106. ITALY ASSET INTEGRITY MANAGEMENT MARKET SIZE, BY INDUSTRY, 2018-2030 (USD MILLION)
- TABLE 107. NETHERLANDS ASSET INTEGRITY MANAGEMENT MARKET SIZE, BY OFFERING, 2018-2030 (USD MILLION)
- TABLE 108. NETHERLANDS ASSET INTEGRITY MANAGEMENT MARKET SIZE, BY METHODOLOGIES, 2018-2030 (USD MILLION)
- TABLE 109. NETHERLANDS ASSET INTEGRITY MANAGEMENT MARKET SIZE, BY INDUSTRY, 2018-2030 (USD MILLION)
- TABLE 110. NIGERIA ASSET INTEGRITY MANAGEMENT MARKET SIZE, BY OFFERING, 2018-2030 (USD MILLION)
- TABLE 111. NIGERIA ASSET INTEGRITY MANAGEMENT MARKET SIZE, BY METHODOLOGIES, 2018-2030 (USD MILLION)
- TABLE 112. NIGERIA ASSET INTEGRITY MANAGEMENT MARKET SIZE, BY INDUSTRY, 2018-2030 (USD MILLION)
- TABLE 113. NORWAY ASSET INTEGRITY MANAGEMENT MARKET SIZE, BY OFFERING, 2018-2030 (USD MILLION)
- TABLE 114. NORWAY ASSET INTEGRITY MANAGEMENT MARKET SIZE, BY METHODOLOGIES, 2018-2030 (USD MILLION)
- TABLE 115. NORWAY ASSET INTEGRITY MANAGEMENT MARKET SIZE, BY INDUSTRY, 2018-2030 (USD MILLION)
- TABLE 116. POLAND ASSET INTEGRITY MANAGEMENT MARKET SIZE, BY OFFERING, 2018-2030 (USD MILLION)
- TABLE 117. POLAND ASSET INTEGRITY MANAGEMENT MARKET SIZE, BY METHODOLOGIES, 2018-2030 (USD MILLION)
- TABLE 118. POLAND ASSET INTEGRITY MANAGEMENT MARKET SIZE, BY INDUSTRY, 2018-2030 (USD MILLION)
- TABLE 119. QATAR ASSET INTEGRITY MANAGEMENT MARKET SIZE, BY OFFERING, 2018-2030 (USD MILLION)
- TABLE 120. QATAR ASSET INTEGRITY MANAGEMENT MARKET SIZE, BY METHODOLOGIES, 2018-2030 (USD MILLION)
- TABLE 121. QATAR ASSET INTEGRITY MANAGEMENT MARKET SIZE, BY INDUSTRY, 2018-2030 (USD MILLION)
- TABLE 122. RUSSIA ASSET INTEGRITY MANAGEMENT MARKET SIZE, BY OFFERING, 2018-2030 (USD MILLION)
- TABLE 123. RUSSIA ASSET INTEGRITY MANAGEMENT MARKET SIZE, BY METHODOLOGIES, 2018-2030 (USD MILLION)
- TABLE 124. RUSSIA ASSET INTEGRITY MANAGEMENT MARKET SIZE, BY INDUSTRY, 2018-2030 (USD MILLION)
- TABLE 125. SAUDI ARABIA ASSET INTEGRITY MANAGEMENT MARKET SIZE, BY OFFERING, 2018-2030 (USD MILLION)
- TABLE 126. SAUDI ARABIA ASSET INTEGRITY MANAGEMENT MARKET SIZE, BY METHODOLOGIES, 2018-2030 (USD MILLION)
- TABLE 127. SAUDI ARABIA ASSET INTEGRITY MANAGEMENT MARKET SIZE, BY INDUSTRY, 2018-2030 (USD MILLION)
- TABLE 128. SOUTH AFRICA ASSET INTEGRITY MANAGEMENT MARKET SIZE, BY OFFERING, 2018-2030 (USD MILLION)
- TABLE 129. SOUTH AFRICA ASSET INTEGRITY MANAGEMENT MARKET SIZE, BY METHODOLOGIES, 2018-2030 (USD MILLION)
- TABLE 130. SOUTH AFRICA ASSET INTEGRITY MANAGEMENT MARKET SIZE, BY INDUSTRY, 2018-2030 (USD MILLION)
- TABLE 131. SPAIN ASSET INTEGRITY MANAGEMENT MARKET SIZE, BY OFFERING, 2018-2030 (USD MILLION)
- TABLE 132. SPAIN ASSET INTEGRITY MANAGEMENT MARKET SIZE, BY METHODOLOGIES, 2018-2030 (USD MILLION)
- TABLE 133. SPAIN ASSET INTEGRITY MANAGEMENT MARKET SIZE, BY INDUSTRY, 2018-2030 (USD MILLION)
- TABLE 134. SWEDEN ASSET INTEGRITY MANAGEMENT MARKET SIZE, BY OFFERING, 2018-2030 (USD MILLION)
- TABLE 135. SWEDEN ASSET INTEGRITY MANAGEMENT MARKET SIZE, BY METHODOLOGIES, 2018-2030 (USD MILLION)
- TABLE 136. SWEDEN ASSET INTEGRITY MANAGEMENT MARKET SIZE, BY INDUSTRY, 2018-2030 (USD MILLION)
- TABLE 137. SWITZERLAND ASSET INTEGRITY MANAGEMENT MARKET SIZE, BY OFFERING, 2018-2030 (USD MILLION)
- TABLE 138. SWITZERLAND ASSET INTEGRITY MANAGEMENT MARKET SIZE, BY METHODOLOGIES, 2018-2030 (USD MILLION)
- TABLE 139. SWITZERLAND ASSET INTEGRITY MANAGEMENT MARKET SIZE, BY INDUSTRY, 2018-2030 (USD MILLION)
- TABLE 140. TURKEY ASSET INTEGRITY MANAGEMENT MARKET SIZE, BY OFFERING, 2018-2030 (USD MILLION)
- TABLE 141. TURKEY ASSET INTEGRITY MANAGEMENT MARKET SIZE, BY METHODOLOGIES, 2018-2030 (USD MILLION)
- TABLE 142. TURKEY ASSET INTEGRITY MANAGEMENT MARKET SIZE, BY INDUSTRY, 2018-2030 (USD MILLION)
- TABLE 143. UNITED ARAB EMIRATES ASSET INTEGRITY MANAGEMENT MARKET SIZE, BY OFFERING, 2018-2030 (USD MILLION)
- TABLE 144. UNITED ARAB EMIRATES ASSET INTEGRITY MANAGEMENT MARKET SIZE, BY METHODOLOGIES, 2018-2030 (USD MILLION)
- TABLE 145. UNITED ARAB EMIRATES ASSET INTEGRITY MANAGEMENT MARKET SIZE, BY INDUSTRY, 2018-2030 (USD MILLION)
- TABLE 146. UNITED KINGDOM ASSET INTEGRITY MANAGEMENT MARKET SIZE, BY OFFERING, 2018-2030 (USD MILLION)
- TABLE 147. UNITED KINGDOM ASSET INTEGRITY MANAGEMENT MARKET SIZE, BY METHODOLOGIES, 2018-2030 (USD MILLION)
- TABLE 148. UNITED KINGDOM ASSET INTEGRITY MANAGEMENT MARKET SIZE, BY INDUSTRY, 2018-2030 (USD MILLION)
- TABLE 149. ASSET INTEGRITY MANAGEMENT MARKET, FPNV POSITIONING MATRIX, 2023
- TABLE 150. ASSET INTEGRITY MANAGEMENT MARKET SHARE, BY KEY PLAYER, 2023
- TABLE 151. ASSET INTEGRITY MANAGEMENT MARKET LICENSE & PRICING
 全球資產完整性管理市場:按服務類型 - 預測(至 2029 年)
 資產完整性管理市場規模和預測(2020 - 2030)、全球和地區佔有率、趨勢和成長機會分析報告範圍:按服務類型和行業(石油和天然氣、電力、船舶、採礦、航太等)
 資產完整性管理全球市場報告 2024年
 0資產完整性管理的全球市場
 資產完整性管理(AIM)全球市場規模、份額、行業趨勢分析報告:按行業(石油和天然氣、電力、採礦、航空航天、其他)、服務類型、區域展望和預測2022-2028
 資產保全管理的全球市場預測(~2028年):服務類型,終端用戶,各地區的分析
 資產保全管理的全球市場規模:各服務形式,各業界,各地區的預測(2022年~2028年)