


 |
市場調查報告書
商品編碼
1415461
教育領域的元宇宙市場:按組成部分、最終用戶分類 - 2024-2030 年全球預測Metaverse in Education Market by Component (Hardware, Services, Software), End-User (Corporate, Education) - Global Forecast 2024-2030 |
||||||
※ 本網頁內容可能與最新版本有所差異。詳細情況請與我們聯繫。
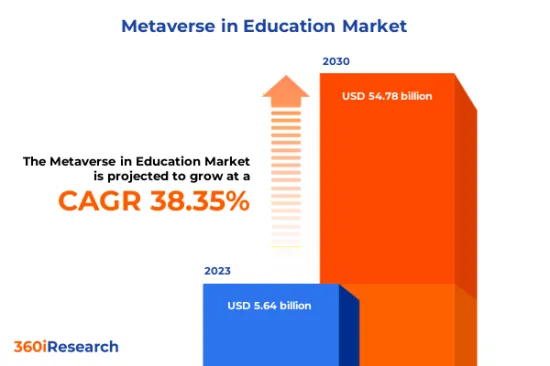
預計2023年元宇宙教育市場規模為56.4億美元,2024年達76.8億美元,預計2030年將達547.8億美元,複合年成長率為38.35%。
元宇宙全球教育領域市場
| 主要市場統計 | |
|---|---|
| 基準年[2023] | 56.4億美元 |
| 預測年份 [2024] | 76.8億美元 |
| 預測年份 [2030] | 547.8億美元 |
| 複合年成長率(%) | 38.35% |
教育領域的元宇宙利用基於虛擬和擴增實境實境的互連宇宙的力量來實現教育目的。這個市場包括身臨其境型學習體驗、線上課堂、協作平台、3D模擬、培訓模組和互動內容的開拓和部署,以增強正式和非正式學習環境中的傳統教學方法。應用範圍從為年輕學習者提供身臨其境型講故事到為醫療保健、工程、設計甚至娛樂等行業的專業人士提供複雜的技能開發。隨著數位學習的日益普及,人們對身臨其境型學習環境的興趣日益濃厚,正在推動市場成長。此外,AR/VR 技術的快速進步帶來了更實惠的硬體選擇和複雜的軟體平台,可以滿足各種學習需求。此外,教育領域與元宇宙相關的高成本限制了元宇宙在教育領域的採用。虛擬學習環境中的大量資料收集引起了對使用者隱私和安全漏洞的擔憂。全球擴大採用 5G 技術,以及機器學習和人工智慧的進步,為市場成長創造了利潤豐厚的機會。
區域洞察
包括美國和加拿大在內的美國國家正在擴大投資用於教育目的的虛擬實境和擴增實境技術。該地區著名的高等教育機構正在利用 VR/AR 技術提供身臨其境型學習體驗。此外,Google LLC 和 Meta Platforms, Inc. 等科技公司正在大力投資這些技術,推動該地區的成長。歐盟 (EU) 處於教育領域採用新興技術的最前線。歐盟資助計畫正在資助多個與身臨其境型技術相關的研究計劃,例如用於終身學習的 AR/VR。此外,德國、法國等國家正透過工業4.0等國家戰略積極推動數位技能的發展。亞太地區主要經濟體的政府正致力於將先進技術融入其教育體系。中國、日本和印度已與學校建立合作夥伴關係,將 AR/VR 技術用於教育目的。
FPNV定位矩陣
FPNV定位矩陣對於評估元宇宙教育市場至關重要。我們檢視與業務策略和產品滿意度相關的關鍵指標,以對供應商進行全面評估。這種深入的分析使用戶能夠根據自己的要求做出明智的決策。根據評估,供應商被分為四個成功程度不同的像限:前沿(F)、探路者(P)、利基(N)和重要(V)。
市場佔有率分析
市場佔有率分析是一個綜合工具,可以對教育市場元宇宙供應商的現狀進行深入而深入的研究。全面比較和分析供應商在整體收益、基本客群和其他關鍵指標方面的貢獻,以便更好地了解公司的績效及其在爭奪市場佔有率時面臨的挑戰。此外,該分析還提供了對該行業競爭特徵的寶貴考察,包括在研究基準年觀察到的累積、分散主導地位和合併特徵等因素。這種詳細程度的提高使供應商能夠做出更明智的決策並制定有效的策略,從而在市場上獲得競爭優勢。
該報告對以下幾個方面提供了寶貴的見解:
1-市場滲透率:提供有關主要企業所服務的市場的全面資訊。
2-市場開拓:我們深入研究利潤豐厚的新興市場,並分析它們在成熟細分市場中的滲透率。
3- 市場多元化:提供有關新產品發布、開拓地區、最新發展和投資的詳細資訊。
4-競爭力評估與資訊:對主要企業的市場佔有率、策略、產品、認證、監管狀況、專利狀況、製造能力等進行全面評估。
5- 產品開發與創新:提供對未來技術、研發活動和突破性產品開發的見解。
本報告解決了以下關鍵問題:
1-元界元宇宙領域市場規模及預測是多少?
2-元界元宇宙市場預測期內需要考慮投資的產品、細分市場、應用程式和領域有哪些?
3-教育領域元宇宙市場的技術趨勢和法律規範是什麼?
4-元宇宙教育領域主要廠商的市場佔有率是多少?
5-教育領域進入元宇宙市場的合適型態和戰略手段是什麼?
目錄
第1章 前言
第2章調查方法
第3章執行摘要
第4章市場概況
第5章市場洞察
- 市場動態
- 促進因素
- 加大向工業培訓和教育領域的拓展
- 隨著數位學習採用的增加,人們對身臨其境型學習環境的興趣也增加。
- 擴增實境(AR) 和虛擬實境 (VR) 的應用日益廣泛
- 抑制因素
- 與教育元宇宙相關的高成本
- 機會
- 將機器學習 (ML) 和人工智慧 (AI) 整合到教育的元宇宙中
- 5G技術在全球加速部署
- 任務
- 過度使用導致的心理健康問題
- 促進因素
- 市場區隔分析
- 組成部分:擴大軟體在虛擬互動元宇宙教育中的作用
- 最終用戶:在教育中更多地採用元宇宙以促進互動學習
- 市場趨勢分析
- 高通膨的累積效應
- 波特五力分析
- 價值鍊和關鍵路徑分析
- 法律規範
第6章 教育領域元宇宙市場:依組成部分
- 硬體
- 擴增實境設備
- 磁振造影設備
- 虛擬實境設備
- 服務
- 軟體
第7章 教育領域元宇宙市場:依最終使用者分類
- 對於企業
- 教育
第8章 美洲教育領域元元宇宙市場
- 阿根廷
- 巴西
- 加拿大
- 墨西哥
- 美國
第9章 亞太地區教育領域元宇宙市場
- 澳洲
- 中國
- 印度
- 印尼
- 日本
- 馬來西亞
- 菲律賓
- 新加坡
- 韓國
- 台灣
- 泰國
- 越南
第10章 歐洲、中東、非洲教育領域元宇宙市場
- 丹麥
- 埃及
- 芬蘭
- 法國
- 德國
- 以色列
- 義大利
- 荷蘭
- 奈及利亞
- 挪威
- 波蘭
- 卡達
- 俄羅斯
- 沙烏地阿拉伯
- 南非
- 西班牙
- 瑞典
- 瑞士
- 土耳其
- 阿拉伯聯合大公國
- 英國
第11章競爭形勢
- FPNV定位矩陣
- 市場佔有率分析:主要企業
- 主要企業競爭情境分析
- 合約、合作和夥伴關係
- 新產品發布和功能增強
第12章競爭產品組合
- 主要公司簡介
- Axon Park
- BrainCert, Inc.
- Cisco Systems, Inc.
- Dell Inc.
- Digital Samba, SL
- Electa Communications Ltd.
- Hitachi, Ltd.
- Immerse Inc.
- International Business Machines Corporation
- Lenovo Group Limited
- Meta Platforms, Inc.
- Microsoft Corporation
- Niantic, Inc.
- Oracle Corporation
- ThirdEye Gen, Inc.
- Varjo Technologies Oy
- Veative Group
- Vuzix
- 主要產品系列
第13章附錄
- 討論指南
- 關於許可證和定價
[183 Pages Report] The Metaverse in Education Market size was estimated at USD 5.64 billion in 2023 and expected to reach USD 7.68 billion in 2024, at a CAGR 38.35% to reach USD 54.78 billion by 2030.
Global Metaverse in Education Market
| KEY MARKET STATISTICS | |
|---|---|
| Base Year [2023] | USD 5.64 billion |
| Estimated Year [2024] | USD 7.68 billion |
| Forecast Year [2030] | USD 54.78 billion |
| CAGR (%) | 38.35% |
The metaverse in education leverages the capabilities of a virtual and augmented reality-based interconnected universe for educational purposes. This market encompasses the development and deployment of immersive learning experiences, online classrooms, collaborative platforms, 3D simulations, training modules, and interactive content to enhance traditional teaching methods both in formal and informal learning environments. The applications range from immersive storytelling for young learners to complex skills development for professionals across industries like healthcare, engineering, design, and even entertainment. Increasing interest in immersed learning environments with the rise in e-learning adoptions driving the growth of the market. Moreover, the rapid progress in AR/VR technologies has led to more affordable hardware options and sophisticated software platforms that can cater to diverse learning needs. Furthermore, the high cost associated with metaverse in education limits the adoption of metaverse in education. Collecting extensive data in virtual learning environments raises concerns about user privacy and security breaches. Rising deployment of 5G technology across the world and ongoing advancements in machine learning and artificial intelligence create lucrative opportunities for market growth.
Regional Insights
American countries, including the United States and Canada, are increasing investments in virtual reality and augmented reality technologies for educational purposes. Notable higher learning institutions in this region have been leveraging VR/AR technologies for an immersive learning experience. Moreover, technology companies including Google LLC and Meta Platforms, Inc. are investing heavily in these technologies, driving growth in this region. The European Union is at the forefront of adopting emerging technologies for education. The EU's funding initiative has funded several research projects related to immersive technologies like AR/VR for lifelong learning purposes. Additionally, countries including Germany and France are actively promoting digital skills development through national strategies such as Industrie 4.0. In Asia-Pacific's leading economies, governments are focusing on integrating advanced technology into their education systems. China, Japan, and India established partnerships with schools to deploy AR/VR technologies for teaching purposes.
FPNV Positioning Matrix
The FPNV Positioning Matrix is pivotal in evaluating the Metaverse in Education Market. It offers a comprehensive assessment of vendors, examining key metrics related to Business Strategy and Product Satisfaction. This in-depth analysis empowers users to make well-informed decisions aligned with their requirements. Based on the evaluation, the vendors are then categorized into four distinct quadrants representing varying levels of success: Forefront (F), Pathfinder (P), Niche (N), or Vital (V).
Market Share Analysis
The Market Share Analysis is a comprehensive tool that provides an insightful and in-depth examination of the current state of vendors in the Metaverse in Education Market. By meticulously comparing and analyzing vendor contributions in terms of overall revenue, customer base, and other key metrics, we can offer companies a greater understanding of their performance and the challenges they face when competing for market share. Additionally, this analysis provides valuable insights into the competitive nature of the sector, including factors such as accumulation, fragmentation dominance, and amalgamation traits observed over the base year period studied. With this expanded level of detail, vendors can make more informed decisions and devise effective strategies to gain a competitive edge in the market.
Key Company Profiles
The report delves into recent significant developments in the Metaverse in Education Market, highlighting leading vendors and their innovative profiles. These include Axon Park, BrainCert, Inc., Cisco Systems, Inc., Dell Inc., Digital Samba, SL, Electa Communications Ltd., Hitachi, Ltd., Immerse Inc., International Business Machines Corporation, Lenovo Group Limited, Meta Platforms, Inc., Microsoft Corporation, Niantic, Inc., Oracle Corporation, ThirdEye Gen, Inc., Varjo Technologies Oy, Veative Group, and Vuzix.
Market Segmentation & Coverage
This research report categorizes the Metaverse in Education Market to forecast the revenues and analyze trends in each of the following sub-markets:
- Component
- Hardware
- AR Devices
- MR Devices
- VR Devices
- Services
- Software
- Hardware
- End-User
- Corporate
- Education
- Region
- Americas
- Argentina
- Brazil
- Canada
- Mexico
- United States
- California
- Florida
- Illinois
- New York
- Ohio
- Pennsylvania
- Texas
- Asia-Pacific
- Australia
- China
- India
- Indonesia
- Japan
- Malaysia
- Philippines
- Singapore
- South Korea
- Taiwan
- Thailand
- Vietnam
- Europe, Middle East & Africa
- Denmark
- Egypt
- Finland
- France
- Germany
- Israel
- Italy
- Netherlands
- Nigeria
- Norway
- Poland
- Qatar
- Russia
- Saudi Arabia
- South Africa
- Spain
- Sweden
- Switzerland
- Turkey
- United Arab Emirates
- United Kingdom
- Americas
The report offers valuable insights on the following aspects:
1. Market Penetration: It presents comprehensive information on the market provided by key players.
2. Market Development: It delves deep into lucrative emerging markets and analyzes the penetration across mature market segments.
3. Market Diversification: It provides detailed information on new product launches, untapped geographic regions, recent developments, and investments.
4. Competitive Assessment & Intelligence: It conducts an exhaustive assessment of market shares, strategies, products, certifications, regulatory approvals, patent landscape, and manufacturing capabilities of the leading players.
5. Product Development & Innovation: It offers intelligent insights on future technologies, R&D activities, and breakthrough product developments.
The report addresses key questions such as:
1. What is the market size and forecast of the Metaverse in Education Market?
2. Which products, segments, applications, and areas should one consider investing in over the forecast period in the Metaverse in Education Market?
3. What are the technology trends and regulatory frameworks in the Metaverse in Education Market?
4. What is the market share of the leading vendors in the Metaverse in Education Market?
5. Which modes and strategic moves are suitable for entering the Metaverse in Education Market?
Table of Contents
1. Preface
- 1.1. Objectives of the Study
- 1.2. Market Segmentation & Coverage
- 1.3. Years Considered for the Study
- 1.4. Currency & Pricing
- 1.5. Language
- 1.6. Limitations
- 1.7. Assumptions
- 1.8. Stakeholders
2. Research Methodology
- 2.1. Define: Research Objective
- 2.2. Determine: Research Design
- 2.3. Prepare: Research Instrument
- 2.4. Collect: Data Source
- 2.5. Analyze: Data Interpretation
- 2.6. Formulate: Data Verification
- 2.7. Publish: Research Report
- 2.8. Repeat: Report Update
3. Executive Summary
4. Market Overview
- 4.1. Introduction
- 4.2. Metaverse in Education Market, by Region
5. Market Insights
- 5.1. Market Dynamics
- 5.1.1. Drivers
- 5.1.1.1. Rise in industrial training and deployment in the education sector
- 5.1.1.2. Increasing interest in immersed learning environments with the rise in e-learning adoptions
- 5.1.1.3. Extending adoption of Augmented Reality (AR) and Virtual Reality (VR)
- 5.1.2. Restraints
- 5.1.2.1. High cost associated with metaverse in education
- 5.1.3. Opportunities
- 5.1.3.1. Integration of Machine Learning (ML) and Artificial intelligence (AI) in metaverse in education
- 5.1.3.2. Rising deployment of 5G technology across the world
- 5.1.4. Challenges
- 5.1.4.1. Concerns regarding mental health with excessive use
- 5.1.1. Drivers
- 5.2. Market Segmentation Analysis
- 5.2.1. Component: Expanding role of softwares in metaverse education for virtual interaction
- 5.2.2. End-User: Increasing adoption of metaverse in education to facilitate interactive learning
- 5.3. Market Trend Analysis
- 5.4. Cumulative Impact of High Inflation
- 5.5. Porter's Five Forces Analysis
- 5.5.1. Threat of New Entrants
- 5.5.2. Threat of Substitutes
- 5.5.3. Bargaining Power of Customers
- 5.5.4. Bargaining Power of Suppliers
- 5.5.5. Industry Rivalry
- 5.6. Value Chain & Critical Path Analysis
- 5.7. Regulatory Framework
6. Metaverse in Education Market, by Component
- 6.1. Introduction
- 6.2. Hardware
- 6.3.1. AR Devices
- 6.3.2. MR Devices
- 6.3.3. VR Devices
- 6.3. Services
- 6.4. Software
7. Metaverse in Education Market, by End-User
- 7.1. Introduction
- 7.2. Corporate
- 7.3. Education
8. Americas Metaverse in Education Market
- 8.1. Introduction
- 8.2. Argentina
- 8.3. Brazil
- 8.4. Canada
- 8.5. Mexico
- 8.6. United States
9. Asia-Pacific Metaverse in Education Market
- 9.1. Introduction
- 9.2. Australia
- 9.3. China
- 9.4. India
- 9.5. Indonesia
- 9.6. Japan
- 9.7. Malaysia
- 9.8. Philippines
- 9.9. Singapore
- 9.10. South Korea
- 9.11. Taiwan
- 9.12. Thailand
- 9.13. Vietnam
10. Europe, Middle East & Africa Metaverse in Education Market
- 10.1. Introduction
- 10.2. Denmark
- 10.3. Egypt
- 10.4. Finland
- 10.5. France
- 10.6. Germany
- 10.7. Israel
- 10.8. Italy
- 10.9. Netherlands
- 10.10. Nigeria
- 10.11. Norway
- 10.12. Poland
- 10.13. Qatar
- 10.14. Russia
- 10.15. Saudi Arabia
- 10.16. South Africa
- 10.17. Spain
- 10.18. Sweden
- 10.19. Switzerland
- 10.20. Turkey
- 10.21. United Arab Emirates
- 10.22. United Kingdom
11. Competitive Landscape
- 11.1. FPNV Positioning Matrix
- 11.2. Market Share Analysis, By Key Player
- 11.3. Competitive Scenario Analysis, By Key Player
- 11.3.1. Agreement, Collaboration, & Partnership
- 11.3.1.1. Meta Partner 15 US Universities to Transform Education with Metaverse Technologies
- 11.3.1.2. AICTE & Meta Team Up to Launch 'Creators of Metaverse' Programme for College Students
- 11.3.2. New Product Launch & Enhancement
- 11.3.2.1. Genius Group Launches Genius Metaversity in Partnership with Vatom
- 11.3.1. Agreement, Collaboration, & Partnership
12. Competitive Portfolio
- 12.1. Key Company Profiles
- 12.1.1. Axon Park
- 12.1.2. BrainCert, Inc.
- 12.1.3. Cisco Systems, Inc.
- 12.1.4. Dell Inc.
- 12.1.5. Digital Samba, SL
- 12.1.6. Electa Communications Ltd.
- 12.1.7. Hitachi, Ltd.
- 12.1.8. Immerse Inc.
- 12.1.9. International Business Machines Corporation
- 12.1.10. Lenovo Group Limited
- 12.1.11. Meta Platforms, Inc.
- 12.1.12. Microsoft Corporation
- 12.1.13. Niantic, Inc.
- 12.1.14. Oracle Corporation
- 12.1.15. ThirdEye Gen, Inc.
- 12.1.16. Varjo Technologies Oy
- 12.1.17. Veative Group
- 12.1.18. Vuzix
- 12.2. Key Product Portfolio
13. Appendix
- 13.1. Discussion Guide
- 13.2. License & Pricing
LIST OF FIGURES
- FIGURE 1. METAVERSE IN EDUCATION MARKET RESEARCH PROCESS
- FIGURE 2. METAVERSE IN EDUCATION MARKET SIZE, 2023 VS 2030
- FIGURE 3. METAVERSE IN EDUCATION MARKET SIZE, 2018-2030 (USD MILLION)
- FIGURE 4. METAVERSE IN EDUCATION MARKET SIZE, BY REGION, 2023 VS 2030 (%)
- FIGURE 5. METAVERSE IN EDUCATION MARKET SIZE, BY REGION, 2023 VS 2024 VS 2030 (USD MILLION)
- FIGURE 6. METAVERSE IN EDUCATION MARKET DYNAMICS
- FIGURE 7. METAVERSE IN EDUCATION MARKET SIZE, BY COMPONENT, 2023 VS 2030 (%)
- FIGURE 8. METAVERSE IN EDUCATION MARKET SIZE, BY COMPONENT, 2023 VS 2024 VS 2030 (USD MILLION)
- FIGURE 9. METAVERSE IN EDUCATION MARKET SIZE, BY END-USER, 2023 VS 2030 (%)
- FIGURE 10. METAVERSE IN EDUCATION MARKET SIZE, BY END-USER, 2023 VS 2024 VS 2030 (USD MILLION)
- FIGURE 11. AMERICAS METAVERSE IN EDUCATION MARKET SIZE, BY COUNTRY, 2023 VS 2030 (%)
- FIGURE 12. AMERICAS METAVERSE IN EDUCATION MARKET SIZE, BY COUNTRY, 2023 VS 2024 VS 2030 (USD MILLION)
- FIGURE 13. UNITED STATES METAVERSE IN EDUCATION MARKET SIZE, BY STATE, 2023 VS 2030 (%)
- FIGURE 14. UNITED STATES METAVERSE IN EDUCATION MARKET SIZE, BY STATE, 2023 VS 2024 VS 2030 (USD MILLION)
- FIGURE 15. ASIA-PACIFIC METAVERSE IN EDUCATION MARKET SIZE, BY COUNTRY, 2023 VS 2030 (%)
- FIGURE 16. ASIA-PACIFIC METAVERSE IN EDUCATION MARKET SIZE, BY COUNTRY, 2023 VS 2024 VS 2030 (USD MILLION)
- FIGURE 17. EUROPE, MIDDLE EAST & AFRICA METAVERSE IN EDUCATION MARKET SIZE, BY COUNTRY, 2023 VS 2030 (%)
- FIGURE 18. EUROPE, MIDDLE EAST & AFRICA METAVERSE IN EDUCATION MARKET SIZE, BY COUNTRY, 2023 VS 2024 VS 2030 (USD MILLION)
- FIGURE 19. METAVERSE IN EDUCATION MARKET, FPNV POSITIONING MATRIX, 2023
- FIGURE 20. METAVERSE IN EDUCATION MARKET SHARE, BY KEY PLAYER, 2023
LIST OF TABLES
- TABLE 1. METAVERSE IN EDUCATION MARKET SEGMENTATION & COVERAGE
- TABLE 2. UNITED STATES DOLLAR EXCHANGE RATE, 2018-2023
- TABLE 3. METAVERSE IN EDUCATION MARKET SIZE, 2018-2030 (USD MILLION)
- TABLE 4. GLOBAL METAVERSE IN EDUCATION MARKET SIZE, BY REGION, 2018-2030 (USD MILLION)
- TABLE 5. METAVERSE IN EDUCATION MARKET SIZE, BY COMPONENT, 2018-2030 (USD MILLION)
- TABLE 6. METAVERSE IN EDUCATION MARKET SIZE, BY HARDWARE, BY REGION, 2018-2030 (USD MILLION)
- TABLE 7. METAVERSE IN EDUCATION MARKET SIZE, BY HARDWARE, 2018-2030 (USD MILLION)
- TABLE 8. METAVERSE IN EDUCATION MARKET SIZE, BY AR DEVICES, BY REGION, 2018-2030 (USD MILLION)
- TABLE 9. METAVERSE IN EDUCATION MARKET SIZE, BY MR DEVICES, BY REGION, 2018-2030 (USD MILLION)
- TABLE 10. METAVERSE IN EDUCATION MARKET SIZE, BY VR DEVICES, BY REGION, 2018-2030 (USD MILLION)
- TABLE 11. METAVERSE IN EDUCATION MARKET SIZE, BY SERVICES, BY REGION, 2018-2030 (USD MILLION)
- TABLE 12. METAVERSE IN EDUCATION MARKET SIZE, BY SOFTWARE, BY REGION, 2018-2030 (USD MILLION)
- TABLE 13. METAVERSE IN EDUCATION MARKET SIZE, BY END-USER, 2018-2030 (USD MILLION)
- TABLE 14. METAVERSE IN EDUCATION MARKET SIZE, BY CORPORATE, BY REGION, 2018-2030 (USD MILLION)
- TABLE 15. METAVERSE IN EDUCATION MARKET SIZE, BY EDUCATION, BY REGION, 2018-2030 (USD MILLION)
- TABLE 16. AMERICAS METAVERSE IN EDUCATION MARKET SIZE, BY COMPONENT, 2018-2030 (USD MILLION)
- TABLE 17. AMERICAS METAVERSE IN EDUCATION MARKET SIZE, BY HARDWARE, 2018-2030 (USD MILLION)
- TABLE 18. AMERICAS METAVERSE IN EDUCATION MARKET SIZE, BY END-USER, 2018-2030 (USD MILLION)
- TABLE 19. AMERICAS METAVERSE IN EDUCATION MARKET SIZE, BY COUNTRY, 2018-2030 (USD MILLION)
- TABLE 20. ARGENTINA METAVERSE IN EDUCATION MARKET SIZE, BY COMPONENT, 2018-2030 (USD MILLION)
- TABLE 21. ARGENTINA METAVERSE IN EDUCATION MARKET SIZE, BY HARDWARE, 2018-2030 (USD MILLION)
- TABLE 22. ARGENTINA METAVERSE IN EDUCATION MARKET SIZE, BY END-USER, 2018-2030 (USD MILLION)
- TABLE 23. BRAZIL METAVERSE IN EDUCATION MARKET SIZE, BY COMPONENT, 2018-2030 (USD MILLION)
- TABLE 24. BRAZIL METAVERSE IN EDUCATION MARKET SIZE, BY HARDWARE, 2018-2030 (USD MILLION)
- TABLE 25. BRAZIL METAVERSE IN EDUCATION MARKET SIZE, BY END-USER, 2018-2030 (USD MILLION)
- TABLE 26. CANADA METAVERSE IN EDUCATION MARKET SIZE, BY COMPONENT, 2018-2030 (USD MILLION)
- TABLE 27. CANADA METAVERSE IN EDUCATION MARKET SIZE, BY HARDWARE, 2018-2030 (USD MILLION)
- TABLE 28. CANADA METAVERSE IN EDUCATION MARKET SIZE, BY END-USER, 2018-2030 (USD MILLION)
- TABLE 29. MEXICO METAVERSE IN EDUCATION MARKET SIZE, BY COMPONENT, 2018-2030 (USD MILLION)
- TABLE 30. MEXICO METAVERSE IN EDUCATION MARKET SIZE, BY HARDWARE, 2018-2030 (USD MILLION)
- TABLE 31. MEXICO METAVERSE IN EDUCATION MARKET SIZE, BY END-USER, 2018-2030 (USD MILLION)
- TABLE 32. UNITED STATES METAVERSE IN EDUCATION MARKET SIZE, BY COMPONENT, 2018-2030 (USD MILLION)
- TABLE 33. UNITED STATES METAVERSE IN EDUCATION MARKET SIZE, BY HARDWARE, 2018-2030 (USD MILLION)
- TABLE 34. UNITED STATES METAVERSE IN EDUCATION MARKET SIZE, BY END-USER, 2018-2030 (USD MILLION)
- TABLE 35. UNITED STATES METAVERSE IN EDUCATION MARKET SIZE, BY STATE, 2018-2030 (USD MILLION)
- TABLE 36. ASIA-PACIFIC METAVERSE IN EDUCATION MARKET SIZE, BY COMPONENT, 2018-2030 (USD MILLION)
- TABLE 37. ASIA-PACIFIC METAVERSE IN EDUCATION MARKET SIZE, BY HARDWARE, 2018-2030 (USD MILLION)
- TABLE 38. ASIA-PACIFIC METAVERSE IN EDUCATION MARKET SIZE, BY END-USER, 2018-2030 (USD MILLION)
- TABLE 39. ASIA-PACIFIC METAVERSE IN EDUCATION MARKET SIZE, BY COUNTRY, 2018-2030 (USD MILLION)
- TABLE 40. AUSTRALIA METAVERSE IN EDUCATION MARKET SIZE, BY COMPONENT, 2018-2030 (USD MILLION)
- TABLE 41. AUSTRALIA METAVERSE IN EDUCATION MARKET SIZE, BY HARDWARE, 2018-2030 (USD MILLION)
- TABLE 42. AUSTRALIA METAVERSE IN EDUCATION MARKET SIZE, BY END-USER, 2018-2030 (USD MILLION)
- TABLE 43. CHINA METAVERSE IN EDUCATION MARKET SIZE, BY COMPONENT, 2018-2030 (USD MILLION)
- TABLE 44. CHINA METAVERSE IN EDUCATION MARKET SIZE, BY HARDWARE, 2018-2030 (USD MILLION)
- TABLE 45. CHINA METAVERSE IN EDUCATION MARKET SIZE, BY END-USER, 2018-2030 (USD MILLION)
- TABLE 46. INDIA METAVERSE IN EDUCATION MARKET SIZE, BY COMPONENT, 2018-2030 (USD MILLION)
- TABLE 47. INDIA METAVERSE IN EDUCATION MARKET SIZE, BY HARDWARE, 2018-2030 (USD MILLION)
- TABLE 48. INDIA METAVERSE IN EDUCATION MARKET SIZE, BY END-USER, 2018-2030 (USD MILLION)
- TABLE 49. INDONESIA METAVERSE IN EDUCATION MARKET SIZE, BY COMPONENT, 2018-2030 (USD MILLION)
- TABLE 50. INDONESIA METAVERSE IN EDUCATION MARKET SIZE, BY HARDWARE, 2018-2030 (USD MILLION)
- TABLE 51. INDONESIA METAVERSE IN EDUCATION MARKET SIZE, BY END-USER, 2018-2030 (USD MILLION)
- TABLE 52. JAPAN METAVERSE IN EDUCATION MARKET SIZE, BY COMPONENT, 2018-2030 (USD MILLION)
- TABLE 53. JAPAN METAVERSE IN EDUCATION MARKET SIZE, BY HARDWARE, 2018-2030 (USD MILLION)
- TABLE 54. JAPAN METAVERSE IN EDUCATION MARKET SIZE, BY END-USER, 2018-2030 (USD MILLION)
- TABLE 55. MALAYSIA METAVERSE IN EDUCATION MARKET SIZE, BY COMPONENT, 2018-2030 (USD MILLION)
- TABLE 56. MALAYSIA METAVERSE IN EDUCATION MARKET SIZE, BY HARDWARE, 2018-2030 (USD MILLION)
- TABLE 57. MALAYSIA METAVERSE IN EDUCATION MARKET SIZE, BY END-USER, 2018-2030 (USD MILLION)
- TABLE 58. PHILIPPINES METAVERSE IN EDUCATION MARKET SIZE, BY COMPONENT, 2018-2030 (USD MILLION)
- TABLE 59. PHILIPPINES METAVERSE IN EDUCATION MARKET SIZE, BY HARDWARE, 2018-2030 (USD MILLION)
- TABLE 60. PHILIPPINES METAVERSE IN EDUCATION MARKET SIZE, BY END-USER, 2018-2030 (USD MILLION)
- TABLE 61. SINGAPORE METAVERSE IN EDUCATION MARKET SIZE, BY COMPONENT, 2018-2030 (USD MILLION)
- TABLE 62. SINGAPORE METAVERSE IN EDUCATION MARKET SIZE, BY HARDWARE, 2018-2030 (USD MILLION)
- TABLE 63. SINGAPORE METAVERSE IN EDUCATION MARKET SIZE, BY END-USER, 2018-2030 (USD MILLION)
- TABLE 64. SOUTH KOREA METAVERSE IN EDUCATION MARKET SIZE, BY COMPONENT, 2018-2030 (USD MILLION)
- TABLE 65. SOUTH KOREA METAVERSE IN EDUCATION MARKET SIZE, BY HARDWARE, 2018-2030 (USD MILLION)
- TABLE 66. SOUTH KOREA METAVERSE IN EDUCATION MARKET SIZE, BY END-USER, 2018-2030 (USD MILLION)
- TABLE 67. TAIWAN METAVERSE IN EDUCATION MARKET SIZE, BY COMPONENT, 2018-2030 (USD MILLION)
- TABLE 68. TAIWAN METAVERSE IN EDUCATION MARKET SIZE, BY HARDWARE, 2018-2030 (USD MILLION)
- TABLE 69. TAIWAN METAVERSE IN EDUCATION MARKET SIZE, BY END-USER, 2018-2030 (USD MILLION)
- TABLE 70. THAILAND METAVERSE IN EDUCATION MARKET SIZE, BY COMPONENT, 2018-2030 (USD MILLION)
- TABLE 71. THAILAND METAVERSE IN EDUCATION MARKET SIZE, BY HARDWARE, 2018-2030 (USD MILLION)
- TABLE 72. THAILAND METAVERSE IN EDUCATION MARKET SIZE, BY END-USER, 2018-2030 (USD MILLION)
- TABLE 73. VIETNAM METAVERSE IN EDUCATION MARKET SIZE, BY COMPONENT, 2018-2030 (USD MILLION)
- TABLE 74. VIETNAM METAVERSE IN EDUCATION MARKET SIZE, BY HARDWARE, 2018-2030 (USD MILLION)
- TABLE 75. VIETNAM METAVERSE IN EDUCATION MARKET SIZE, BY END-USER, 2018-2030 (USD MILLION)
- TABLE 76. EUROPE, MIDDLE EAST & AFRICA METAVERSE IN EDUCATION MARKET SIZE, BY COMPONENT, 2018-2030 (USD MILLION)
- TABLE 77. EUROPE, MIDDLE EAST & AFRICA METAVERSE IN EDUCATION MARKET SIZE, BY HARDWARE, 2018-2030 (USD MILLION)
- TABLE 78. EUROPE, MIDDLE EAST & AFRICA METAVERSE IN EDUCATION MARKET SIZE, BY END-USER, 2018-2030 (USD MILLION)
- TABLE 79. EUROPE, MIDDLE EAST & AFRICA METAVERSE IN EDUCATION MARKET SIZE, BY COUNTRY, 2018-2030 (USD MILLION)
- TABLE 80. DENMARK METAVERSE IN EDUCATION MARKET SIZE, BY COMPONENT, 2018-2030 (USD MILLION)
- TABLE 81. DENMARK METAVERSE IN EDUCATION MARKET SIZE, BY HARDWARE, 2018-2030 (USD MILLION)
- TABLE 82. DENMARK METAVERSE IN EDUCATION MARKET SIZE, BY END-USER, 2018-2030 (USD MILLION)
- TABLE 83. EGYPT METAVERSE IN EDUCATION MARKET SIZE, BY COMPONENT, 2018-2030 (USD MILLION)
- TABLE 84. EGYPT METAVERSE IN EDUCATION MARKET SIZE, BY HARDWARE, 2018-2030 (USD MILLION)
- TABLE 85. EGYPT METAVERSE IN EDUCATION MARKET SIZE, BY END-USER, 2018-2030 (USD MILLION)
- TABLE 86. FINLAND METAVERSE IN EDUCATION MARKET SIZE, BY COMPONENT, 2018-2030 (USD MILLION)
- TABLE 87. FINLAND METAVERSE IN EDUCATION MARKET SIZE, BY HARDWARE, 2018-2030 (USD MILLION)
- TABLE 88. FINLAND METAVERSE IN EDUCATION MARKET SIZE, BY END-USER, 2018-2030 (USD MILLION)
- TABLE 89. FRANCE METAVERSE IN EDUCATION MARKET SIZE, BY COMPONENT, 2018-2030 (USD MILLION)
- TABLE 90. FRANCE METAVERSE IN EDUCATION MARKET SIZE, BY HARDWARE, 2018-2030 (USD MILLION)
- TABLE 91. FRANCE METAVERSE IN EDUCATION MARKET SIZE, BY END-USER, 2018-2030 (USD MILLION)
- TABLE 92. GERMANY METAVERSE IN EDUCATION MARKET SIZE, BY COMPONENT, 2018-2030 (USD MILLION)
- TABLE 93. GERMANY METAVERSE IN EDUCATION MARKET SIZE, BY HARDWARE, 2018-2030 (USD MILLION)
- TABLE 94. GERMANY METAVERSE IN EDUCATION MARKET SIZE, BY END-USER, 2018-2030 (USD MILLION)
- TABLE 95. ISRAEL METAVERSE IN EDUCATION MARKET SIZE, BY COMPONENT, 2018-2030 (USD MILLION)
- TABLE 96. ISRAEL METAVERSE IN EDUCATION MARKET SIZE, BY HARDWARE, 2018-2030 (USD MILLION)
- TABLE 97. ISRAEL METAVERSE IN EDUCATION MARKET SIZE, BY END-USER, 2018-2030 (USD MILLION)
- TABLE 98. ITALY METAVERSE IN EDUCATION MARKET SIZE, BY COMPONENT, 2018-2030 (USD MILLION)
- TABLE 99. ITALY METAVERSE IN EDUCATION MARKET SIZE, BY HARDWARE, 2018-2030 (USD MILLION)
- TABLE 100. ITALY METAVERSE IN EDUCATION MARKET SIZE, BY END-USER, 2018-2030 (USD MILLION)
- TABLE 101. NETHERLANDS METAVERSE IN EDUCATION MARKET SIZE, BY COMPONENT, 2018-2030 (USD MILLION)
- TABLE 102. NETHERLANDS METAVERSE IN EDUCATION MARKET SIZE, BY HARDWARE, 2018-2030 (USD MILLION)
- TABLE 103. NETHERLANDS METAVERSE IN EDUCATION MARKET SIZE, BY END-USER, 2018-2030 (USD MILLION)
- TABLE 104. NIGERIA METAVERSE IN EDUCATION MARKET SIZE, BY COMPONENT, 2018-2030 (USD MILLION)
- TABLE 105. NIGERIA METAVERSE IN EDUCATION MARKET SIZE, BY HARDWARE, 2018-2030 (USD MILLION)
- TABLE 106. NIGERIA METAVERSE IN EDUCATION MARKET SIZE, BY END-USER, 2018-2030 (USD MILLION)
- TABLE 107. NORWAY METAVERSE IN EDUCATION MARKET SIZE, BY COMPONENT, 2018-2030 (USD MILLION)
- TABLE 108. NORWAY METAVERSE IN EDUCATION MARKET SIZE, BY HARDWARE, 2018-2030 (USD MILLION)
- TABLE 109. NORWAY METAVERSE IN EDUCATION MARKET SIZE, BY END-USER, 2018-2030 (USD MILLION)
- TABLE 110. POLAND METAVERSE IN EDUCATION MARKET SIZE, BY COMPONENT, 2018-2030 (USD MILLION)
- TABLE 111. POLAND METAVERSE IN EDUCATION MARKET SIZE, BY HARDWARE, 2018-2030 (USD MILLION)
- TABLE 112. POLAND METAVERSE IN EDUCATION MARKET SIZE, BY END-USER, 2018-2030 (USD MILLION)
- TABLE 113. QATAR METAVERSE IN EDUCATION MARKET SIZE, BY COMPONENT, 2018-2030 (USD MILLION)
- TABLE 114. QATAR METAVERSE IN EDUCATION MARKET SIZE, BY HARDWARE, 2018-2030 (USD MILLION)
- TABLE 115. QATAR METAVERSE IN EDUCATION MARKET SIZE, BY END-USER, 2018-2030 (USD MILLION)
- TABLE 116. RUSSIA METAVERSE IN EDUCATION MARKET SIZE, BY COMPONENT, 2018-2030 (USD MILLION)
- TABLE 117. RUSSIA METAVERSE IN EDUCATION MARKET SIZE, BY HARDWARE, 2018-2030 (USD MILLION)
- TABLE 118. RUSSIA METAVERSE IN EDUCATION MARKET SIZE, BY END-USER, 2018-2030 (USD MILLION)
- TABLE 119. SAUDI ARABIA METAVERSE IN EDUCATION MARKET SIZE, BY COMPONENT, 2018-2030 (USD MILLION)
- TABLE 120. SAUDI ARABIA METAVERSE IN EDUCATION MARKET SIZE, BY HARDWARE, 2018-2030 (USD MILLION)
- TABLE 121. SAUDI ARABIA METAVERSE IN EDUCATION MARKET SIZE, BY END-USER, 2018-2030 (USD MILLION)
- TABLE 122. SOUTH AFRICA METAVERSE IN EDUCATION MARKET SIZE, BY COMPONENT, 2018-2030 (USD MILLION)
- TABLE 123. SOUTH AFRICA METAVERSE IN EDUCATION MARKET SIZE, BY HARDWARE, 2018-2030 (USD MILLION)
- TABLE 124. SOUTH AFRICA METAVERSE IN EDUCATION MARKET SIZE, BY END-USER, 2018-2030 (USD MILLION)
- TABLE 125. SPAIN METAVERSE IN EDUCATION MARKET SIZE, BY COMPONENT, 2018-2030 (USD MILLION)
- TABLE 126. SPAIN METAVERSE IN EDUCATION MARKET SIZE, BY HARDWARE, 2018-2030 (USD MILLION)
- TABLE 127. SPAIN METAVERSE IN EDUCATION MARKET SIZE, BY END-USER, 2018-2030 (USD MILLION)
- TABLE 128. SWEDEN METAVERSE IN EDUCATION MARKET SIZE, BY COMPONENT, 2018-2030 (USD MILLION)
- TABLE 129. SWEDEN METAVERSE IN EDUCATION MARKET SIZE, BY HARDWARE, 2018-2030 (USD MILLION)
- TABLE 130. SWEDEN METAVERSE IN EDUCATION MARKET SIZE, BY END-USER, 2018-2030 (USD MILLION)
- TABLE 131. SWITZERLAND METAVERSE IN EDUCATION MARKET SIZE, BY COMPONENT, 2018-2030 (USD MILLION)
- TABLE 132. SWITZERLAND METAVERSE IN EDUCATION MARKET SIZE, BY HARDWARE, 2018-2030 (USD MILLION)
- TABLE 133. SWITZERLAND METAVERSE IN EDUCATION MARKET SIZE, BY END-USER, 2018-2030 (USD MILLION)
- TABLE 134. TURKEY METAVERSE IN EDUCATION MARKET SIZE, BY COMPONENT, 2018-2030 (USD MILLION)
- TABLE 135. TURKEY METAVERSE IN EDUCATION MARKET SIZE, BY HARDWARE, 2018-2030 (USD MILLION)
- TABLE 136. TURKEY METAVERSE IN EDUCATION MARKET SIZE, BY END-USER, 2018-2030 (USD MILLION)
- TABLE 137. UNITED ARAB EMIRATES METAVERSE IN EDUCATION MARKET SIZE, BY COMPONENT, 2018-2030 (USD MILLION)
- TABLE 138. UNITED ARAB EMIRATES METAVERSE IN EDUCATION MARKET SIZE, BY HARDWARE, 2018-2030 (USD MILLION)
- TABLE 139. UNITED ARAB EMIRATES METAVERSE IN EDUCATION MARKET SIZE, BY END-USER, 2018-2030 (USD MILLION)
- TABLE 140. UNITED KINGDOM METAVERSE IN EDUCATION MARKET SIZE, BY COMPONENT, 2018-2030 (USD MILLION)
- TABLE 141. UNITED KINGDOM METAVERSE IN EDUCATION MARKET SIZE, BY HARDWARE, 2018-2030 (USD MILLION)
- TABLE 142. UNITED KINGDOM METAVERSE IN EDUCATION MARKET SIZE, BY END-USER, 2018-2030 (USD MILLION)
- TABLE 143. METAVERSE IN EDUCATION MARKET, FPNV POSITIONING MATRIX, 2023
- TABLE 144. METAVERSE IN EDUCATION MARKET SHARE, BY KEY PLAYER, 2023
- TABLE 145. METAVERSE IN EDUCATION MARKET LICENSE & PRICING
 2024-2028年元宇宙全球時尚市場
 元宇宙全球市場:市場規模與佔有率分析-趨勢、驅動因素、競爭格局、未來預測(2024-2030)
 元宇宙:市場佔有率分析、產業趨勢與統計、成長預測(2024-2029)
 元宇宙醫療保健市場規模:按技術、組件、應用程式、最終用戶 - 區域展望、競爭策略、細分市場預測(~2033 年)
 元宇宙互動體驗市場報告:2030年趨勢、預測與競爭分析
 美國元宇宙市場規模、佔有率、趨勢分析報告:按產品、按平台、按技術、按應用、按最終用途、細分市場預測,2024-2030年
 元宇宙時尚市場:按技術、 元宇宙平台 - 2024-2030 年全球預測
 元宇宙2024年醫療保健全球市場報告
 身臨其境型娛樂全球市場規模、佔有率、趨勢分析報告:按技術、應用和地區分類的展望和預測,2023-2030年
 元宇宙電商市場規模、佔有率及趨勢分析報告:按平台、按技術、按應用、按地區、細分市場預測,2024-2030