


 |
市場調查報告書
商品編碼
1415410
流量控制市場:按設備類型、應用分類 - 2024-2030 年全球預測Flow Control Market by Equipment Type (Actuators, Flow Meters, Pumps), Application (Electronics, Marine, Mining) - Global Forecast 2024-2030 |
||||||
※ 本網頁內容可能與最新版本有所差異。詳細情況請與我們聯繫。
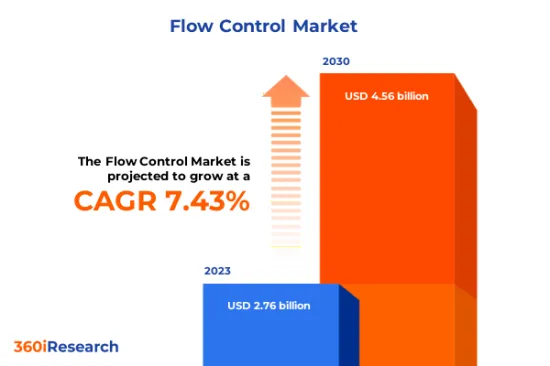
預計2023年流量控制市場規模為27.6億美元,2024年達29.5億美元,2030年預估達45.6億美元,複合年成長率為7.43%。
全球流量控制市場
| 主要市場統計 | |
|---|---|
| 基準年[2023] | 27.6億美元 |
| 預測年份 [2024] | 29.5億美元 |
| 預測年份 [2030] | 45.6億美元 |
| 複合年成長率(%) | 7.43% |
流量控制是指管理、調節和操縱系統或製程流體、氣體和其他物質的流動。流量控制旨在確保物料傳輸以受控且高效的方式進行,滿足指定應用的特定要求。隨著材料、感測器、自動化和數位控制系統的進步,流量控制技術不斷發展。嚴格控制流體流量的能力是許多工業製程的基礎,有助於提高效率、安全性和整體系統性能。提供更好性能和整合能力的創新產品以及更嚴格的環境保護和工業流程標準正在推動市場成長。基礎設施開拓,包括工業設施、水處理廠和能源部門的新計畫和升級,以及新興經濟體的工業擴張,推動了整體市場的成長。然而,先進流量控制系統的資本成本較高,原料價格波動影響流量控制裝置的製造和定價,安裝和維護的複雜性阻礙了市場的引入。對需要先進流量控制解決方案和自動化趨勢的可再生能源計劃的投資不斷增加,正在創造對智慧閥門和智慧型流量計的需求,以實現更好的製程控制,從而創造未來的市場機會。
區域洞察
由於石油天然氣和化學品等行業的成長,消費者需求不斷增加,美洲在流量控制市場中佔有重要地位。客戶的購買行為顯示他們對節能且環境永續的流量控制解決方案的偏好。高水準的研發投資正在推動持續創新,重點是流量控制系統的數位化和自動化。歐盟 (EU) 嚴格的環境標準需要先進且永續的流量控制技術。歐盟客戶要求產品滿足嚴格的能源效率指令和低排放氣體目標。在歐洲市場,有大量旨在最小化工業過程對生態影響的研究,並且在流量控制領域獲得了許多與綠色技術相關的專利。石油和天然氣產業在中東的流量控制市場中佔據主導地位,需要能夠應對惡劣環境和高溫的系統。中東客戶傾向於購買符合國際安全和品質標準的高規格產品,這進一步推動了該地區的市場成長。亞太地區流量控制市場主要受到新興經濟體工業快速開拓的推動。該地區的客戶需求多種多樣,成熟市場青睞優質的高科技解決方案,而新興市場則強調成本效率。區域投資受到都市化、技術採用和基礎設施加強的影響。
FPNV定位矩陣
FPNV定位矩陣對於評估流量控制市場至關重要。我們檢視與業務策略和產品滿意度相關的關鍵指標,以對供應商進行全面評估。這種深入的分析使用戶能夠根據自己的要求做出明智的決策。根據評估,供應商被分為四個成功程度不同的像限:前沿(F)、探路者(P)、利基(N)和重要(V)。
市場佔有率分析
市場佔有率分析是一種綜合工具,可以對流量控制市場中供應商的現狀進行深入而詳細的研究。全面比較和分析供應商在整體收益、基本客群和其他關鍵指標方面的貢獻,以便更好地了解公司的績效及其在爭奪市場佔有率時面臨的挑戰。此外,該分析還提供了對該行業競爭特徵的寶貴考察,包括在研究基準年觀察到的累積、分散主導地位和合併特徵等因素。這種詳細程度的提高使供應商能夠做出更明智的決策並制定有效的策略,從而在市場上獲得競爭優勢。
該報告對以下幾個方面提供了寶貴的見解:
1-市場滲透率:提供有關主要企業所服務的市場的全面資訊。
2-市場開拓:我們深入研究利潤豐厚的新興市場,並分析它們在成熟細分市場中的滲透率。
3- 市場多元化:提供有關新產品發布、開拓地區、最新發展和投資的詳細資訊。
4-競爭力評估與資訊:對主要企業的市場佔有率、策略、產品、認證、監管狀況、專利狀況、製造能力等進行全面評估。
5- 產品開發與創新:提供對未來技術、研發活動和突破性產品開發的見解。
本報告解決了以下關鍵問題:
1-流量控制市場的市場規模與預測是多少?
2-在流量控制市場的預測期內,需要考慮投資哪些產品、細分市場、應用和領域?
3-流量控制市場的技術趨勢和法律規範是什麼?
4-流量控制市場主要廠商的市場佔有率是多少?
5-進入流量控制市場的合適型態或策略手段是什麼?
目錄
第1章 前言
第2章調查方法
第3章執行摘要
第4章市場概況
第5章市場洞察
- 市場動態
- 促進因素
- 石油和天然氣產業需求增加
- 收緊環境保護和工業流程的政府標準
- 加大基礎建設力度,新計畫激增,工業設施升級
- 抑制因素
- 與先進的流量控制系統相關的高資本成本
- 機會
- 可再生能源計劃投資的增加增加了對先進流量控制解決方案的需求
- 創新流量控制開發的技術進步
- 任務
- 安裝和維護先進流量控制基礎設施的複雜性
- 促進因素
- 市場區隔分析
- 設備類型:大量使用穩壓器來控制流體的壓力或流量
- 應用:石油天然氣產業流量控制採用率高
- 市場趨勢分析
- 高通膨的累積效應
- 波特五力分析
- 價值鍊和關鍵路徑分析
- 法律規範
第6章依設備類型分類的流量控制市場
- 致動器
- 流量計
- 泵浦
- 穩壓器
- 閥門
第7章流量控制市場:按應用
- 電子產品
- 海洋
- 礦業
- 石油天然氣
- 電力
第8章美洲流量控制市場
- 阿根廷
- 巴西
- 加拿大
- 墨西哥
- 美國
第9章亞太流量控制市場
- 澳洲
- 中國
- 印度
- 印尼
- 日本
- 馬來西亞
- 菲律賓
- 新加坡
- 韓國
- 台灣
- 泰國
- 越南
第10章 歐洲、中東、非洲流量控制市場
- 丹麥
- 埃及
- 芬蘭
- 法國
- 德國
- 以色列
- 義大利
- 荷蘭
- 奈及利亞
- 挪威
- 波蘭
- 卡達
- 俄羅斯
- 沙烏地阿拉伯
- 南非
- 西班牙
- 瑞典
- 瑞士
- 土耳其
- 阿拉伯聯合大公國
- 英國
第11章競爭形勢
- FPNV定位矩陣
- 市場佔有率分析:主要企業
- 主要企業競爭情境分析
- 新產品發布和功能增強
第12章競爭產品組合
- 主要公司簡介
- ABB Ltd.
- Alfa Laval AB
- Azbil Corporation
- Badger Meter, Inc.
- Circor International, Inc.
- Crane Holdings, Co.
- Emerson Electric Co.
- Endress+Hauser AG
- Flowserve Corporation
- Fluidra SA
- Fratelli Tognella SpA
- General Electric Company
- Hitachi High-Tech Corporation
- Honeywell International Inc.
- IMI Critical Engineering
- Katronic Technologies Ltd.
- KEM Kuppers Elektromechanik GmbH
- KITZ Corporation
- Max Machinery, Inc.
- Parker Hannifin Corporation
- Robert Bosch GmbH
- Rotork PLC
- Samson Controls Inc.
- Schlumberger NV
- Schneider Electric SE
- Sick AG
- Valmet Oyj
- Weatherford International PLC
- Yokogawa Electric Corporation
- 主要產品系列
第13章附錄
- 討論指南
- 關於許可證和定價
[180 Pages Report] The Flow Control Market size was estimated at USD 2.76 billion in 2023 and expected to reach USD 2.95 billion in 2024, at a CAGR 7.43% to reach USD 4.56 billion by 2030.
Global Flow Control Market
| KEY MARKET STATISTICS | |
|---|---|
| Base Year [2023] | USD 2.76 billion |
| Estimated Year [2024] | USD 2.95 billion |
| Forecast Year [2030] | USD 4.56 billion |
| CAGR (%) | 7.43% |
Flow control refers to managing, regulating, and manipulating the flow of fluids, gases, or other materials within a system or process. Flow control aims to ensure that the movement of substances occurs in a controlled and efficient manner, meeting specific requirements for the given application. Flow control technologies continue to evolve with advancements in materials, sensors, automation, and digital control systems. The capacity to strictly regulate the flow of fluids is fundamental to numerous industrial processes, contributing to efficiency, safety, and overall system performance. Innovative products offering better performance and integration capabilities and stricter standards for environmental protection and industrial processes fueled the market growth. Infrastructure development, such as new projects and upgrades in industrial facilities, water treatment plants, and energy sectors, and expanding industries in emerging economies contributed to the overall market growth. However, High capital costs for advanced flow control systems and fluctuating raw material prices affect the manufacturing and pricing of flow control devices, and complexity in installation and maintenance hamper the market adoption. Increased investment in renewable energy projects demanding advanced flow control solutions and automation trends necessitated smart valves and intelligent flow meters for better process management, creating future market opportunities.
Regional Insights
The Americas has a significant landscape in the flow control market owing to robust consumer needs due to the growth of industries such as oil and gas and chemicals. Customer purchasing behavior indicates a preference for energy-efficient and environmentally sustainable flow control solutions. High levels of investment in R&D facilitate continuous innovation, with initiatives focusing on digitalization and automation in flow control systems. The European Union's rigorous environmental standards drive the need for advanced and sustainable flow control technologies. EU customers are inclined towards products that meet stringent energy efficiency directives and low-emission goals. The European market demonstrates significant research endeavors aimed at minimizing the ecological impact of industrial processes, and there are many patents about green technologies within the flow control sector. The oil and gas industry predominantly dictates the Middle Eastern flow control market, necessitating systems capable of handling aggressive environments and high temperatures. The tendency of Middle Eastern customers to lean toward high-specification products that conform to international safety and quality standards has further fueled the market growth in the region. Asia Pacific's flow control market is driven by burgeoning industrial development, particularly in emerging economies. Customer needs in the area are diverse, with mature markets favoring premium, high-tech solutions and developing markets emphasizing cost-effectiveness. Regional investments are influenced by urbanization, technological adoption, and infrastructure enhancement.
FPNV Positioning Matrix
The FPNV Positioning Matrix is pivotal in evaluating the Flow Control Market. It offers a comprehensive assessment of vendors, examining key metrics related to Business Strategy and Product Satisfaction. This in-depth analysis empowers users to make well-informed decisions aligned with their requirements. Based on the evaluation, the vendors are then categorized into four distinct quadrants representing varying levels of success: Forefront (F), Pathfinder (P), Niche (N), or Vital (V).
Market Share Analysis
The Market Share Analysis is a comprehensive tool that provides an insightful and in-depth examination of the current state of vendors in the Flow Control Market. By meticulously comparing and analyzing vendor contributions in terms of overall revenue, customer base, and other key metrics, we can offer companies a greater understanding of their performance and the challenges they face when competing for market share. Additionally, this analysis provides valuable insights into the competitive nature of the sector, including factors such as accumulation, fragmentation dominance, and amalgamation traits observed over the base year period studied. With this expanded level of detail, vendors can make more informed decisions and devise effective strategies to gain a competitive edge in the market.
Key Company Profiles
The report delves into recent significant developments in the Flow Control Market, highlighting leading vendors and their innovative profiles. These include ABB Ltd., Alfa Laval AB, Azbil Corporation, Badger Meter, Inc., Circor International, Inc., Crane Holdings, Co., Emerson Electric Co., Endress+Hauser AG, Flowserve Corporation, Fluidra S.A., Fratelli Tognella S.p.A, General Electric Company, Hitachi High-Tech Corporation, Honeywell International Inc., IMI Critical Engineering, Katronic Technologies Ltd., KEM Kuppers Elektromechanik GmbH, KITZ Corporation, Max Machinery, Inc., Parker Hannifin Corporation, Robert Bosch GmbH, Rotork PLC, Samson Controls Inc., Schlumberger NV, Schneider Electric SE, Sick AG, Valmet Oyj, Weatherford International PLC, and Yokogawa Electric Corporation.
Market Segmentation & Coverage
This research report categorizes the Flow Control Market to forecast the revenues and analyze trends in each of the following sub-markets:
- Equipment Type
- Actuators
- Flow Meters
- Pumps
- Regulators
- Valves
- Application
- Electronics
- Marine
- Mining
- Oil & Gas
- Power
- Region
- Americas
- Argentina
- Brazil
- Canada
- Mexico
- United States
- California
- Florida
- Illinois
- New York
- Ohio
- Pennsylvania
- Texas
- Asia-Pacific
- Australia
- China
- India
- Indonesia
- Japan
- Malaysia
- Philippines
- Singapore
- South Korea
- Taiwan
- Thailand
- Vietnam
- Europe, Middle East & Africa
- Denmark
- Egypt
- Finland
- France
- Germany
- Israel
- Italy
- Netherlands
- Nigeria
- Norway
- Poland
- Qatar
- Russia
- Saudi Arabia
- South Africa
- Spain
- Sweden
- Switzerland
- Turkey
- United Arab Emirates
- United Kingdom
- Americas
The report offers valuable insights on the following aspects:
1. Market Penetration: It presents comprehensive information on the market provided by key players.
2. Market Development: It delves deep into lucrative emerging markets and analyzes the penetration across mature market segments.
3. Market Diversification: It provides detailed information on new product launches, untapped geographic regions, recent developments, and investments.
4. Competitive Assessment & Intelligence: It conducts an exhaustive assessment of market shares, strategies, products, certifications, regulatory approvals, patent landscape, and manufacturing capabilities of the leading players.
5. Product Development & Innovation: It offers intelligent insights on future technologies, R&D activities, and breakthrough product developments.
The report addresses key questions such as:
1. What is the market size and forecast of the Flow Control Market?
2. Which products, segments, applications, and areas should one consider investing in over the forecast period in the Flow Control Market?
3. What are the technology trends and regulatory frameworks in the Flow Control Market?
4. What is the market share of the leading vendors in the Flow Control Market?
5. Which modes and strategic moves are suitable for entering the Flow Control Market?
Table of Contents
1. Preface
- 1.1. Objectives of the Study
- 1.2. Market Segmentation & Coverage
- 1.3. Years Considered for the Study
- 1.4. Currency & Pricing
- 1.5. Language
- 1.6. Limitations
- 1.7. Assumptions
- 1.8. Stakeholders
2. Research Methodology
- 2.1. Define: Research Objective
- 2.2. Determine: Research Design
- 2.3. Prepare: Research Instrument
- 2.4. Collect: Data Source
- 2.5. Analyze: Data Interpretation
- 2.6. Formulate: Data Verification
- 2.7. Publish: Research Report
- 2.8. Repeat: Report Update
3. Executive Summary
4. Market Overview
- 4.1. Introduction
- 4.2. Flow Control Market, by Region
5. Market Insights
- 5.1. Market Dynamics
- 5.1.1. Drivers
- 5.1.1.1. Increasing demand from the oil and gas industry
- 5.1.1.2. Stricter government standards for environmental protection and industrial processes
- 5.1.1.3. Rising infrastructure development coupled with a surge in new projects and upgrades in industrial facilities
- 5.1.2. Restraints
- 5.1.2.1. High capital costs associated with the advanced flow control systems
- 5.1.3. Opportunities
- 5.1.3.1. Increased investment in renewable energy projects led to demand for advanced flow control solutions
- 5.1.3.2. Technological advancements in the development of innovative flow controls
- 5.1.4. Challenges
- 5.1.4.1. Complexity in installation and maintenance of sophisticated flow control infrastructure
- 5.1.1. Drivers
- 5.2. Market Segmentation Analysis
- 5.2.1. Equipment Type: Significant utilization of regulators to control the pressure or flow of fluids
- 5.2.2. Application: High adoption of flow control in oil & gas industry
- 5.3. Market Trend Analysis
- 5.4. Cumulative Impact of High Inflation
- 5.5. Porter's Five Forces Analysis
- 5.5.1. Threat of New Entrants
- 5.5.2. Threat of Substitutes
- 5.5.3. Bargaining Power of Customers
- 5.5.4. Bargaining Power of Suppliers
- 5.5.5. Industry Rivalry
- 5.6. Value Chain & Critical Path Analysis
- 5.7. Regulatory Framework
6. Flow Control Market, by Equipment Type
- 6.1. Introduction
- 6.2. Actuators
- 6.3. Flow Meters
- 6.4. Pumps
- 6.5. Regulators
- 6.6. Valves
7. Flow Control Market, by Application
- 7.1. Introduction
- 7.2. Electronics
- 7.3. Marine
- 7.4. Mining
- 7.5. Oil & Gas
- 7.6. Power
8. Americas Flow Control Market
- 8.1. Introduction
- 8.2. Argentina
- 8.3. Brazil
- 8.4. Canada
- 8.5. Mexico
- 8.6. United States
9. Asia-Pacific Flow Control Market
- 9.1. Introduction
- 9.2. Australia
- 9.3. China
- 9.4. India
- 9.5. Indonesia
- 9.6. Japan
- 9.7. Malaysia
- 9.8. Philippines
- 9.9. Singapore
- 9.10. South Korea
- 9.11. Taiwan
- 9.12. Thailand
- 9.13. Vietnam
10. Europe, Middle East & Africa Flow Control Market
- 10.1. Introduction
- 10.2. Denmark
- 10.3. Egypt
- 10.4. Finland
- 10.5. France
- 10.6. Germany
- 10.7. Israel
- 10.8. Italy
- 10.9. Netherlands
- 10.10. Nigeria
- 10.11. Norway
- 10.12. Poland
- 10.13. Qatar
- 10.14. Russia
- 10.15. Saudi Arabia
- 10.16. South Africa
- 10.17. Spain
- 10.18. Sweden
- 10.19. Switzerland
- 10.20. Turkey
- 10.21. United Arab Emirates
- 10.22. United Kingdom
11. Competitive Landscape
- 11.1. FPNV Positioning Matrix
- 11.2. Market Share Analysis, By Key Player
- 11.3. Competitive Scenario Analysis, By Key Player
- 11.3.1. New Product Launch & Enhancement
- 11.3.1.1. Fuji Electric Launches New S-Flow Ultrasonic Flow Meter
- 11.3.1.2. PSG Launches New and Updated Flow-Sensor and Flow-Measurement Technologies
- 11.3.1.3. Sensirion Launches Its New SFC6000 Mass Flow Controller
- 11.3.1. New Product Launch & Enhancement
12. Competitive Portfolio
- 12.1. Key Company Profiles
- 12.1.1. ABB Ltd.
- 12.1.2. Alfa Laval AB
- 12.1.3. Azbil Corporation
- 12.1.4. Badger Meter, Inc.
- 12.1.5. Circor International, Inc.
- 12.1.6. Crane Holdings, Co.
- 12.1.7. Emerson Electric Co.
- 12.1.8. Endress+Hauser AG
- 12.1.9. Flowserve Corporation
- 12.1.10. Fluidra S.A.
- 12.1.11. Fratelli Tognella S.p.A
- 12.1.12. General Electric Company
- 12.1.13. Hitachi High-Tech Corporation
- 12.1.14. Honeywell International Inc.
- 12.1.15. IMI Critical Engineering
- 12.1.16. Katronic Technologies Ltd.
- 12.1.17. KEM Kuppers Elektromechanik GmbH
- 12.1.18. KITZ Corporation
- 12.1.19. Max Machinery, Inc.
- 12.1.20. Parker Hannifin Corporation
- 12.1.21. Robert Bosch GmbH
- 12.1.22. Rotork PLC
- 12.1.23. Samson Controls Inc.
- 12.1.24. Schlumberger NV
- 12.1.25. Schneider Electric SE
- 12.1.26. Sick AG
- 12.1.27. Valmet Oyj
- 12.1.28. Weatherford International PLC
- 12.1.29. Yokogawa Electric Corporation
- 12.2. Key Product Portfolio
13. Appendix
- 13.1. Discussion Guide
- 13.2. License & Pricing
LIST OF FIGURES
- FIGURE 1. FLOW CONTROL MARKET RESEARCH PROCESS
- FIGURE 2. FLOW CONTROL MARKET SIZE, 2023 VS 2030
- FIGURE 3. FLOW CONTROL MARKET SIZE, 2018-2030 (USD MILLION)
- FIGURE 4. FLOW CONTROL MARKET SIZE, BY REGION, 2023 VS 2030 (%)
- FIGURE 5. FLOW CONTROL MARKET SIZE, BY REGION, 2023 VS 2024 VS 2030 (USD MILLION)
- FIGURE 6. FLOW CONTROL MARKET DYNAMICS
- FIGURE 7. FLOW CONTROL MARKET SIZE, BY EQUIPMENT TYPE, 2023 VS 2030 (%)
- FIGURE 8. FLOW CONTROL MARKET SIZE, BY EQUIPMENT TYPE, 2023 VS 2024 VS 2030 (USD MILLION)
- FIGURE 9. FLOW CONTROL MARKET SIZE, BY APPLICATION, 2023 VS 2030 (%)
- FIGURE 10. FLOW CONTROL MARKET SIZE, BY APPLICATION, 2023 VS 2024 VS 2030 (USD MILLION)
- FIGURE 11. AMERICAS FLOW CONTROL MARKET SIZE, BY COUNTRY, 2023 VS 2030 (%)
- FIGURE 12. AMERICAS FLOW CONTROL MARKET SIZE, BY COUNTRY, 2023 VS 2024 VS 2030 (USD MILLION)
- FIGURE 13. UNITED STATES FLOW CONTROL MARKET SIZE, BY STATE, 2023 VS 2030 (%)
- FIGURE 14. UNITED STATES FLOW CONTROL MARKET SIZE, BY STATE, 2023 VS 2024 VS 2030 (USD MILLION)
- FIGURE 15. ASIA-PACIFIC FLOW CONTROL MARKET SIZE, BY COUNTRY, 2023 VS 2030 (%)
- FIGURE 16. ASIA-PACIFIC FLOW CONTROL MARKET SIZE, BY COUNTRY, 2023 VS 2024 VS 2030 (USD MILLION)
- FIGURE 17. EUROPE, MIDDLE EAST & AFRICA FLOW CONTROL MARKET SIZE, BY COUNTRY, 2023 VS 2030 (%)
- FIGURE 18. EUROPE, MIDDLE EAST & AFRICA FLOW CONTROL MARKET SIZE, BY COUNTRY, 2023 VS 2024 VS 2030 (USD MILLION)
- FIGURE 19. FLOW CONTROL MARKET, FPNV POSITIONING MATRIX, 2023
- FIGURE 20. FLOW CONTROL MARKET SHARE, BY KEY PLAYER, 2023
LIST OF TABLES
- TABLE 1. FLOW CONTROL MARKET SEGMENTATION & COVERAGE
- TABLE 2. UNITED STATES DOLLAR EXCHANGE RATE, 2018-2023
- TABLE 3. FLOW CONTROL MARKET SIZE, 2018-2030 (USD MILLION)
- TABLE 4. GLOBAL FLOW CONTROL MARKET SIZE, BY REGION, 2018-2030 (USD MILLION)
- TABLE 5. FLOW CONTROL MARKET SIZE, BY EQUIPMENT TYPE, 2018-2030 (USD MILLION)
- TABLE 6. FLOW CONTROL MARKET SIZE, BY ACTUATORS, BY REGION, 2018-2030 (USD MILLION)
- TABLE 7. FLOW CONTROL MARKET SIZE, BY FLOW METERS, BY REGION, 2018-2030 (USD MILLION)
- TABLE 8. FLOW CONTROL MARKET SIZE, BY PUMPS, BY REGION, 2018-2030 (USD MILLION)
- TABLE 9. FLOW CONTROL MARKET SIZE, BY REGULATORS, BY REGION, 2018-2030 (USD MILLION)
- TABLE 10. FLOW CONTROL MARKET SIZE, BY VALVES, BY REGION, 2018-2030 (USD MILLION)
- TABLE 11. FLOW CONTROL MARKET SIZE, BY APPLICATION, 2018-2030 (USD MILLION)
- TABLE 12. FLOW CONTROL MARKET SIZE, BY ELECTRONICS, BY REGION, 2018-2030 (USD MILLION)
- TABLE 13. FLOW CONTROL MARKET SIZE, BY MARINE, BY REGION, 2018-2030 (USD MILLION)
- TABLE 14. FLOW CONTROL MARKET SIZE, BY MINING, BY REGION, 2018-2030 (USD MILLION)
- TABLE 15. FLOW CONTROL MARKET SIZE, BY OIL & GAS, BY REGION, 2018-2030 (USD MILLION)
- TABLE 16. FLOW CONTROL MARKET SIZE, BY POWER, BY REGION, 2018-2030 (USD MILLION)
- TABLE 17. AMERICAS FLOW CONTROL MARKET SIZE, BY EQUIPMENT TYPE, 2018-2030 (USD MILLION)
- TABLE 18. AMERICAS FLOW CONTROL MARKET SIZE, BY APPLICATION, 2018-2030 (USD MILLION)
- TABLE 19. AMERICAS FLOW CONTROL MARKET SIZE, BY COUNTRY, 2018-2030 (USD MILLION)
- TABLE 20. ARGENTINA FLOW CONTROL MARKET SIZE, BY EQUIPMENT TYPE, 2018-2030 (USD MILLION)
- TABLE 21. ARGENTINA FLOW CONTROL MARKET SIZE, BY APPLICATION, 2018-2030 (USD MILLION)
- TABLE 22. BRAZIL FLOW CONTROL MARKET SIZE, BY EQUIPMENT TYPE, 2018-2030 (USD MILLION)
- TABLE 23. BRAZIL FLOW CONTROL MARKET SIZE, BY APPLICATION, 2018-2030 (USD MILLION)
- TABLE 24. CANADA FLOW CONTROL MARKET SIZE, BY EQUIPMENT TYPE, 2018-2030 (USD MILLION)
- TABLE 25. CANADA FLOW CONTROL MARKET SIZE, BY APPLICATION, 2018-2030 (USD MILLION)
- TABLE 26. MEXICO FLOW CONTROL MARKET SIZE, BY EQUIPMENT TYPE, 2018-2030 (USD MILLION)
- TABLE 27. MEXICO FLOW CONTROL MARKET SIZE, BY APPLICATION, 2018-2030 (USD MILLION)
- TABLE 28. UNITED STATES FLOW CONTROL MARKET SIZE, BY EQUIPMENT TYPE, 2018-2030 (USD MILLION)
- TABLE 29. UNITED STATES FLOW CONTROL MARKET SIZE, BY APPLICATION, 2018-2030 (USD MILLION)
- TABLE 30. UNITED STATES FLOW CONTROL MARKET SIZE, BY STATE, 2018-2030 (USD MILLION)
- TABLE 31. ASIA-PACIFIC FLOW CONTROL MARKET SIZE, BY EQUIPMENT TYPE, 2018-2030 (USD MILLION)
- TABLE 32. ASIA-PACIFIC FLOW CONTROL MARKET SIZE, BY APPLICATION, 2018-2030 (USD MILLION)
- TABLE 33. ASIA-PACIFIC FLOW CONTROL MARKET SIZE, BY COUNTRY, 2018-2030 (USD MILLION)
- TABLE 34. AUSTRALIA FLOW CONTROL MARKET SIZE, BY EQUIPMENT TYPE, 2018-2030 (USD MILLION)
- TABLE 35. AUSTRALIA FLOW CONTROL MARKET SIZE, BY APPLICATION, 2018-2030 (USD MILLION)
- TABLE 36. CHINA FLOW CONTROL MARKET SIZE, BY EQUIPMENT TYPE, 2018-2030 (USD MILLION)
- TABLE 37. CHINA FLOW CONTROL MARKET SIZE, BY APPLICATION, 2018-2030 (USD MILLION)
- TABLE 38. INDIA FLOW CONTROL MARKET SIZE, BY EQUIPMENT TYPE, 2018-2030 (USD MILLION)
- TABLE 39. INDIA FLOW CONTROL MARKET SIZE, BY APPLICATION, 2018-2030 (USD MILLION)
- TABLE 40. INDONESIA FLOW CONTROL MARKET SIZE, BY EQUIPMENT TYPE, 2018-2030 (USD MILLION)
- TABLE 41. INDONESIA FLOW CONTROL MARKET SIZE, BY APPLICATION, 2018-2030 (USD MILLION)
- TABLE 42. JAPAN FLOW CONTROL MARKET SIZE, BY EQUIPMENT TYPE, 2018-2030 (USD MILLION)
- TABLE 43. JAPAN FLOW CONTROL MARKET SIZE, BY APPLICATION, 2018-2030 (USD MILLION)
- TABLE 44. MALAYSIA FLOW CONTROL MARKET SIZE, BY EQUIPMENT TYPE, 2018-2030 (USD MILLION)
- TABLE 45. MALAYSIA FLOW CONTROL MARKET SIZE, BY APPLICATION, 2018-2030 (USD MILLION)
- TABLE 46. PHILIPPINES FLOW CONTROL MARKET SIZE, BY EQUIPMENT TYPE, 2018-2030 (USD MILLION)
- TABLE 47. PHILIPPINES FLOW CONTROL MARKET SIZE, BY APPLICATION, 2018-2030 (USD MILLION)
- TABLE 48. SINGAPORE FLOW CONTROL MARKET SIZE, BY EQUIPMENT TYPE, 2018-2030 (USD MILLION)
- TABLE 49. SINGAPORE FLOW CONTROL MARKET SIZE, BY APPLICATION, 2018-2030 (USD MILLION)
- TABLE 50. SOUTH KOREA FLOW CONTROL MARKET SIZE, BY EQUIPMENT TYPE, 2018-2030 (USD MILLION)
- TABLE 51. SOUTH KOREA FLOW CONTROL MARKET SIZE, BY APPLICATION, 2018-2030 (USD MILLION)
- TABLE 52. TAIWAN FLOW CONTROL MARKET SIZE, BY EQUIPMENT TYPE, 2018-2030 (USD MILLION)
- TABLE 53. TAIWAN FLOW CONTROL MARKET SIZE, BY APPLICATION, 2018-2030 (USD MILLION)
- TABLE 54. THAILAND FLOW CONTROL MARKET SIZE, BY EQUIPMENT TYPE, 2018-2030 (USD MILLION)
- TABLE 55. THAILAND FLOW CONTROL MARKET SIZE, BY APPLICATION, 2018-2030 (USD MILLION)
- TABLE 56. VIETNAM FLOW CONTROL MARKET SIZE, BY EQUIPMENT TYPE, 2018-2030 (USD MILLION)
- TABLE 57. VIETNAM FLOW CONTROL MARKET SIZE, BY APPLICATION, 2018-2030 (USD MILLION)
- TABLE 58. EUROPE, MIDDLE EAST & AFRICA FLOW CONTROL MARKET SIZE, BY EQUIPMENT TYPE, 2018-2030 (USD MILLION)
- TABLE 59. EUROPE, MIDDLE EAST & AFRICA FLOW CONTROL MARKET SIZE, BY APPLICATION, 2018-2030 (USD MILLION)
- TABLE 60. EUROPE, MIDDLE EAST & AFRICA FLOW CONTROL MARKET SIZE, BY COUNTRY, 2018-2030 (USD MILLION)
- TABLE 61. DENMARK FLOW CONTROL MARKET SIZE, BY EQUIPMENT TYPE, 2018-2030 (USD MILLION)
- TABLE 62. DENMARK FLOW CONTROL MARKET SIZE, BY APPLICATION, 2018-2030 (USD MILLION)
- TABLE 63. EGYPT FLOW CONTROL MARKET SIZE, BY EQUIPMENT TYPE, 2018-2030 (USD MILLION)
- TABLE 64. EGYPT FLOW CONTROL MARKET SIZE, BY APPLICATION, 2018-2030 (USD MILLION)
- TABLE 65. FINLAND FLOW CONTROL MARKET SIZE, BY EQUIPMENT TYPE, 2018-2030 (USD MILLION)
- TABLE 66. FINLAND FLOW CONTROL MARKET SIZE, BY APPLICATION, 2018-2030 (USD MILLION)
- TABLE 67. FRANCE FLOW CONTROL MARKET SIZE, BY EQUIPMENT TYPE, 2018-2030 (USD MILLION)
- TABLE 68. FRANCE FLOW CONTROL MARKET SIZE, BY APPLICATION, 2018-2030 (USD MILLION)
- TABLE 69. GERMANY FLOW CONTROL MARKET SIZE, BY EQUIPMENT TYPE, 2018-2030 (USD MILLION)
- TABLE 70. GERMANY FLOW CONTROL MARKET SIZE, BY APPLICATION, 2018-2030 (USD MILLION)
- TABLE 71. ISRAEL FLOW CONTROL MARKET SIZE, BY EQUIPMENT TYPE, 2018-2030 (USD MILLION)
- TABLE 72. ISRAEL FLOW CONTROL MARKET SIZE, BY APPLICATION, 2018-2030 (USD MILLION)
- TABLE 73. ITALY FLOW CONTROL MARKET SIZE, BY EQUIPMENT TYPE, 2018-2030 (USD MILLION)
- TABLE 74. ITALY FLOW CONTROL MARKET SIZE, BY APPLICATION, 2018-2030 (USD MILLION)
- TABLE 75. NETHERLANDS FLOW CONTROL MARKET SIZE, BY EQUIPMENT TYPE, 2018-2030 (USD MILLION)
- TABLE 76. NETHERLANDS FLOW CONTROL MARKET SIZE, BY APPLICATION, 2018-2030 (USD MILLION)
- TABLE 77. NIGERIA FLOW CONTROL MARKET SIZE, BY EQUIPMENT TYPE, 2018-2030 (USD MILLION)
- TABLE 78. NIGERIA FLOW CONTROL MARKET SIZE, BY APPLICATION, 2018-2030 (USD MILLION)
- TABLE 79. NORWAY FLOW CONTROL MARKET SIZE, BY EQUIPMENT TYPE, 2018-2030 (USD MILLION)
- TABLE 80. NORWAY FLOW CONTROL MARKET SIZE, BY APPLICATION, 2018-2030 (USD MILLION)
- TABLE 81. POLAND FLOW CONTROL MARKET SIZE, BY EQUIPMENT TYPE, 2018-2030 (USD MILLION)
- TABLE 82. POLAND FLOW CONTROL MARKET SIZE, BY APPLICATION, 2018-2030 (USD MILLION)
- TABLE 83. QATAR FLOW CONTROL MARKET SIZE, BY EQUIPMENT TYPE, 2018-2030 (USD MILLION)
- TABLE 84. QATAR FLOW CONTROL MARKET SIZE, BY APPLICATION, 2018-2030 (USD MILLION)
- TABLE 85. RUSSIA FLOW CONTROL MARKET SIZE, BY EQUIPMENT TYPE, 2018-2030 (USD MILLION)
- TABLE 86. RUSSIA FLOW CONTROL MARKET SIZE, BY APPLICATION, 2018-2030 (USD MILLION)
- TABLE 87. SAUDI ARABIA FLOW CONTROL MARKET SIZE, BY EQUIPMENT TYPE, 2018-2030 (USD MILLION)
- TABLE 88. SAUDI ARABIA FLOW CONTROL MARKET SIZE, BY APPLICATION, 2018-2030 (USD MILLION)
- TABLE 89. SOUTH AFRICA FLOW CONTROL MARKET SIZE, BY EQUIPMENT TYPE, 2018-2030 (USD MILLION)
- TABLE 90. SOUTH AFRICA FLOW CONTROL MARKET SIZE, BY APPLICATION, 2018-2030 (USD MILLION)
- TABLE 91. SPAIN FLOW CONTROL MARKET SIZE, BY EQUIPMENT TYPE, 2018-2030 (USD MILLION)
- TABLE 92. SPAIN FLOW CONTROL MARKET SIZE, BY APPLICATION, 2018-2030 (USD MILLION)
- TABLE 93. SWEDEN FLOW CONTROL MARKET SIZE, BY EQUIPMENT TYPE, 2018-2030 (USD MILLION)
- TABLE 94. SWEDEN FLOW CONTROL MARKET SIZE, BY APPLICATION, 2018-2030 (USD MILLION)
- TABLE 95. SWITZERLAND FLOW CONTROL MARKET SIZE, BY EQUIPMENT TYPE, 2018-2030 (USD MILLION)
- TABLE 96. SWITZERLAND FLOW CONTROL MARKET SIZE, BY APPLICATION, 2018-2030 (USD MILLION)
- TABLE 97. TURKEY FLOW CONTROL MARKET SIZE, BY EQUIPMENT TYPE, 2018-2030 (USD MILLION)
- TABLE 98. TURKEY FLOW CONTROL MARKET SIZE, BY APPLICATION, 2018-2030 (USD MILLION)
- TABLE 99. UNITED ARAB EMIRATES FLOW CONTROL MARKET SIZE, BY EQUIPMENT TYPE, 2018-2030 (USD MILLION)
- TABLE 100. UNITED ARAB EMIRATES FLOW CONTROL MARKET SIZE, BY APPLICATION, 2018-2030 (USD MILLION)
- TABLE 101. UNITED KINGDOM FLOW CONTROL MARKET SIZE, BY EQUIPMENT TYPE, 2018-2030 (USD MILLION)
- TABLE 102. UNITED KINGDOM FLOW CONTROL MARKET SIZE, BY APPLICATION, 2018-2030 (USD MILLION)
- TABLE 103. FLOW CONTROL MARKET, FPNV POSITIONING MATRIX, 2023
- TABLE 104. FLOW CONTROL MARKET SHARE, BY KEY PLAYER, 2023
- TABLE 105. FLOW CONTROL MARKET LICENSE & PRICING
 全球渦輪分子幫浦市場規模、佔有率和成長分析:按類型和最終用戶 - 產業預測(2024-2031)
 全球實驗室真空幫浦市場規模、佔有率、成長分析(按類型、按應用)- 產業預測,2023-2030 年
 真空幫浦:市場佔有率分析、產業趨勢與統計、成長預測(2024-2029)
 全球乾式真空幫浦市場:趨勢、預測、競爭分析(~2030 年)
 渦輪分子幫浦市場報告:2030 年趨勢、預測與競爭分析
 真空幫浦市場報告:2030 年趨勢、預測與競爭分析
 實驗室真空幫浦市場:按產品類型、技術、應用和最終用戶 - 2024-2030 年全球預測
 真空幫浦市場:按產品類型、技術和最終用戶分類 - 2024-2030 年全球預測
 乾式多級魯式幫浦市場至2030年的預測:按產品、材料、應用、最終用戶和地區的全球分析
 液環真空幫浦市場:按類型、材料類型、流量、應用分類 - 2023-2030 年全球預測