


 |
市場調查報告書
商品編碼
1415396
工程木材市場:按類型、應用分類 - 2024-2030 年全球預測Engineered Wood Market by Type (Cross-Laminated Timber, Glued Laminated Timber, Laminated Veneer Lumber), Application (Non-Residential, Residential) - Global Forecast 2024-2030 |
||||||
※ 本網頁內容可能與最新版本有所差異。詳細情況請與我們聯繫。
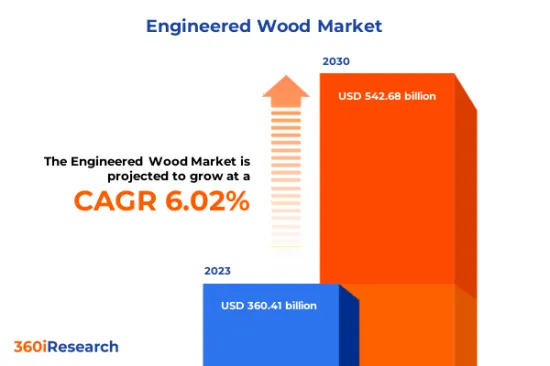
預計2023年工程木材市場規模為3,604.1億美元,2024年將達3,814.2億美元,2030年將達5,426.8億美元,複合年成長率為6.02%。
全球工程木材市場
| 主要市場統計 | |
|---|---|
| 基準年[2023] | 3604.1億美元 |
| 預測年份 [2024] | 3814.2億美元 |
| 預測年份 [2030] | 5426.8億美元 |
| 複合年成長率(%) | 6.02% |
工程木材,也稱為人造木材或複合木材,是通過將木製品與其他材料結合製成的。區分工程木材和實木非常重要,前者俱有更強的多功能性、易於安裝以及耐濕度和溫度變化的能力。消費者對優質、可靠、環保的建築材料的需求不斷成長,推動了工程木材市場的成長。工程木材允許建築商使用更便宜的木材,而不影響強度、耐用性或美觀性。結果是傳統硬木的經濟高效替代品。減少建築碳排放的需求日益成長,推動了工程木材的需求。與傳統硬木製造相比,工程木材的製造過程集中較低,因此溫室氣體排放較低。製造中使用的黏劑的價格波動和耐久性問題正在阻礙市場成長。市場供應商增加引進先進工程木材預計將為市場成長創造機會。
區域洞察
隨著美國和加拿大推廣永續建築並注重輕質、耐用材料,美洲的工程木材市場正在迅速擴大。此外,許多建築規範正在將規格轉變為工程木製品,刺激了工程木製品市場的成長。亞太地區的工程木材市場呈現出巨大的成長潛力。這一成長的最大貢獻者是印度和中國等新興國家。顯著的都市化、生活水準的提高和可支配收入的增加是推動該地區工程木材使用的因素。工程木材產業也存在巨大潛力,因為該地區是世界上最大的膠合板生產商和消費者的所在地。由於歐洲的綠色建築趨勢,歐洲、中東和非洲地區在全球工程木材市場中佔有很大佔有率。在中東和非洲,特別是海灣合作理事會國家和南非,對豪華內裝的需求不斷增加,推動了工程木材市場的成長。嚴格的碳排放法規的實施也推動了工程木材在建築中的使用。
FPNV定位矩陣
FPNV 定位矩陣對於評估工程木材市場至關重要。我們檢視與業務策略和產品滿意度相關的關鍵指標,以對供應商進行全面評估。這種深入的分析使用戶能夠根據自己的要求做出明智的決策。根據評估,供應商被分為四個成功程度不同的像限:前沿(F)、探路者(P)、利基(N)和重要(V)。
市場佔有率分析
市場佔有率分析是一個綜合工具,可以對工程木材市場供應商的現狀進行深入而詳細的研究。全面比較和分析供應商在整體收益、基本客群和其他關鍵指標方面的貢獻,以便更好地了解公司的績效及其在爭奪市場佔有率時面臨的挑戰。此外,該分析還提供了對該行業競爭特徵的寶貴考察,包括在研究基準年觀察到的累積、分散主導地位和合併特徵等因素。這種詳細程度的提高使供應商能夠做出更明智的決策並制定有效的策略,從而在市場上獲得競爭優勢。
該報告對以下幾個方面提供了寶貴的見解:
1-市場滲透率:提供有關主要企業所服務的市場的全面資訊。
2-市場開拓:我們深入研究利潤豐厚的新興市場,並分析它們在成熟細分市場中的滲透率。
3- 市場多元化:提供有關新產品發布、開拓地區、最新發展和投資的詳細資訊。
4-競爭力評估與資訊:對主要企業的市場佔有率、策略、產品、認證、監管狀況、專利狀況、製造能力等進行全面評估。
5- 產品開發與創新:提供對未來技術、研發活動和突破性產品開發的見解。
本報告解決了以下關鍵問題:
1-工程木材市場的市場規模和預測是多少?
2-工程木材市場預測期內需要考慮投資的產品、細分市場、應用和領域有哪些?
3-工程木材市場的技術趨勢和法律規範是什麼?
4-工程木材市場主要供應商的市場佔有率是多少?
5-進入工程木市場的合適型態和策略手段是什麼?
目錄
第1章 前言
第2章調查方法
第3章執行摘要
第4章市場概況
第5章市場洞察
- 市場動態
- 促進因素
- 對高品質、可靠且環保的建築材料的需求日益成長
- 建築業快速發展
- 抑制因素
- 對高成本和美觀目的的擔憂
- 機會
- 工程木製品的新進展
- 介紹工程木材製造的創新技術
- 任務
- 工程木材易受水和濕氣的影響
- 促進因素
- 市場區隔分析
- 類型:由於單板層積材 (LVL) 具有良好的承載能力和均勻性,其使用量增加
- 應用:成本效益和耐用性的獨特結合擴大了工程木材在非住宅的潛力。
- 市場趨勢分析
- 高通膨的累積效應
- 波特五力分析
- 價值鍊和關鍵路徑分析
- 法律規範
第6章工程木材市場:依類型
- 正交複合板
- 複合板
- 層壓板
- 定向塑合板
- 塑合板
- 合板
第7章工程木材市場:依應用分類
- 非居住
- 住宅
第8章美洲工程木材市場
- 阿根廷
- 巴西
- 加拿大
- 墨西哥
- 美國
第9章亞太地區工程木材市場
- 澳洲
- 中國
- 印度
- 印尼
- 日本
- 馬來西亞
- 菲律賓
- 新加坡
- 韓國
- 台灣
- 泰國
- 越南
第10章歐洲、中東和非洲工程木材市場
- 丹麥
- 埃及
- 芬蘭
- 法國
- 德國
- 以色列
- 義大利
- 荷蘭
- 奈及利亞
- 挪威
- 波蘭
- 卡達
- 俄羅斯
- 沙烏地阿拉伯
- 南非
- 西班牙
- 瑞典
- 瑞士
- 土耳其
- 阿拉伯聯合大公國
- 英國
第11章競爭形勢
- FPNV定位矩陣
- 市場佔有率分析:主要企業
- 主要企業競爭情境分析
- 併購
- 投資、資金籌措
- 獎項/獎勵/擴展
第12章競爭產品組合
- 主要公司簡介
- ARI Armaturen Steamline LLP
- Binderholz GmbH
- BlueLinx Corporation
- Boise Cascade Company
- Classic Floorings & Interiors Pvt. Ltd.
- Ego Premium
- Floormonk
- FraserWood
- Freres Engineered Wood
- Greenlam Industries Ltd.
- Hasslacher Holding GmbH
- Havwoods India Pvt. Ltd.
- Huber Engineered Woods LLC
- Kelai Wood
- KLH Massivholz GmbH
- Kronoplus Limited
- Lampert Lumber
- LP Building Solutions
- Mayr-Melnhof Holz Holding AG
- Parador GmbH
- Roseburg Forest Products
- The Natural Wood Floor Company
- The Wood Flooring Co.
- Universal Forest Products, Inc.
- West Fraser Timber Co., Ltd.
- Weyerhaeuser Company
- 主要產品系列
第13章附錄
- 討論指南
- 關於許可證和定價
[189 Pages Report] The Engineered Wood Market size was estimated at USD 360.41 billion in 2023 and expected to reach USD 381.42 billion in 2024, at a CAGR 6.02% to reach USD 542.68 billion by 2030.
Global Engineered Wood Market
| KEY MARKET STATISTICS | |
|---|---|
| Base Year [2023] | USD 360.41 billion |
| Estimated Year [2024] | USD 381.42 billion |
| Forecast Year [2030] | USD 542.68 billion |
| CAGR (%) | 6.02% |
Engineered wood, also known as manufactured or composite wood, is derived from a combination of wood products and other materials. It's important to differentiate engineered wood from solid wood, as the former stands out in versatility of application, ease of installation, and resistance to humidity and temperature changes. Increasing consumer need for high-quality, reliable, and environment-friendly construction materials is driving the growth of the engineered wood market. With engineered wood, builders can use less expensive wood types without compromising on strength, durability, or visual appeal. As a result, it is a cost-effective alternative to traditional hardwood. The growing need to reduce the carbon footprint in construction is propelling the demand for engineered wood. Its manufacturing process is less intensive than producing traditional hardwood, contributing to fewer greenhouse gas emissions. The volatile price of adhesives used in manufacturing and durability issues hinder market growth. The growing introduction of advanced engineered wood by market vendors is expected to create opportunities for market growth.
Regional Insights
The engineered wood market in the Americas is expanding at an exponential rate with a significant drive towards sustainable construction and an emphasis on lightweight and durable materials across both the United States and Canada. Furthermore, numerous building codes have shifted specifications to engineered wood products, accentuating the growth of the engineered wood market. The APAC region displays immense growth potential in the engineered wood market. The most significant contributors to this growth are emerging economies such as India and China. Significant urbanization, a rise in the standard of living, and increasing disposable income are factors promoting the use of engineered wood in this region. The region also harbors some of the world's largest producers and consumers of plywood, imbuing it with a vast potential for the engineered wood sector. The EMEA region comprises a significant share of the global engineered wood market due to the prevalent trend of green building in Europe. The Middle East and Africa, particularly GCC countries and South Africa, are experiencing enhanced demand for luxury interior items, fueling the growth of the engineered wood market. The implementation of stringent carbon emission regulations is also encouraging the use of engineered wood in construction.
FPNV Positioning Matrix
The FPNV Positioning Matrix is pivotal in evaluating the Engineered Wood Market. It offers a comprehensive assessment of vendors, examining key metrics related to Business Strategy and Product Satisfaction. This in-depth analysis empowers users to make well-informed decisions aligned with their requirements. Based on the evaluation, the vendors are then categorized into four distinct quadrants representing varying levels of success: Forefront (F), Pathfinder (P), Niche (N), or Vital (V).
Market Share Analysis
The Market Share Analysis is a comprehensive tool that provides an insightful and in-depth examination of the current state of vendors in the Engineered Wood Market. By meticulously comparing and analyzing vendor contributions in terms of overall revenue, customer base, and other key metrics, we can offer companies a greater understanding of their performance and the challenges they face when competing for market share. Additionally, this analysis provides valuable insights into the competitive nature of the sector, including factors such as accumulation, fragmentation dominance, and amalgamation traits observed over the base year period studied. With this expanded level of detail, vendors can make more informed decisions and devise effective strategies to gain a competitive edge in the market.
Key Company Profiles
The report delves into recent significant developments in the Engineered Wood Market, highlighting leading vendors and their innovative profiles. These include ARI Armaturen Steamline LLP, Binderholz GmbH, BlueLinx Corporation, Boise Cascade Company, Classic Floorings & Interiors Pvt. Ltd., Ego Premium, Floormonk, FraserWood, Freres Engineered Wood, Greenlam Industries Ltd., Hasslacher Holding GmbH, Havwoods India Pvt. Ltd., Huber Engineered Woods LLC, Kelai Wood, KLH Massivholz GmbH, Kronoplus Limited, Lampert Lumber, LP Building Solutions, Mayr-Melnhof Holz Holding AG, Parador GmbH, Roseburg Forest Products, The Natural Wood Floor Company, The Wood Flooring Co., Universal Forest Products, Inc., West Fraser Timber Co., Ltd., and Weyerhaeuser Company.
Market Segmentation & Coverage
This research report categorizes the Engineered Wood Market to forecast the revenues and analyze trends in each of the following sub-markets:
- Type
- Cross-Laminated Timber
- Glued Laminated Timber
- Laminated Veneer Lumber
- Oriented Strand Board
- Particleboard
- Plywood
- Application
- Non-Residential
- Residential
- Region
- Americas
- Argentina
- Brazil
- Canada
- Mexico
- United States
- California
- Florida
- Illinois
- New York
- Ohio
- Pennsylvania
- Texas
- Asia-Pacific
- Australia
- China
- India
- Indonesia
- Japan
- Malaysia
- Philippines
- Singapore
- South Korea
- Taiwan
- Thailand
- Vietnam
- Europe, Middle East & Africa
- Denmark
- Egypt
- Finland
- France
- Germany
- Israel
- Italy
- Netherlands
- Nigeria
- Norway
- Poland
- Qatar
- Russia
- Saudi Arabia
- South Africa
- Spain
- Sweden
- Switzerland
- Turkey
- United Arab Emirates
- United Kingdom
- Americas
The report offers valuable insights on the following aspects:
1. Market Penetration: It presents comprehensive information on the market provided by key players.
2. Market Development: It delves deep into lucrative emerging markets and analyzes the penetration across mature market segments.
3. Market Diversification: It provides detailed information on new product launches, untapped geographic regions, recent developments, and investments.
4. Competitive Assessment & Intelligence: It conducts an exhaustive assessment of market shares, strategies, products, certifications, regulatory approvals, patent landscape, and manufacturing capabilities of the leading players.
5. Product Development & Innovation: It offers intelligent insights on future technologies, R&D activities, and breakthrough product developments.
The report addresses key questions such as:
1. What is the market size and forecast of the Engineered Wood Market?
2. Which products, segments, applications, and areas should one consider investing in over the forecast period in the Engineered Wood Market?
3. What are the technology trends and regulatory frameworks in the Engineered Wood Market?
4. What is the market share of the leading vendors in the Engineered Wood Market?
5. Which modes and strategic moves are suitable for entering the Engineered Wood Market?
Table of Contents
1. Preface
- 1.1. Objectives of the Study
- 1.2. Market Segmentation & Coverage
- 1.3. Years Considered for the Study
- 1.4. Currency & Pricing
- 1.5. Language
- 1.6. Limitations
- 1.7. Assumptions
- 1.8. Stakeholders
2. Research Methodology
- 2.1. Define: Research Objective
- 2.2. Determine: Research Design
- 2.3. Prepare: Research Instrument
- 2.4. Collect: Data Source
- 2.5. Analyze: Data Interpretation
- 2.6. Formulate: Data Verification
- 2.7. Publish: Research Report
- 2.8. Repeat: Report Update
3. Executive Summary
4. Market Overview
- 4.1. Introduction
- 4.2. Engineered Wood Market, by Region
5. Market Insights
- 5.1. Market Dynamics
- 5.1.1. Drivers
- 5.1.1.1. Increasing need for high-quality, reliable, and environment-friendly construction materials
- 5.1.1.2. Surging development of the building and construction sector
- 5.1.2. Restraints
- 5.1.2.1. Concern regarding high cost and aesthetic purpose
- 5.1.3. Opportunities
- 5.1.3.1. Emerging advances in engineered wood products
- 5.1.3.2. Introduction of innovative technology for engineered wood manufacturing
- 5.1.4. Challenges
- 5.1.4.1. Susceptible to water and moisture with usage of engineered wood
- 5.1.1. Drivers
- 5.2. Market Segmentation Analysis
- 5.2.1. Type: Growing usage of laminated veneer lumber (LVL) due to its superior load-bearing capacity and uniformity
- 5.2.2. Application: Expanding the potential of engineered wood in a non-residential sector with its unique blend of cost-effectiveness and durability
- 5.3. Market Trend Analysis
- 5.4. Cumulative Impact of High Inflation
- 5.5. Porter's Five Forces Analysis
- 5.5.1. Threat of New Entrants
- 5.5.2. Threat of Substitutes
- 5.5.3. Bargaining Power of Customers
- 5.5.4. Bargaining Power of Suppliers
- 5.5.5. Industry Rivalry
- 5.6. Value Chain & Critical Path Analysis
- 5.7. Regulatory Framework
6. Engineered Wood Market, by Type
- 6.1. Introduction
- 6.2. Cross-Laminated Timber
- 6.3. Glued Laminated Timber
- 6.4. Laminated Veneer Lumber
- 6.5. Oriented Strand Board
- 6.6. Particleboard
- 6.7. Plywood
7. Engineered Wood Market, by Application
- 7.1. Introduction
- 7.2. Non-Residential
- 7.3. Residential
8. Americas Engineered Wood Market
- 8.1. Introduction
- 8.2. Argentina
- 8.3. Brazil
- 8.4. Canada
- 8.5. Mexico
- 8.6. United States
9. Asia-Pacific Engineered Wood Market
- 9.1. Introduction
- 9.2. Australia
- 9.3. China
- 9.4. India
- 9.5. Indonesia
- 9.6. Japan
- 9.7. Malaysia
- 9.8. Philippines
- 9.9. Singapore
- 9.10. South Korea
- 9.11. Taiwan
- 9.12. Thailand
- 9.13. Vietnam
10. Europe, Middle East & Africa Engineered Wood Market
- 10.1. Introduction
- 10.2. Denmark
- 10.3. Egypt
- 10.4. Finland
- 10.5. France
- 10.6. Germany
- 10.7. Israel
- 10.8. Italy
- 10.9. Netherlands
- 10.10. Nigeria
- 10.11. Norway
- 10.12. Poland
- 10.13. Qatar
- 10.14. Russia
- 10.15. Saudi Arabia
- 10.16. South Africa
- 10.17. Spain
- 10.18. Sweden
- 10.19. Switzerland
- 10.20. Turkey
- 10.21. United Arab Emirates
- 10.22. United Kingdom
11. Competitive Landscape
- 11.1. FPNV Positioning Matrix
- 11.2. Market Share Analysis, By Key Player
- 11.3. Competitive Scenario Analysis, By Key Player
- 11.3.1. Merger & Acquisition
- 11.3.1.1. Atlas Engineered Products Announces Acquisition of a Truss and Wall Panel Manufacturer in New Brunswick, Canada
- 11.3.2. Investment & Funding
- 11.3.2.1. Star Building Materials, a Qualico Company, announces a USD 53 million investment that will double its capacity, create jobs, and help the building industry for decades to come
- 11.3.3. Award, Recognition, & Expansion
- 11.3.3.1. Huber Engineered Woods locating manufacturing operations in Shuqualak
- 11.3.1. Merger & Acquisition
12. Competitive Portfolio
- 12.1. Key Company Profiles
- 12.1.1. ARI Armaturen Steamline LLP
- 12.1.2. Binderholz GmbH
- 12.1.3. BlueLinx Corporation
- 12.1.4. Boise Cascade Company
- 12.1.5. Classic Floorings & Interiors Pvt. Ltd.
- 12.1.6. Ego Premium
- 12.1.7. Floormonk
- 12.1.8. FraserWood
- 12.1.9. Freres Engineered Wood
- 12.1.10. Greenlam Industries Ltd.
- 12.1.11. Hasslacher Holding GmbH
- 12.1.12. Havwoods India Pvt. Ltd.
- 12.1.13. Huber Engineered Woods LLC
- 12.1.14. Kelai Wood
- 12.1.15. KLH Massivholz GmbH
- 12.1.16. Kronoplus Limited
- 12.1.17. Lampert Lumber
- 12.1.18. LP Building Solutions
- 12.1.19. Mayr-Melnhof Holz Holding AG
- 12.1.20. Parador GmbH
- 12.1.21. Roseburg Forest Products
- 12.1.22. The Natural Wood Floor Company
- 12.1.23. The Wood Flooring Co.
- 12.1.24. Universal Forest Products, Inc.
- 12.1.25. West Fraser Timber Co., Ltd.
- 12.1.26. Weyerhaeuser Company
- 12.2. Key Product Portfolio
13. Appendix
- 13.1. Discussion Guide
- 13.2. License & Pricing
LIST OF FIGURES
- FIGURE 1. ENGINEERED WOOD MARKET RESEARCH PROCESS
- FIGURE 2. ENGINEERED WOOD MARKET SIZE, 2023 VS 2030
- FIGURE 3. ENGINEERED WOOD MARKET SIZE, 2018-2030 (USD MILLION)
- FIGURE 4. ENGINEERED WOOD MARKET SIZE, BY REGION, 2023 VS 2030 (%)
- FIGURE 5. ENGINEERED WOOD MARKET SIZE, BY REGION, 2023 VS 2024 VS 2030 (USD MILLION)
- FIGURE 6. ENGINEERED WOOD MARKET DYNAMICS
- FIGURE 7. ENGINEERED WOOD MARKET SIZE, BY TYPE, 2023 VS 2030 (%)
- FIGURE 8. ENGINEERED WOOD MARKET SIZE, BY TYPE, 2023 VS 2024 VS 2030 (USD MILLION)
- FIGURE 9. ENGINEERED WOOD MARKET SIZE, BY APPLICATION, 2023 VS 2030 (%)
- FIGURE 10. ENGINEERED WOOD MARKET SIZE, BY APPLICATION, 2023 VS 2024 VS 2030 (USD MILLION)
- FIGURE 11. AMERICAS ENGINEERED WOOD MARKET SIZE, BY COUNTRY, 2023 VS 2030 (%)
- FIGURE 12. AMERICAS ENGINEERED WOOD MARKET SIZE, BY COUNTRY, 2023 VS 2024 VS 2030 (USD MILLION)
- FIGURE 13. UNITED STATES ENGINEERED WOOD MARKET SIZE, BY STATE, 2023 VS 2030 (%)
- FIGURE 14. UNITED STATES ENGINEERED WOOD MARKET SIZE, BY STATE, 2023 VS 2024 VS 2030 (USD MILLION)
- FIGURE 15. ASIA-PACIFIC ENGINEERED WOOD MARKET SIZE, BY COUNTRY, 2023 VS 2030 (%)
- FIGURE 16. ASIA-PACIFIC ENGINEERED WOOD MARKET SIZE, BY COUNTRY, 2023 VS 2024 VS 2030 (USD MILLION)
- FIGURE 17. EUROPE, MIDDLE EAST & AFRICA ENGINEERED WOOD MARKET SIZE, BY COUNTRY, 2023 VS 2030 (%)
- FIGURE 18. EUROPE, MIDDLE EAST & AFRICA ENGINEERED WOOD MARKET SIZE, BY COUNTRY, 2023 VS 2024 VS 2030 (USD MILLION)
- FIGURE 19. ENGINEERED WOOD MARKET, FPNV POSITIONING MATRIX, 2023
- FIGURE 20. ENGINEERED WOOD MARKET SHARE, BY KEY PLAYER, 2023
LIST OF TABLES
- TABLE 1. ENGINEERED WOOD MARKET SEGMENTATION & COVERAGE
- TABLE 2. UNITED STATES DOLLAR EXCHANGE RATE, 2018-2023
- TABLE 3. ENGINEERED WOOD MARKET SIZE, 2018-2030 (USD MILLION)
- TABLE 4. GLOBAL ENGINEERED WOOD MARKET SIZE, BY REGION, 2018-2030 (USD MILLION)
- TABLE 5. ENGINEERED WOOD MARKET SIZE, BY TYPE, 2018-2030 (USD MILLION)
- TABLE 6. ENGINEERED WOOD MARKET SIZE, BY CROSS-LAMINATED TIMBER, BY REGION, 2018-2030 (USD MILLION)
- TABLE 7. ENGINEERED WOOD MARKET SIZE, BY GLUED LAMINATED TIMBER, BY REGION, 2018-2030 (USD MILLION)
- TABLE 8. ENGINEERED WOOD MARKET SIZE, BY LAMINATED VENEER LUMBER, BY REGION, 2018-2030 (USD MILLION)
- TABLE 9. ENGINEERED WOOD MARKET SIZE, BY ORIENTED STRAND BOARD, BY REGION, 2018-2030 (USD MILLION)
- TABLE 10. ENGINEERED WOOD MARKET SIZE, BY PARTICLEBOARD, BY REGION, 2018-2030 (USD MILLION)
- TABLE 11. ENGINEERED WOOD MARKET SIZE, BY PLYWOOD, BY REGION, 2018-2030 (USD MILLION)
- TABLE 12. ENGINEERED WOOD MARKET SIZE, BY APPLICATION, 2018-2030 (USD MILLION)
- TABLE 13. ENGINEERED WOOD MARKET SIZE, BY NON-RESIDENTIAL, BY REGION, 2018-2030 (USD MILLION)
- TABLE 14. ENGINEERED WOOD MARKET SIZE, BY RESIDENTIAL, BY REGION, 2018-2030 (USD MILLION)
- TABLE 15. AMERICAS ENGINEERED WOOD MARKET SIZE, BY TYPE, 2018-2030 (USD MILLION)
- TABLE 16. AMERICAS ENGINEERED WOOD MARKET SIZE, BY APPLICATION, 2018-2030 (USD MILLION)
- TABLE 17. AMERICAS ENGINEERED WOOD MARKET SIZE, BY COUNTRY, 2018-2030 (USD MILLION)
- TABLE 18. ARGENTINA ENGINEERED WOOD MARKET SIZE, BY TYPE, 2018-2030 (USD MILLION)
- TABLE 19. ARGENTINA ENGINEERED WOOD MARKET SIZE, BY APPLICATION, 2018-2030 (USD MILLION)
- TABLE 20. BRAZIL ENGINEERED WOOD MARKET SIZE, BY TYPE, 2018-2030 (USD MILLION)
- TABLE 21. BRAZIL ENGINEERED WOOD MARKET SIZE, BY APPLICATION, 2018-2030 (USD MILLION)
- TABLE 22. CANADA ENGINEERED WOOD MARKET SIZE, BY TYPE, 2018-2030 (USD MILLION)
- TABLE 23. CANADA ENGINEERED WOOD MARKET SIZE, BY APPLICATION, 2018-2030 (USD MILLION)
- TABLE 24. MEXICO ENGINEERED WOOD MARKET SIZE, BY TYPE, 2018-2030 (USD MILLION)
- TABLE 25. MEXICO ENGINEERED WOOD MARKET SIZE, BY APPLICATION, 2018-2030 (USD MILLION)
- TABLE 26. UNITED STATES ENGINEERED WOOD MARKET SIZE, BY TYPE, 2018-2030 (USD MILLION)
- TABLE 27. UNITED STATES ENGINEERED WOOD MARKET SIZE, BY APPLICATION, 2018-2030 (USD MILLION)
- TABLE 28. UNITED STATES ENGINEERED WOOD MARKET SIZE, BY STATE, 2018-2030 (USD MILLION)
- TABLE 29. ASIA-PACIFIC ENGINEERED WOOD MARKET SIZE, BY TYPE, 2018-2030 (USD MILLION)
- TABLE 30. ASIA-PACIFIC ENGINEERED WOOD MARKET SIZE, BY APPLICATION, 2018-2030 (USD MILLION)
- TABLE 31. ASIA-PACIFIC ENGINEERED WOOD MARKET SIZE, BY COUNTRY, 2018-2030 (USD MILLION)
- TABLE 32. AUSTRALIA ENGINEERED WOOD MARKET SIZE, BY TYPE, 2018-2030 (USD MILLION)
- TABLE 33. AUSTRALIA ENGINEERED WOOD MARKET SIZE, BY APPLICATION, 2018-2030 (USD MILLION)
- TABLE 34. CHINA ENGINEERED WOOD MARKET SIZE, BY TYPE, 2018-2030 (USD MILLION)
- TABLE 35. CHINA ENGINEERED WOOD MARKET SIZE, BY APPLICATION, 2018-2030 (USD MILLION)
- TABLE 36. INDIA ENGINEERED WOOD MARKET SIZE, BY TYPE, 2018-2030 (USD MILLION)
- TABLE 37. INDIA ENGINEERED WOOD MARKET SIZE, BY APPLICATION, 2018-2030 (USD MILLION)
- TABLE 38. INDONESIA ENGINEERED WOOD MARKET SIZE, BY TYPE, 2018-2030 (USD MILLION)
- TABLE 39. INDONESIA ENGINEERED WOOD MARKET SIZE, BY APPLICATION, 2018-2030 (USD MILLION)
- TABLE 40. JAPAN ENGINEERED WOOD MARKET SIZE, BY TYPE, 2018-2030 (USD MILLION)
- TABLE 41. JAPAN ENGINEERED WOOD MARKET SIZE, BY APPLICATION, 2018-2030 (USD MILLION)
- TABLE 42. MALAYSIA ENGINEERED WOOD MARKET SIZE, BY TYPE, 2018-2030 (USD MILLION)
- TABLE 43. MALAYSIA ENGINEERED WOOD MARKET SIZE, BY APPLICATION, 2018-2030 (USD MILLION)
- TABLE 44. PHILIPPINES ENGINEERED WOOD MARKET SIZE, BY TYPE, 2018-2030 (USD MILLION)
- TABLE 45. PHILIPPINES ENGINEERED WOOD MARKET SIZE, BY APPLICATION, 2018-2030 (USD MILLION)
- TABLE 46. SINGAPORE ENGINEERED WOOD MARKET SIZE, BY TYPE, 2018-2030 (USD MILLION)
- TABLE 47. SINGAPORE ENGINEERED WOOD MARKET SIZE, BY APPLICATION, 2018-2030 (USD MILLION)
- TABLE 48. SOUTH KOREA ENGINEERED WOOD MARKET SIZE, BY TYPE, 2018-2030 (USD MILLION)
- TABLE 49. SOUTH KOREA ENGINEERED WOOD MARKET SIZE, BY APPLICATION, 2018-2030 (USD MILLION)
- TABLE 50. TAIWAN ENGINEERED WOOD MARKET SIZE, BY TYPE, 2018-2030 (USD MILLION)
- TABLE 51. TAIWAN ENGINEERED WOOD MARKET SIZE, BY APPLICATION, 2018-2030 (USD MILLION)
- TABLE 52. THAILAND ENGINEERED WOOD MARKET SIZE, BY TYPE, 2018-2030 (USD MILLION)
- TABLE 53. THAILAND ENGINEERED WOOD MARKET SIZE, BY APPLICATION, 2018-2030 (USD MILLION)
- TABLE 54. VIETNAM ENGINEERED WOOD MARKET SIZE, BY TYPE, 2018-2030 (USD MILLION)
- TABLE 55. VIETNAM ENGINEERED WOOD MARKET SIZE, BY APPLICATION, 2018-2030 (USD MILLION)
- TABLE 56. EUROPE, MIDDLE EAST & AFRICA ENGINEERED WOOD MARKET SIZE, BY TYPE, 2018-2030 (USD MILLION)
- TABLE 57. EUROPE, MIDDLE EAST & AFRICA ENGINEERED WOOD MARKET SIZE, BY APPLICATION, 2018-2030 (USD MILLION)
- TABLE 58. EUROPE, MIDDLE EAST & AFRICA ENGINEERED WOOD MARKET SIZE, BY COUNTRY, 2018-2030 (USD MILLION)
- TABLE 59. DENMARK ENGINEERED WOOD MARKET SIZE, BY TYPE, 2018-2030 (USD MILLION)
- TABLE 60. DENMARK ENGINEERED WOOD MARKET SIZE, BY APPLICATION, 2018-2030 (USD MILLION)
- TABLE 61. EGYPT ENGINEERED WOOD MARKET SIZE, BY TYPE, 2018-2030 (USD MILLION)
- TABLE 62. EGYPT ENGINEERED WOOD MARKET SIZE, BY APPLICATION, 2018-2030 (USD MILLION)
- TABLE 63. FINLAND ENGINEERED WOOD MARKET SIZE, BY TYPE, 2018-2030 (USD MILLION)
- TABLE 64. FINLAND ENGINEERED WOOD MARKET SIZE, BY APPLICATION, 2018-2030 (USD MILLION)
- TABLE 65. FRANCE ENGINEERED WOOD MARKET SIZE, BY TYPE, 2018-2030 (USD MILLION)
- TABLE 66. FRANCE ENGINEERED WOOD MARKET SIZE, BY APPLICATION, 2018-2030 (USD MILLION)
- TABLE 67. GERMANY ENGINEERED WOOD MARKET SIZE, BY TYPE, 2018-2030 (USD MILLION)
- TABLE 68. GERMANY ENGINEERED WOOD MARKET SIZE, BY APPLICATION, 2018-2030 (USD MILLION)
- TABLE 69. ISRAEL ENGINEERED WOOD MARKET SIZE, BY TYPE, 2018-2030 (USD MILLION)
- TABLE 70. ISRAEL ENGINEERED WOOD MARKET SIZE, BY APPLICATION, 2018-2030 (USD MILLION)
- TABLE 71. ITALY ENGINEERED WOOD MARKET SIZE, BY TYPE, 2018-2030 (USD MILLION)
- TABLE 72. ITALY ENGINEERED WOOD MARKET SIZE, BY APPLICATION, 2018-2030 (USD MILLION)
- TABLE 73. NETHERLANDS ENGINEERED WOOD MARKET SIZE, BY TYPE, 2018-2030 (USD MILLION)
- TABLE 74. NETHERLANDS ENGINEERED WOOD MARKET SIZE, BY APPLICATION, 2018-2030 (USD MILLION)
- TABLE 75. NIGERIA ENGINEERED WOOD MARKET SIZE, BY TYPE, 2018-2030 (USD MILLION)
- TABLE 76. NIGERIA ENGINEERED WOOD MARKET SIZE, BY APPLICATION, 2018-2030 (USD MILLION)
- TABLE 77. NORWAY ENGINEERED WOOD MARKET SIZE, BY TYPE, 2018-2030 (USD MILLION)
- TABLE 78. NORWAY ENGINEERED WOOD MARKET SIZE, BY APPLICATION, 2018-2030 (USD MILLION)
- TABLE 79. POLAND ENGINEERED WOOD MARKET SIZE, BY TYPE, 2018-2030 (USD MILLION)
- TABLE 80. POLAND ENGINEERED WOOD MARKET SIZE, BY APPLICATION, 2018-2030 (USD MILLION)
- TABLE 81. QATAR ENGINEERED WOOD MARKET SIZE, BY TYPE, 2018-2030 (USD MILLION)
- TABLE 82. QATAR ENGINEERED WOOD MARKET SIZE, BY APPLICATION, 2018-2030 (USD MILLION)
- TABLE 83. RUSSIA ENGINEERED WOOD MARKET SIZE, BY TYPE, 2018-2030 (USD MILLION)
- TABLE 84. RUSSIA ENGINEERED WOOD MARKET SIZE, BY APPLICATION, 2018-2030 (USD MILLION)
- TABLE 85. SAUDI ARABIA ENGINEERED WOOD MARKET SIZE, BY TYPE, 2018-2030 (USD MILLION)
- TABLE 86. SAUDI ARABIA ENGINEERED WOOD MARKET SIZE, BY APPLICATION, 2018-2030 (USD MILLION)
- TABLE 87. SOUTH AFRICA ENGINEERED WOOD MARKET SIZE, BY TYPE, 2018-2030 (USD MILLION)
- TABLE 88. SOUTH AFRICA ENGINEERED WOOD MARKET SIZE, BY APPLICATION, 2018-2030 (USD MILLION)
- TABLE 89. SPAIN ENGINEERED WOOD MARKET SIZE, BY TYPE, 2018-2030 (USD MILLION)
- TABLE 90. SPAIN ENGINEERED WOOD MARKET SIZE, BY APPLICATION, 2018-2030 (USD MILLION)
- TABLE 91. SWEDEN ENGINEERED WOOD MARKET SIZE, BY TYPE, 2018-2030 (USD MILLION)
- TABLE 92. SWEDEN ENGINEERED WOOD MARKET SIZE, BY APPLICATION, 2018-2030 (USD MILLION)
- TABLE 93. SWITZERLAND ENGINEERED WOOD MARKET SIZE, BY TYPE, 2018-2030 (USD MILLION)
- TABLE 94. SWITZERLAND ENGINEERED WOOD MARKET SIZE, BY APPLICATION, 2018-2030 (USD MILLION)
- TABLE 95. TURKEY ENGINEERED WOOD MARKET SIZE, BY TYPE, 2018-2030 (USD MILLION)
- TABLE 96. TURKEY ENGINEERED WOOD MARKET SIZE, BY APPLICATION, 2018-2030 (USD MILLION)
- TABLE 97. UNITED ARAB EMIRATES ENGINEERED WOOD MARKET SIZE, BY TYPE, 2018-2030 (USD MILLION)
- TABLE 98. UNITED ARAB EMIRATES ENGINEERED WOOD MARKET SIZE, BY APPLICATION, 2018-2030 (USD MILLION)
- TABLE 99. UNITED KINGDOM ENGINEERED WOOD MARKET SIZE, BY TYPE, 2018-2030 (USD MILLION)
- TABLE 100. UNITED KINGDOM ENGINEERED WOOD MARKET SIZE, BY APPLICATION, 2018-2030 (USD MILLION)
- TABLE 101. ENGINEERED WOOD MARKET, FPNV POSITIONING MATRIX, 2023
- TABLE 102. ENGINEERED WOOD MARKET SHARE, BY KEY PLAYER, 2023
- TABLE 103. ENGINEERED WOOD MARKET LICENSE & PRICING
 塑合板的全球市場,實際成果與預測(2018年~2029年)
 全球工程木材的成長機會
 全球工程木材市場 - 市場規模、佔有率、成長分析:按類型(膠合板、定向纖維板(OSB))、用途(機械測試、防火測試) - 產業預測 (2023-2030)
 全球工程木材市場
 MDF和塑合板市場:按產品類型、應用和最終用戶產業分類:2023-2032年全球機會分析和產業預測
 工程木料市場:2023-2028年全球行業趨勢、佔有率、規模、成長、機會和預測
 竹工程木市場(產品類型:層壓竹材,再生高密度竹,竹板)-全球產業分析,規模,佔有率,成長,趨勢,預測,2023年-2031年
 工程木材市場 - COVID-19 的增長、趨勢、影響和預測 (2023-2028)
 工程木材的全球市場(2016年~2032年)
 工程木製品的全球市場 2023-2027