


 |
市場調查報告書
商品編碼
1415360
專屬式門戶市場:按產品、最終用戶分類 - 2024-2030 年全球預測Captive Portal Market by Offering (Platform, Services), End-Use (Coworking Spaces, Entertainment, Hospitality & Leisure) - Global Forecast 2024-2030 |
||||||
※ 本網頁內容可能與最新版本有所差異。詳細情況請與我們聯繫。
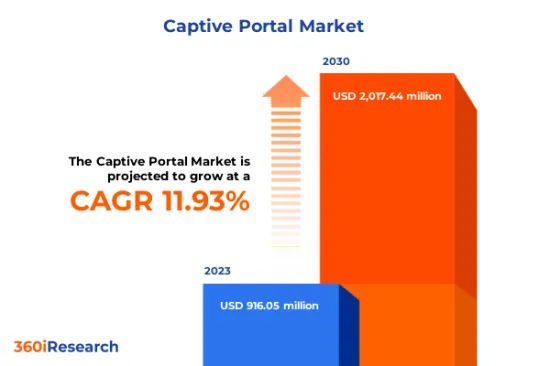
預計2023年專屬式 Portal市場規模為9.1605億美元,預計2024年將達到10.1545億美元,2030年將達到20.1744億美元,複合年成長率為11.93%。
全球專屬式門戶市場
| 主要市場統計 | |
|---|---|
| 基準年[2023] | 91605萬美元 |
| 預測年份 [2024] | 1,015,450,000 美元 |
| 預測年份 [2030] | 201744萬美元 |
| 複合年成長率(%) | 11.93% |
專屬式門戶是使用者的網頁或網路閘道器,要求使用者在被授予存取網際網路或其他網路資源的權限之前完成驗證程序。該功能將在酒店、機場和咖啡館等公共Wi-Fi 網路中實施,以規範使用並確保安全。智慧型手機使用量的快速成長以及支援 Wi-Fi 的裝置的普及增加了對安全可靠的公共網路存取點的需求。然而,糟糕的網路連線或低頻寬可能會對使用者體驗產生負面影響,並限制企業中專屬式網站的有效性。然而,雲端運算技術的進步預計將為透過軟體即服務 (SaaS) 模式尋求經濟高效的專屬式門戶解決方案的企業創造新的前景。
區域洞察
由於專屬式門戶市場在酒店、零售、教育和公司辦公室等各個領域的廣泛採用,美洲的強制門戶市場正在不斷發展。美國公司依靠專屬式門戶進行資料分析和針對性的行銷宣傳活動。在歐盟國家,對遵守隱私法規的無縫連接的需求日益成長。中東地區的網路普及正在迅速提高,這增加了對高效 Wi-Fi 管理系統(包括專屬式入口網站)的需求。在非洲,智慧型手機使用的增加和網路存取的便利性導致使用專屬式門戶的無線熱點部署的增加。由於快速的數位創新和進一步開發 5G 基礎設施的外國投資,推動了對專屬式門戶的需求,亞太地區的專屬式門戶市場正在成長。此外,世界各地對智慧城市舉措的投資增加創造了獨特的機會,可以提供適合當地偏好的專屬式網站解決方案,同時確保資料隱私和安全。
FPNV定位矩陣
FPNV 定位矩陣對於評估專屬式門戶市場至關重要。我們檢視與業務策略和產品滿意度相關的關鍵指標,以對供應商進行全面評估。這種深入的分析使用戶能夠根據自己的要求做出明智的決策。根據評估,供應商被分為四個成功程度不同的像限:前沿(F)、探路者(P)、利基(N)和重要(V)。
市場佔有率分析
市場佔有率分析是一種綜合工具,可以對專屬式門戶市場中供應商的現狀進行深入而深入的研究。透過仔細比較和分析供應商在整體收入、客戶群和其他關鍵指標方面的貢獻,讓企業更深入地了解供應商收益以及他們在爭奪市場佔有率時面臨的挑戰。此外,該分析也為該產業的競爭特徵提供了寶貴的見解,包括在研究基準年觀察到的累積、分散優勢和合併特徵等因素。這種擴展的詳細程度使供應商能夠做出更明智的決策並制定有效的策略,以獲得市場競爭優勢。
該報告對以下幾個方面提供了寶貴的見解:
1-市場滲透率:提供有關主要企業所服務的市場的全面資訊。
2- 市場開拓:我們深入研究利潤豐厚的新興市場,並分析它們在成熟細分市場中的滲透率。
3- 市場多元化:提供有關新產品發布、開拓地區、最新發展和投資的詳細資訊。
4-競爭評估與資訊:對主要企業的市場佔有率、策略、產品、認證、監管核准、專利狀況和製造能力進行全面評估。
5- 產品開發與創新:提供對未來技術、研發活動和突破性產品開發的見解。
本報告解決了以下關鍵問題:
1-專屬式門戶市場的市場規模和預測是多少?
2-在專屬式 Portal 市場的預測期間內,需要考慮投資哪些產品、細分市場、應用程式和領域?
3-專屬式門戶市場的技術趨勢和法律規範是什麼?
4- 專屬式 Portal 市場主要供應商的市場佔有率是多少?
5-進入專屬式門戶市場的適當型態或策略手段是什麼?
目錄
第1章 前言
第2章調查方法
第3章執行摘要
第4章市場概況
第5章市場洞察
- 市場動態
- 促進因素
- 隨著智慧型手機在全球的普及不斷提高,公共 WiFi 熱點的數量也不斷增加。
- 透過個人化內容傳送增強客戶參與
- 更多地使用社交媒體平台來實現輕鬆的登入流程和有針對性的行銷工作
- 抑制因素
- 使用未經許可的頻譜的監管限制影響了某些地區 WiFi 網路的可用性
- 機會
- 無線通訊技術的進步
- 與人工智慧分析等新興技術整合
- 任務
- 由於詐欺的追蹤或濫用個人資訊而導致用戶的資料隱私問題
- 促進因素
- 市場區隔分析
- 我們提供什麼:增加使用專屬式門戶服務來滿足組織的特定需求
- 最終用途:專屬式門戶的採用率在購物中心和零售店中迅速增加
- 市場趨勢分析
- 高通膨的累積效應
- 波特五力分析
- 價值鍊和關鍵路徑分析
- 法律規範
第6章專屬式門戶市場:透過提供
- 平台
- 服務
第7章專屬式門戶市場:依最終用途
- 共同工作空間
- 娛樂
- 款待和休閒
- 購物中心和零售店
- 旅行和交流
第 8 章美洲專屬式門戶市場
- 阿根廷
- 巴西
- 加拿大
- 墨西哥
- 美國
第9章亞太地區專屬式門戶市場
- 澳洲
- 中國
- 印度
- 印尼
- 日本
- 馬來西亞
- 菲律賓
- 新加坡
- 韓國
- 台灣
- 泰國
- 越南
第10章歐洲、中東和非洲的專屬式門戶市場
- 丹麥
- 埃及
- 芬蘭
- 法國
- 德國
- 以色列
- 義大利
- 荷蘭
- 奈及利亞
- 挪威
- 波蘭
- 卡達
- 俄羅斯
- 沙烏地阿拉伯
- 南非
- 西班牙
- 瑞典
- 瑞士
- 土耳其
- 阿拉伯聯合大公國
- 英國
第11章競爭形勢
- FPNV定位矩陣
- 市場佔有率分析:主要企業
- 主要企業競爭情境分析
- 新產品發布和功能增強
第12章競爭產品組合
- 主要公司簡介
- Arista Networks, Inc.
- Cisco Systems Inc.,
- Cloud4Wi
- GoZone WiFi LLC.
- Grandstream Networks, Inc.
- Juniper Networks, Inc.
- Juniper Systems Inc.
- Kalungi, Inc.
- Keenetic Limited
- NETGEAR, Inc.
- Network Solutions LLC
- Nibblecomm, Inc.
- ONE BCG
- Palo Alto Networks, Inc.
- Performance Network
- Purple Wifi Ltd.
- Robustel
- Satcom Direct, Inc.
- Skyfii Limited
- WatchGuard Technologies, Inc.
- 主要產品系列
第13章附錄
- 討論指南
- 關於許可證和定價
[194 Pages Report] The Captive Portal Market size was estimated at USD 916.05 million in 2023 and expected to reach USD 1,015.45 million in 2024, at a CAGR 11.93% to reach USD 2,017.44 million by 2030.
Global Captive Portal Market
| KEY MARKET STATISTICS | |
|---|---|
| Base Year [2023] | USD 916.05 million |
| Estimated Year [2024] | USD 1,015.45 million |
| Forecast Year [2030] | USD 2,017.44 million |
| CAGR (%) | 11.93% |
A captive portal is a user-facing web page or network gateway that requires users to complete an authentication process before they are granted access to the internet or other network resources. This functionality is implemented in public Wi-Fi networks, such as hotels, airports, and cafes, to regulate usage and ensure security. The rapid increase in smartphone usage and pervasive adoption of Wi-Fi-enabled devices has created a demand for secure and reliable public internet access points. However, inadequate internet connectivity or low bandwidth can impact the user experience adversely, limiting the effectiveness of captive portals for businesses. Nevertheless, advancements in cloud computing technologies are expected to create new prospects for businesses seeking cost-effective captive portal solutions through software-as-a-service (SaaS) models.
Regional Insights
The captive portal market is evolving in the Americas due to its extensive adoption in various sectors, such as hospitality, retail, education, and corporate offices. American businesses are leveraging captive portals for data analytics and targeted marketing campaigns. EU countries have witnessed an increasing need for seamless connectivity with strict adherence to privacy regulations. The Middle East region represents rapid growth in internet penetration rates, pushing demand for efficient Wi-Fi management systems, including captive portals. In Africa, there has been a rise in smartphone usage and internet accessibility, which has led to increased adoption of wireless hotspots utilizing captive portals. The APAC region's captive portal market is growing with rapid digital innovation and foreign investments to further develop the 5G infrastructure, raising demand for captive portals. Besides, increasing investments in smart city initiatives worldwide creates the immense opportunity to provide tailored captive portal solutions that cater to regional preferences while ensuring data privacy and security.
FPNV Positioning Matrix
The FPNV Positioning Matrix is pivotal in evaluating the Captive Portal Market. It offers a comprehensive assessment of vendors, examining key metrics related to Business Strategy and Product Satisfaction. This in-depth analysis empowers users to make well-informed decisions aligned with their requirements. Based on the evaluation, the vendors are then categorized into four distinct quadrants representing varying levels of success: Forefront (F), Pathfinder (P), Niche (N), or Vital (V).
Market Share Analysis
The Market Share Analysis is a comprehensive tool that provides an insightful and in-depth examination of the current state of vendors in the Captive Portal Market. By meticulously comparing and analyzing vendor contributions in terms of overall revenue, customer base, and other key metrics, we can offer companies a greater understanding of their performance and the challenges they face when competing for market share. Additionally, this analysis provides valuable insights into the competitive nature of the sector, including factors such as accumulation, fragmentation dominance, and amalgamation traits observed over the base year period studied. With this expanded level of detail, vendors can make more informed decisions and devise effective strategies to gain a competitive edge in the market.
Key Company Profiles
The report delves into recent significant developments in the Captive Portal Market, highlighting leading vendors and their innovative profiles. These include Arista Networks, Inc., Cisco Systems Inc.,, Cloud4Wi, GoZone WiFi LLC., Grandstream Networks, Inc., Juniper Networks, Inc., Juniper Systems Inc., Kalungi, Inc., Keenetic Limited, NETGEAR, Inc., Network Solutions LLC, Nibblecomm, Inc., ONE BCG, Palo Alto Networks, Inc., Performance Network, Purple Wifi Ltd., Robustel, Satcom Direct, Inc., Skyfii Limited, and WatchGuard Technologies, Inc..
Market Segmentation & Coverage
This research report categorizes the Captive Portal Market to forecast the revenues and analyze trends in each of the following sub-markets:
- Offering
- Platform
- Services
- End-Use
- Coworking Spaces
- Entertainment
- Hospitality & Leisure
- Shopping Malls & Retail Outlets
- Travel & Transportation
- Region
- Americas
- Argentina
- Brazil
- Canada
- Mexico
- United States
- California
- Florida
- Illinois
- New York
- Ohio
- Pennsylvania
- Texas
- Asia-Pacific
- Australia
- China
- India
- Indonesia
- Japan
- Malaysia
- Philippines
- Singapore
- South Korea
- Taiwan
- Thailand
- Vietnam
- Europe, Middle East & Africa
- Denmark
- Egypt
- Finland
- France
- Germany
- Israel
- Italy
- Netherlands
- Nigeria
- Norway
- Poland
- Qatar
- Russia
- Saudi Arabia
- South Africa
- Spain
- Sweden
- Switzerland
- Turkey
- United Arab Emirates
- United Kingdom
- Americas
The report offers valuable insights on the following aspects:
1. Market Penetration: It presents comprehensive information on the market provided by key players.
2. Market Development: It delves deep into lucrative emerging markets and analyzes the penetration across mature market segments.
3. Market Diversification: It provides detailed information on new product launches, untapped geographic regions, recent developments, and investments.
4. Competitive Assessment & Intelligence: It conducts an exhaustive assessment of market shares, strategies, products, certifications, regulatory approvals, patent landscape, and manufacturing capabilities of the leading players.
5. Product Development & Innovation: It offers intelligent insights on future technologies, R&D activities, and breakthrough product developments.
The report addresses key questions such as:
1. What is the market size and forecast of the Captive Portal Market?
2. Which products, segments, applications, and areas should one consider investing in over the forecast period in the Captive Portal Market?
3. What are the technology trends and regulatory frameworks in the Captive Portal Market?
4. What is the market share of the leading vendors in the Captive Portal Market?
5. Which modes and strategic moves are suitable for entering the Captive Portal Market?
Table of Contents
1. Preface
- 1.1. Objectives of the Study
- 1.2. Market Segmentation & Coverage
- 1.3. Years Considered for the Study
- 1.4. Currency & Pricing
- 1.5. Language
- 1.6. Limitations
- 1.7. Assumptions
- 1.8. Stakeholders
2. Research Methodology
- 2.1. Define: Research Objective
- 2.2. Determine: Research Design
- 2.3. Prepare: Research Instrument
- 2.4. Collect: Data Source
- 2.5. Analyze: Data Interpretation
- 2.6. Formulate: Data Verification
- 2.7. Publish: Research Report
- 2.8. Repeat: Report Update
3. Executive Summary
4. Market Overview
- 4.1. Introduction
- 4.2. Captive Portal Market, by Region
5. Market Insights
- 5.1. Market Dynamics
- 5.1.1. Drivers
- 5.1.1.1. Growing number of public WiFi hotspots owing to increasing smartphone penetration worldwide
- 5.1.1.2. Enhanced customer engagement through personalized content delivery
- 5.1.1.3. Increasing use of social media platforms for easy sign-in process and targeted marketing efforts
- 5.1.2. Restraints
- 5.1.2.1. Regulatory restrictions on unlicensed spectrum usage impacting WiFi network availability in certain geographies
- 5.1.3. Opportunities
- 5.1.3.1. Advances in wireless communication technology
- 5.1.3.2. Integration with emerging technologies such as AI-powered analytics
- 5.1.4. Challenges
- 5.1.4.1. Data privacy concerns among users due to unauthorized tracking or misuse of personal information
- 5.1.1. Drivers
- 5.2. Market Segmentation Analysis
- 5.2.1. Offerings: Increasing use of captive portal services for addressing specific needs of organizations
- 5.2.2. End-Use: Burgeoning adoption of captive portals in shopping malls & retail outlets
- 5.3. Market Trend Analysis
- 5.4. Cumulative Impact of High Inflation
- 5.5. Porter's Five Forces Analysis
- 5.5.1. Threat of New Entrants
- 5.5.2. Threat of Substitutes
- 5.5.3. Bargaining Power of Customers
- 5.5.4. Bargaining Power of Suppliers
- 5.5.5. Industry Rivalry
- 5.6. Value Chain & Critical Path Analysis
- 5.7. Regulatory Framework
6. Captive Portal Market, by Offering
- 6.1. Introduction
- 6.2. Platform
- 6.3. Services
7. Captive Portal Market, by End-Use
- 7.1. Introduction
- 7.2. Coworking Spaces
- 7.3. Entertainment
- 7.4. Hospitality & Leisure
- 7.5. Shopping Malls & Retail Outlets
- 7.6. Travel & Transportation
8. Americas Captive Portal Market
- 8.1. Introduction
- 8.2. Argentina
- 8.3. Brazil
- 8.4. Canada
- 8.5. Mexico
- 8.6. United States
9. Asia-Pacific Captive Portal Market
- 9.1. Introduction
- 9.2. Australia
- 9.3. China
- 9.4. India
- 9.5. Indonesia
- 9.6. Japan
- 9.7. Malaysia
- 9.8. Philippines
- 9.9. Singapore
- 9.10. South Korea
- 9.11. Taiwan
- 9.12. Thailand
- 9.13. Vietnam
10. Europe, Middle East & Africa Captive Portal Market
- 10.1. Introduction
- 10.2. Denmark
- 10.3. Egypt
- 10.4. Finland
- 10.5. France
- 10.6. Germany
- 10.7. Israel
- 10.8. Italy
- 10.9. Netherlands
- 10.10. Nigeria
- 10.11. Norway
- 10.12. Poland
- 10.13. Qatar
- 10.14. Russia
- 10.15. Saudi Arabia
- 10.16. South Africa
- 10.17. Spain
- 10.18. Sweden
- 10.19. Switzerland
- 10.20. Turkey
- 10.21. United Arab Emirates
- 10.22. United Kingdom
11. Competitive Landscape
- 11.1. FPNV Positioning Matrix
- 11.2. Market Share Analysis, By Key Player
- 11.3. Competitive Scenario Analysis, By Key Player
- 11.3.1. New Product Launch & Enhancement
- 11.3.1.1. Carrier-Grade Wi-Fi Service Delivery In Minutes Now Possible With Launch Of New Cloud Wi-Fi Platform By Globalreach Technology
- 11.3.1.2. 3i Infotech in partnership with RailTel bring NuRe Bharat Network for WiFi Monetizing Project
- 11.3.1.3. GoZone WiFi Launches First Enterprise-Grade Application Suite for Telecom Infra Project (TIP) OpenWiFi; First Advanced Captive Portal/Analytics Company to Work with TIP
- 11.3.1. New Product Launch & Enhancement
12. Competitive Portfolio
- 12.1. Key Company Profiles
- 12.1.1. Arista Networks, Inc.
- 12.1.2. Cisco Systems Inc.,
- 12.1.3. Cloud4Wi
- 12.1.4. GoZone WiFi LLC.
- 12.1.5. Grandstream Networks, Inc.
- 12.1.6. Juniper Networks, Inc.
- 12.1.7. Juniper Systems Inc.
- 12.1.8. Kalungi, Inc.
- 12.1.9. Keenetic Limited
- 12.1.10. NETGEAR, Inc.
- 12.1.11. Network Solutions LLC
- 12.1.12. Nibblecomm, Inc.
- 12.1.13. ONE BCG
- 12.1.14. Palo Alto Networks, Inc.
- 12.1.15. Performance Network
- 12.1.16. Purple Wifi Ltd.
- 12.1.17. Robustel
- 12.1.18. Satcom Direct, Inc.
- 12.1.19. Skyfii Limited
- 12.1.20. WatchGuard Technologies, Inc.
- 12.2. Key Product Portfolio
13. Appendix
- 13.1. Discussion Guide
- 13.2. License & Pricing
LIST OF FIGURES
- FIGURE 1. CAPTIVE PORTAL MARKET RESEARCH PROCESS
- FIGURE 2. CAPTIVE PORTAL MARKET SIZE, 2023 VS 2030
- FIGURE 3. CAPTIVE PORTAL MARKET SIZE, 2018-2030 (USD MILLION)
- FIGURE 4. CAPTIVE PORTAL MARKET SIZE, BY REGION, 2023 VS 2030 (%)
- FIGURE 5. CAPTIVE PORTAL MARKET SIZE, BY REGION, 2023 VS 2024 VS 2030 (USD MILLION)
- FIGURE 6. CAPTIVE PORTAL MARKET DYNAMICS
- FIGURE 7. CAPTIVE PORTAL MARKET SIZE, BY OFFERING, 2023 VS 2030 (%)
- FIGURE 8. CAPTIVE PORTAL MARKET SIZE, BY OFFERING, 2023 VS 2024 VS 2030 (USD MILLION)
- FIGURE 9. CAPTIVE PORTAL MARKET SIZE, BY END-USE, 2023 VS 2030 (%)
- FIGURE 10. CAPTIVE PORTAL MARKET SIZE, BY END-USE, 2023 VS 2024 VS 2030 (USD MILLION)
- FIGURE 11. AMERICAS CAPTIVE PORTAL MARKET SIZE, BY COUNTRY, 2023 VS 2030 (%)
- FIGURE 12. AMERICAS CAPTIVE PORTAL MARKET SIZE, BY COUNTRY, 2023 VS 2024 VS 2030 (USD MILLION)
- FIGURE 13. UNITED STATES CAPTIVE PORTAL MARKET SIZE, BY STATE, 2023 VS 2030 (%)
- FIGURE 14. UNITED STATES CAPTIVE PORTAL MARKET SIZE, BY STATE, 2023 VS 2024 VS 2030 (USD MILLION)
- FIGURE 15. ASIA-PACIFIC CAPTIVE PORTAL MARKET SIZE, BY COUNTRY, 2023 VS 2030 (%)
- FIGURE 16. ASIA-PACIFIC CAPTIVE PORTAL MARKET SIZE, BY COUNTRY, 2023 VS 2024 VS 2030 (USD MILLION)
- FIGURE 17. EUROPE, MIDDLE EAST & AFRICA CAPTIVE PORTAL MARKET SIZE, BY COUNTRY, 2023 VS 2030 (%)
- FIGURE 18. EUROPE, MIDDLE EAST & AFRICA CAPTIVE PORTAL MARKET SIZE, BY COUNTRY, 2023 VS 2024 VS 2030 (USD MILLION)
- FIGURE 19. CAPTIVE PORTAL MARKET, FPNV POSITIONING MATRIX, 2023
- FIGURE 20. CAPTIVE PORTAL MARKET SHARE, BY KEY PLAYER, 2023
LIST OF TABLES
- TABLE 1. CAPTIVE PORTAL MARKET SEGMENTATION & COVERAGE
- TABLE 2. UNITED STATES DOLLAR EXCHANGE RATE, 2018-2023
- TABLE 3. CAPTIVE PORTAL MARKET SIZE, 2018-2030 (USD MILLION)
- TABLE 4. GLOBAL CAPTIVE PORTAL MARKET SIZE, BY REGION, 2018-2030 (USD MILLION)
- TABLE 5. CAPTIVE PORTAL MARKET SIZE, BY OFFERING, 2018-2030 (USD MILLION)
- TABLE 6. CAPTIVE PORTAL MARKET SIZE, BY PLATFORM, BY REGION, 2018-2030 (USD MILLION)
- TABLE 7. CAPTIVE PORTAL MARKET SIZE, BY SERVICES, BY REGION, 2018-2030 (USD MILLION)
- TABLE 8. CAPTIVE PORTAL MARKET SIZE, BY END-USE, 2018-2030 (USD MILLION)
- TABLE 9. CAPTIVE PORTAL MARKET SIZE, BY COWORKING SPACES, BY REGION, 2018-2030 (USD MILLION)
- TABLE 10. CAPTIVE PORTAL MARKET SIZE, BY ENTERTAINMENT, BY REGION, 2018-2030 (USD MILLION)
- TABLE 11. CAPTIVE PORTAL MARKET SIZE, BY HOSPITALITY & LEISURE, BY REGION, 2018-2030 (USD MILLION)
- TABLE 12. CAPTIVE PORTAL MARKET SIZE, BY SHOPPING MALLS & RETAIL OUTLETS, BY REGION, 2018-2030 (USD MILLION)
- TABLE 13. CAPTIVE PORTAL MARKET SIZE, BY TRAVEL & TRANSPORTATION, BY REGION, 2018-2030 (USD MILLION)
- TABLE 14. AMERICAS CAPTIVE PORTAL MARKET SIZE, BY OFFERING, 2018-2030 (USD MILLION)
- TABLE 15. AMERICAS CAPTIVE PORTAL MARKET SIZE, BY END-USE, 2018-2030 (USD MILLION)
- TABLE 16. AMERICAS CAPTIVE PORTAL MARKET SIZE, BY COUNTRY, 2018-2030 (USD MILLION)
- TABLE 17. ARGENTINA CAPTIVE PORTAL MARKET SIZE, BY OFFERING, 2018-2030 (USD MILLION)
- TABLE 18. ARGENTINA CAPTIVE PORTAL MARKET SIZE, BY END-USE, 2018-2030 (USD MILLION)
- TABLE 19. BRAZIL CAPTIVE PORTAL MARKET SIZE, BY OFFERING, 2018-2030 (USD MILLION)
- TABLE 20. BRAZIL CAPTIVE PORTAL MARKET SIZE, BY END-USE, 2018-2030 (USD MILLION)
- TABLE 21. CANADA CAPTIVE PORTAL MARKET SIZE, BY OFFERING, 2018-2030 (USD MILLION)
- TABLE 22. CANADA CAPTIVE PORTAL MARKET SIZE, BY END-USE, 2018-2030 (USD MILLION)
- TABLE 23. MEXICO CAPTIVE PORTAL MARKET SIZE, BY OFFERING, 2018-2030 (USD MILLION)
- TABLE 24. MEXICO CAPTIVE PORTAL MARKET SIZE, BY END-USE, 2018-2030 (USD MILLION)
- TABLE 25. UNITED STATES CAPTIVE PORTAL MARKET SIZE, BY OFFERING, 2018-2030 (USD MILLION)
- TABLE 26. UNITED STATES CAPTIVE PORTAL MARKET SIZE, BY END-USE, 2018-2030 (USD MILLION)
- TABLE 27. UNITED STATES CAPTIVE PORTAL MARKET SIZE, BY STATE, 2018-2030 (USD MILLION)
- TABLE 28. ASIA-PACIFIC CAPTIVE PORTAL MARKET SIZE, BY OFFERING, 2018-2030 (USD MILLION)
- TABLE 29. ASIA-PACIFIC CAPTIVE PORTAL MARKET SIZE, BY END-USE, 2018-2030 (USD MILLION)
- TABLE 30. ASIA-PACIFIC CAPTIVE PORTAL MARKET SIZE, BY COUNTRY, 2018-2030 (USD MILLION)
- TABLE 31. AUSTRALIA CAPTIVE PORTAL MARKET SIZE, BY OFFERING, 2018-2030 (USD MILLION)
- TABLE 32. AUSTRALIA CAPTIVE PORTAL MARKET SIZE, BY END-USE, 2018-2030 (USD MILLION)
- TABLE 33. CHINA CAPTIVE PORTAL MARKET SIZE, BY OFFERING, 2018-2030 (USD MILLION)
- TABLE 34. CHINA CAPTIVE PORTAL MARKET SIZE, BY END-USE, 2018-2030 (USD MILLION)
- TABLE 35. INDIA CAPTIVE PORTAL MARKET SIZE, BY OFFERING, 2018-2030 (USD MILLION)
- TABLE 36. INDIA CAPTIVE PORTAL MARKET SIZE, BY END-USE, 2018-2030 (USD MILLION)
- TABLE 37. INDONESIA CAPTIVE PORTAL MARKET SIZE, BY OFFERING, 2018-2030 (USD MILLION)
- TABLE 38. INDONESIA CAPTIVE PORTAL MARKET SIZE, BY END-USE, 2018-2030 (USD MILLION)
- TABLE 39. JAPAN CAPTIVE PORTAL MARKET SIZE, BY OFFERING, 2018-2030 (USD MILLION)
- TABLE 40. JAPAN CAPTIVE PORTAL MARKET SIZE, BY END-USE, 2018-2030 (USD MILLION)
- TABLE 41. MALAYSIA CAPTIVE PORTAL MARKET SIZE, BY OFFERING, 2018-2030 (USD MILLION)
- TABLE 42. MALAYSIA CAPTIVE PORTAL MARKET SIZE, BY END-USE, 2018-2030 (USD MILLION)
- TABLE 43. PHILIPPINES CAPTIVE PORTAL MARKET SIZE, BY OFFERING, 2018-2030 (USD MILLION)
- TABLE 44. PHILIPPINES CAPTIVE PORTAL MARKET SIZE, BY END-USE, 2018-2030 (USD MILLION)
- TABLE 45. SINGAPORE CAPTIVE PORTAL MARKET SIZE, BY OFFERING, 2018-2030 (USD MILLION)
- TABLE 46. SINGAPORE CAPTIVE PORTAL MARKET SIZE, BY END-USE, 2018-2030 (USD MILLION)
- TABLE 47. SOUTH KOREA CAPTIVE PORTAL MARKET SIZE, BY OFFERING, 2018-2030 (USD MILLION)
- TABLE 48. SOUTH KOREA CAPTIVE PORTAL MARKET SIZE, BY END-USE, 2018-2030 (USD MILLION)
- TABLE 49. TAIWAN CAPTIVE PORTAL MARKET SIZE, BY OFFERING, 2018-2030 (USD MILLION)
- TABLE 50. TAIWAN CAPTIVE PORTAL MARKET SIZE, BY END-USE, 2018-2030 (USD MILLION)
- TABLE 51. THAILAND CAPTIVE PORTAL MARKET SIZE, BY OFFERING, 2018-2030 (USD MILLION)
- TABLE 52. THAILAND CAPTIVE PORTAL MARKET SIZE, BY END-USE, 2018-2030 (USD MILLION)
- TABLE 53. VIETNAM CAPTIVE PORTAL MARKET SIZE, BY OFFERING, 2018-2030 (USD MILLION)
- TABLE 54. VIETNAM CAPTIVE PORTAL MARKET SIZE, BY END-USE, 2018-2030 (USD MILLION)
- TABLE 55. EUROPE, MIDDLE EAST & AFRICA CAPTIVE PORTAL MARKET SIZE, BY OFFERING, 2018-2030 (USD MILLION)
- TABLE 56. EUROPE, MIDDLE EAST & AFRICA CAPTIVE PORTAL MARKET SIZE, BY END-USE, 2018-2030 (USD MILLION)
- TABLE 57. EUROPE, MIDDLE EAST & AFRICA CAPTIVE PORTAL MARKET SIZE, BY COUNTRY, 2018-2030 (USD MILLION)
- TABLE 58. DENMARK CAPTIVE PORTAL MARKET SIZE, BY OFFERING, 2018-2030 (USD MILLION)
- TABLE 59. DENMARK CAPTIVE PORTAL MARKET SIZE, BY END-USE, 2018-2030 (USD MILLION)
- TABLE 60. EGYPT CAPTIVE PORTAL MARKET SIZE, BY OFFERING, 2018-2030 (USD MILLION)
- TABLE 61. EGYPT CAPTIVE PORTAL MARKET SIZE, BY END-USE, 2018-2030 (USD MILLION)
- TABLE 62. FINLAND CAPTIVE PORTAL MARKET SIZE, BY OFFERING, 2018-2030 (USD MILLION)
- TABLE 63. FINLAND CAPTIVE PORTAL MARKET SIZE, BY END-USE, 2018-2030 (USD MILLION)
- TABLE 64. FRANCE CAPTIVE PORTAL MARKET SIZE, BY OFFERING, 2018-2030 (USD MILLION)
- TABLE 65. FRANCE CAPTIVE PORTAL MARKET SIZE, BY END-USE, 2018-2030 (USD MILLION)
- TABLE 66. GERMANY CAPTIVE PORTAL MARKET SIZE, BY OFFERING, 2018-2030 (USD MILLION)
- TABLE 67. GERMANY CAPTIVE PORTAL MARKET SIZE, BY END-USE, 2018-2030 (USD MILLION)
- TABLE 68. ISRAEL CAPTIVE PORTAL MARKET SIZE, BY OFFERING, 2018-2030 (USD MILLION)
- TABLE 69. ISRAEL CAPTIVE PORTAL MARKET SIZE, BY END-USE, 2018-2030 (USD MILLION)
- TABLE 70. ITALY CAPTIVE PORTAL MARKET SIZE, BY OFFERING, 2018-2030 (USD MILLION)
- TABLE 71. ITALY CAPTIVE PORTAL MARKET SIZE, BY END-USE, 2018-2030 (USD MILLION)
- TABLE 72. NETHERLANDS CAPTIVE PORTAL MARKET SIZE, BY OFFERING, 2018-2030 (USD MILLION)
- TABLE 73. NETHERLANDS CAPTIVE PORTAL MARKET SIZE, BY END-USE, 2018-2030 (USD MILLION)
- TABLE 74. NIGERIA CAPTIVE PORTAL MARKET SIZE, BY OFFERING, 2018-2030 (USD MILLION)
- TABLE 75. NIGERIA CAPTIVE PORTAL MARKET SIZE, BY END-USE, 2018-2030 (USD MILLION)
- TABLE 76. NORWAY CAPTIVE PORTAL MARKET SIZE, BY OFFERING, 2018-2030 (USD MILLION)
- TABLE 77. NORWAY CAPTIVE PORTAL MARKET SIZE, BY END-USE, 2018-2030 (USD MILLION)
- TABLE 78. POLAND CAPTIVE PORTAL MARKET SIZE, BY OFFERING, 2018-2030 (USD MILLION)
- TABLE 79. POLAND CAPTIVE PORTAL MARKET SIZE, BY END-USE, 2018-2030 (USD MILLION)
- TABLE 80. QATAR CAPTIVE PORTAL MARKET SIZE, BY OFFERING, 2018-2030 (USD MILLION)
- TABLE 81. QATAR CAPTIVE PORTAL MARKET SIZE, BY END-USE, 2018-2030 (USD MILLION)
- TABLE 82. RUSSIA CAPTIVE PORTAL MARKET SIZE, BY OFFERING, 2018-2030 (USD MILLION)
- TABLE 83. RUSSIA CAPTIVE PORTAL MARKET SIZE, BY END-USE, 2018-2030 (USD MILLION)
- TABLE 84. SAUDI ARABIA CAPTIVE PORTAL MARKET SIZE, BY OFFERING, 2018-2030 (USD MILLION)
- TABLE 85. SAUDI ARABIA CAPTIVE PORTAL MARKET SIZE, BY END-USE, 2018-2030 (USD MILLION)
- TABLE 86. SOUTH AFRICA CAPTIVE PORTAL MARKET SIZE, BY OFFERING, 2018-2030 (USD MILLION)
- TABLE 87. SOUTH AFRICA CAPTIVE PORTAL MARKET SIZE, BY END-USE, 2018-2030 (USD MILLION)
- TABLE 88. SPAIN CAPTIVE PORTAL MARKET SIZE, BY OFFERING, 2018-2030 (USD MILLION)
- TABLE 89. SPAIN CAPTIVE PORTAL MARKET SIZE, BY END-USE, 2018-2030 (USD MILLION)
- TABLE 90. SWEDEN CAPTIVE PORTAL MARKET SIZE, BY OFFERING, 2018-2030 (USD MILLION)
- TABLE 91. SWEDEN CAPTIVE PORTAL MARKET SIZE, BY END-USE, 2018-2030 (USD MILLION)
- TABLE 92. SWITZERLAND CAPTIVE PORTAL MARKET SIZE, BY OFFERING, 2018-2030 (USD MILLION)
- TABLE 93. SWITZERLAND CAPTIVE PORTAL MARKET SIZE, BY END-USE, 2018-2030 (USD MILLION)
- TABLE 94. TURKEY CAPTIVE PORTAL MARKET SIZE, BY OFFERING, 2018-2030 (USD MILLION)
- TABLE 95. TURKEY CAPTIVE PORTAL MARKET SIZE, BY END-USE, 2018-2030 (USD MILLION)
- TABLE 96. UNITED ARAB EMIRATES CAPTIVE PORTAL MARKET SIZE, BY OFFERING, 2018-2030 (USD MILLION)
- TABLE 97. UNITED ARAB EMIRATES CAPTIVE PORTAL MARKET SIZE, BY END-USE, 2018-2030 (USD MILLION)
- TABLE 98. UNITED KINGDOM CAPTIVE PORTAL MARKET SIZE, BY OFFERING, 2018-2030 (USD MILLION)
- TABLE 99. UNITED KINGDOM CAPTIVE PORTAL MARKET SIZE, BY END-USE, 2018-2030 (USD MILLION)
- TABLE 100. CAPTIVE PORTAL MARKET, FPNV POSITIONING MATRIX, 2023
- TABLE 101. CAPTIVE PORTAL MARKET SHARE, BY KEY PLAYER, 2023
- TABLE 102. CAPTIVE PORTAL MARKET LICENSE & PRICING
 2024 年專屬式 Portal 全球市場報告
 2024 年網路安全軟體全球市場報告
 2024 年網路安全策略管理 (NPSM) 軟體全球市場報告
 2024-2032 年按組件、部署模式、組織規模、垂直產業和地區分類的網路安全市場報告
 2024 年防毒軟體世界市場報告
 保全服務邊緣市場:按提供的服務、公司規模和行業分類 - 2024 年至 2030 年全球預測
 全球網路安全市場 2023-2030
 安全服務邊緣市場- 按組件(解決方案、服務)、按組織規模(大型組織、中小企業)、最終用戶(BFSI、IT 和電信、零售和電子商務、醫療保健、政府、製造業),預測, 2024 年- 2032
 2023-2030 年全球無線網路安全市場
 安全服務邊際全球市場規模、佔有率、產業趨勢分析報告:2023-2030 年按組件、最終用戶、地區分類的展望與預測