


 |
市場調查報告書
商品編碼
1415347
垂直起降機場市場:按類型、地點分類 - 2024-2030 年全球預測Vertiports Market by Type (Verti Hubs, Vertibases, Vertipads), Location (Ground-based, Rooftop / Elevated) - Global Forecast 2024-2030 |
||||||
※ 本網頁內容可能與最新版本有所差異。詳細情況請與我們聯繫。
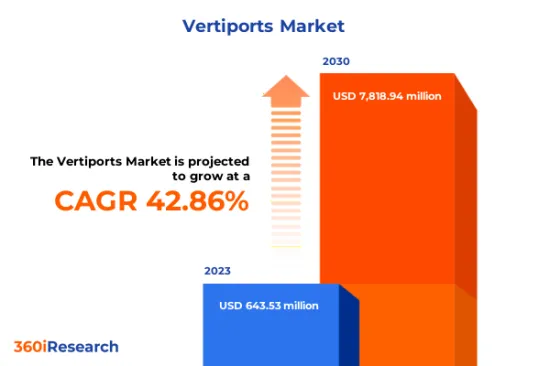
預計2023年Vertiport市場規模為6.4353億美元,2024年將達到9.0211億美元,2030年將達78.1894億美元,複合年成長率為42.86%。
垂直起降機場全球市場
| 主要市場統計 | |
|---|---|
| 基準年[2023] | 64353萬美元 |
| 預測年份 [2024] | 9.0211億美元 |
| 預測年份 [2030] | 7,818,940,000 美元 |
| 複合年成長率(%) | 42.86% |
垂直起降機場是經過策略設計的基礎設施,作為電動垂直起降 (eVTOL) 車輛(例如城市空中計程車、貨運無人機和其他下一代空中運輸解決方案)的營運、維護和管理中心。垂直起落機場是城市空中交通 (UAM) 生態系統的關鍵組成部分,旨在有效地將航空運輸網路整合到現有的城市環境中,而不會對地面系統造成重大干擾。垂直起落機場包括多種促進電動垂直起降車輛無縫運行的設施,包括著陸墊片和平台、客運碼頭、飛機儲存設施、電池和氫燃料電池充電站、空中交通管制系統和維護中心等要素。部署垂直起落機場對於在世界各地實現智慧城市和永續交通舉措至關重要。由於多種因素,垂直起降機場市場正在經歷顯著成長,包括由於城市交通堵塞問題日益嚴重而導致的快速都市化,以及空中計程車和城市空中交通服務的可能性不斷擴大。
此外,eVTOL 技術的不斷進步正在支持 Vertiport 市場的向上成長。儘管具有成長潛力,但垂直起落機場市場面臨著諸如高開發成本以及與垂直起落場相關的航程和負載容量限制等挑戰。另一方面,垂直起落機場開發的持續技術進步以及垂直起落機場與機場和火車站的一體化程度不斷提高,將為未來幾年的垂直起落機場製造商提供機會。
區域洞察
由於快速的都市化和對高效交通系統的需求不斷成長,全球對垂直起落機場的需求正在迅速成長。在美洲,由於先進的基礎設施和主要城市日益堵塞,北美的垂直起降機場正在顯著成長。產業相關人員之間的投資和合作大幅增加,以開發尖端的電動垂直起降飛機和支援它們的垂直起降基礎設施。包括巴西和墨西哥在內的拉丁美洲國家表示有興趣開發城市空中運輸解決方案,包括垂直機場基礎設施。特別是在巴西,該國最大的城市聖保羅已開始大力投資智慧城市計劃,包括透過整合垂直機場進行交通創新。亞太地區持續快速的都市化趨勢將導致交通需求激增,導致道路交通擁擠。隨著中國和印度等國家城市人口密度的增加,政府和私人營業單位正在尋求有效的方法,透過為城市空中交通(UAM) 提供垂直起降(VTOL) 基礎設施來緩解交通狀況。我們認知到垂直起降機場作為交通運輸工具的潛力。方法。在EMEA地區,技術進步是推動垂直起降機場市場擴大的關鍵,因為分散式電力推進系統等技術創新使eVTOL飛機能夠實現垂直起降能力而不產生過多的噪音污染,從而發揮了作用。
此外,政府的支持政策也對垂直起降市場的成長做出了重大貢獻。歐盟航空安全局 (EASA) 和阿拉伯聯合大公國民航局 (GCAA) 等監管機構正在努力製定城市空中運輸(包括垂直機場)的全面認證框架和操作指南。在中東和非洲,隨著各國政府積極探索城市空中交通,使其經濟多元化,擺脫對石油的依賴,並增加快速發展的城市內的連通性,對垂直起落機場基礎設施的投資正在增加。
FPNV定位矩陣
FPNV定位矩陣對於評估Vertiport市場至關重要。我們檢視與業務策略和產品滿意度相關的關鍵指標,以對供應商進行全面評估。這種深入的分析使用戶能夠根據自己的要求做出明智的決策。根據評估,供應商被分為四個成功程度不同的像限:前沿(F)、探路者(P)、利基(N)和重要(V)。
市場佔有率分析
市場佔有率分析是一種綜合工具,可對 Vertiport 市場中供應商的現狀進行富有洞察力和深入的研究。全面比較和分析供應商在整體收益、基本客群和其他關鍵指標方面的貢獻,以便更好地了解公司的績效及其在爭奪市場佔有率時面臨的挑戰。此外,該分析還提供了對該行業競爭特徵的寶貴考察,包括在研究基準年觀察到的累積、分散主導地位和合併特徵等因素。這種詳細程度的提高使供應商能夠做出更明智的決策並制定有效的策略,從而在市場上獲得競爭優勢。
該報告對以下幾個方面提供了寶貴的見解:
1-市場滲透率:提供有關主要企業所服務的市場的全面資訊。
2-市場開拓:我們深入研究利潤豐厚的新興市場,並分析它們在成熟細分市場中的滲透率。
3- 市場多元化:提供有關新產品發布、開拓地區、最新發展和投資的詳細資訊。
4-競爭力評估與資訊:對主要企業的市場佔有率、策略、產品、認證、監管狀況、專利狀況、製造能力等進行全面評估。
5- 產品開發與創新:提供對未來技術、研發活動和突破性產品開發的見解。
本報告解決了以下關鍵問題:
1-Vertiport市場的市場規模和預測是多少?
2-Vertiport 市場預測期內需要考慮投資的產品、細分市場、應用程式和領域有哪些?
3-Vertiport 市場的技術趨勢和法律規範是什麼?
4-Vertiport 市場主要供應商的市場佔有率是多少?
5-進入垂直起降機場市場的適當型態或策略手段是什麼?
目錄
第1章 前言
第2章調查方法
第3章執行摘要
第4章市場概況
第5章市場洞察
- 市場動態
- 促進因素
- 快速都市化加劇了城市的交通堵塞問題
- eVTOL 技術不斷進步
- 擴大空中計程車和城市空中交通服務的可能性
- 抑制因素
- 垂直起落機場開發成本高
- 機會
- 垂直機場開發的持續技術進步
- 加強垂直機場與機場和火車站的整合
- 任務
- 與垂直起落場相關的限制範圍和有效載荷
- 促進因素
- 市場區隔分析
- 類型:更多採用 Verti 輪轂進行電動垂直起降
- 地點:Vertiport 擴大屋頂/高架用途並最大化垂直空間
- 市場趨勢分析
- 高通膨的累積效應
- 波特五力分析
- 價值鍊和關鍵路徑分析
- 法律規範
第6章 垂直起降機場市場:依類型
- 維蒂輪轂
- 伯蒂·巴斯
- 墊片
第 7 章垂直起降機場市場(按地點)
- 地面基地
- 屋頂/高架
第8章 美洲垂直起降市場
- 阿根廷
- 巴西
- 加拿大
- 墨西哥
- 美國
第9章亞太地區垂直起降市場
- 澳洲
- 中國
- 印度
- 印尼
- 日本
- 馬來西亞
- 菲律賓
- 新加坡
- 韓國
- 台灣
- 泰國
- 越南
第10章 歐洲、中東和非洲的垂直起降市場
- 丹麥
- 埃及
- 芬蘭
- 法國
- 德國
- 以色列
- 義大利
- 荷蘭
- 奈及利亞
- 挪威
- 波蘭
- 卡達
- 俄羅斯
- 沙烏地阿拉伯
- 南非
- 西班牙
- 瑞典
- 瑞士
- 土耳其
- 阿拉伯聯合大公國
- 英國
第11章競爭形勢
- FPNV定位矩陣
- 市場佔有率分析:主要企業
- 主要企業競爭情境分析
- 合約、合作和夥伴關係
- 新產品發布和功能增強
第12章競爭產品組合
- 主要公司簡介
- Aeroauto LLC
- airsight GmbH
- ANA HOLDINGS INC
- Aeroports de Paris SA
- Bayards Constructions Group
- Ferrovial SE
- Giancarlo Zema Design Group
- Groupe ADP
- Hanwha
- Hyundai E&C
- Joby Aviation, Inc.
- Kookiejar of Sweden
- Lilium GmbH
- Mott MacDonald
- Siemens AG
- SITA
- Skyports Limited
- Skyscape Corporation
- Skyway
- Urban-Air Port Ltd.
- UrbanV SpA
- Varon Vehicles Corporation
- Vertiko Mobility Inc.
- Volatus Infrastructure & Energy Solutions
- Volocopter GmbH
- VPorts
- 主要產品系列
第13章附錄
- 討論指南
- 關於許可證和定價
[183 Pages Report] The Vertiports Market size was estimated at USD 643.53 million in 2023 and expected to reach USD 902.11 million in 2024, at a CAGR 42.86% to reach USD 7,818.94 million by 2030.
Global Vertiports Market
| KEY MARKET STATISTICS | |
|---|---|
| Base Year [2023] | USD 643.53 million |
| Estimated Year [2024] | USD 902.11 million |
| Forecast Year [2030] | USD 7,818.94 million |
| CAGR (%) | 42.86% |
A vertiport is a strategically designed infrastructure facility that serves as a hub for operating, maintaining, and managing electric vertical takeoff and landing (eVTOL) vehicles, such as urban air taxis, cargo drones, and other next-generation aerial mobility solutions. Vertiports are essential components of urban air mobility (UAM) ecosystems and aim to efficiently integrate aerial transportation networks into existing urban environments without causing significant disruptions to ground-based systems. Vertiports have multiple elements that facilitate seamless operations for eVTOL vehicles, including landing pads or platforms, passenger terminals, aircraft storage facilities, charging stations for batteries or hydrogen fuel cell refueling, air traffic control systems, and maintenance centers. Implementing vertiports is crucial in realizing smart cities and sustainable transportation initiatives worldwide. The vertiport market is experiencing significant growth from various factors, including rapid urbanization with increasing traffic congestion problems across cities and expanding the potential for air taxis and urban air mobility services.
Moreover, increasing advancements in eVTOL technologies support the vertiport market's upward growth. Despite its potential growth, the vertiport market faces challenges, such as the high cost of development and the limited range and payload associated with vertiports. On the other hand, continuous technological advancements in vertiport development and increasing vertiport integration with airports and train stations create an opportunity for vertiport manufacturers in upcoming years.
Regional Insights
The demand for vertiports has surged globally due to rapid urbanization and the increased need for efficient transportation systems. In the Americas, North America has been witnessing significant development of vertiport due to its advanced infrastructure and growing congestion in major cities. There has been a substantial surge in investments and collaborations among industry players to develop cutting-edge eVTOL aircraft and supporting infrastructure like vertiports. Latin American countries, including Brazil and Mexico, have shown interest in exploring urban air mobility solutions, which include vertiport infrastructure. In Brazil particularly, Sao Paulo, the country's largest city, has begun investing heavily in smart city initiatives encompassing transportation innovation through vertiport integration. The ongoing trend of rapid urbanization in the APAC region leads to a surge in transportation demand, resulting in traffic congestion on roads. As cities become more densely populated in countries including China and India, governments and private entities recognize the potential of vertiports as an efficient way to alleviate traffic conditions by providing vertical takeoff and landing (VTOL) infrastructure for Urban Air Mobility (UAM). In the EMEA region, technological advancements play a critical role in propelling the expansion of the vertiport market as innovations such as distributed electric propulsion systems enable eVTOL aircraft to achieve vertical takeoff and landing capabilities without excessive noise pollution.
Moreover, supportive government policies also contribute significantly to the growth of the vertiport market. Regulatory bodies, including the European Union Aviation Safety Agency (EASA) and the United Arab Emirates General Civil Aviation Authority (GCAA), have been working to develop comprehensive certification frameworks and operational guidelines for urban air mobility, including vertiports. In the Middle East and Africa, investment in vertiport infrastructure is surging as governments actively explore UAM to diversify their economies away from oil dependency and enhance connectivity within rapidly growing cities.
FPNV Positioning Matrix
The FPNV Positioning Matrix is pivotal in evaluating the Vertiports Market. It offers a comprehensive assessment of vendors, examining key metrics related to Business Strategy and Product Satisfaction. This in-depth analysis empowers users to make well-informed decisions aligned with their requirements. Based on the evaluation, the vendors are then categorized into four distinct quadrants representing varying levels of success: Forefront (F), Pathfinder (P), Niche (N), or Vital (V).
Market Share Analysis
The Market Share Analysis is a comprehensive tool that provides an insightful and in-depth examination of the current state of vendors in the Vertiports Market. By meticulously comparing and analyzing vendor contributions in terms of overall revenue, customer base, and other key metrics, we can offer companies a greater understanding of their performance and the challenges they face when competing for market share. Additionally, this analysis provides valuable insights into the competitive nature of the sector, including factors such as accumulation, fragmentation dominance, and amalgamation traits observed over the base year period studied. With this expanded level of detail, vendors can make more informed decisions and devise effective strategies to gain a competitive edge in the market.
Key Company Profiles
The report delves into recent significant developments in the Vertiports Market, highlighting leading vendors and their innovative profiles. These include Aeroauto LLC, airsight GmbH, ANA HOLDINGS INC, Aeroports de Paris SA, Bayards Constructions Group, Ferrovial S.E., Giancarlo Zema Design Group, Groupe ADP, Hanwha, Hyundai E&C, Joby Aviation, Inc., Kookiejar of Sweden, Lilium GmbH, Mott MacDonald, Siemens AG, SITA, Skyports Limited, Skyscape Corporation, Skyway, Urban-Air Port Ltd., UrbanV S.p.A, Varon Vehicles Corporation, Vertiko Mobility Inc., Volatus Infrastructure & Energy Solutions, Volocopter GmbH, and VPorts.
Market Segmentation & Coverage
This research report categorizes the Vertiports Market to forecast the revenues and analyze trends in each of the following sub-markets:
- Type
- Verti Hubs
- Vertibases
- Vertipads
- Location
- Ground-based
- Rooftop / Elevated
- Region
- Americas
- Argentina
- Brazil
- Canada
- Mexico
- United States
- California
- Florida
- Illinois
- New York
- Ohio
- Pennsylvania
- Texas
- Asia-Pacific
- Australia
- China
- India
- Indonesia
- Japan
- Malaysia
- Philippines
- Singapore
- South Korea
- Taiwan
- Thailand
- Vietnam
- Europe, Middle East & Africa
- Denmark
- Egypt
- Finland
- France
- Germany
- Israel
- Italy
- Netherlands
- Nigeria
- Norway
- Poland
- Qatar
- Russia
- Saudi Arabia
- South Africa
- Spain
- Sweden
- Switzerland
- Turkey
- United Arab Emirates
- United Kingdom
- Americas
The report offers valuable insights on the following aspects:
1. Market Penetration: It presents comprehensive information on the market provided by key players.
2. Market Development: It delves deep into lucrative emerging markets and analyzes the penetration across mature market segments.
3. Market Diversification: It provides detailed information on new product launches, untapped geographic regions, recent developments, and investments.
4. Competitive Assessment & Intelligence: It conducts an exhaustive assessment of market shares, strategies, products, certifications, regulatory approvals, patent landscape, and manufacturing capabilities of the leading players.
5. Product Development & Innovation: It offers intelligent insights on future technologies, R&D activities, and breakthrough product developments.
The report addresses key questions such as:
1. What is the market size and forecast of the Vertiports Market?
2. Which products, segments, applications, and areas should one consider investing in over the forecast period in the Vertiports Market?
3. What are the technology trends and regulatory frameworks in the Vertiports Market?
4. What is the market share of the leading vendors in the Vertiports Market?
5. Which modes and strategic moves are suitable for entering the Vertiports Market?
Table of Contents
1. Preface
- 1.1. Objectives of the Study
- 1.2. Market Segmentation & Coverage
- 1.3. Years Considered for the Study
- 1.4. Currency & Pricing
- 1.5. Language
- 1.6. Limitations
- 1.7. Assumptions
- 1.8. Stakeholders
2. Research Methodology
- 2.1. Define: Research Objective
- 2.2. Determine: Research Design
- 2.3. Prepare: Research Instrument
- 2.4. Collect: Data Source
- 2.5. Analyze: Data Interpretation
- 2.6. Formulate: Data Verification
- 2.7. Publish: Research Report
- 2.8. Repeat: Report Update
3. Executive Summary
4. Market Overview
- 4.1. Introduction
- 4.2. Vertiports Market, by Region
5. Market Insights
- 5.1. Market Dynamics
- 5.1.1. Drivers
- 5.1.1.1. Rapid urbanization with increasing traffic congestion problems across cities
- 5.1.1.2. Increasing advancements in eVTOL technologies
- 5.1.1.3. Expanding potential for air taxi and urban air mobility services
- 5.1.2. Restraints
- 5.1.2.1. High cost of development of vertiports
- 5.1.3. Opportunities
- 5.1.3.1. Continuous technological advancements in the development of vertiports
- 5.1.3.2. Increasing integration of vertiports with airports and train stations
- 5.1.4. Challenges
- 5.1.4.1. Limited range and payload associated with vertiports
- 5.1.1. Drivers
- 5.2. Market Segmentation Analysis
- 5.2.1. Type: Rising adoption of verti hubs for electric vertical take-off and landing
- 5.2.2. Location: Expanding the application of rooftops/elevated vertiports to maximize the use of vertical space
- 5.3. Market Trend Analysis
- 5.4. Cumulative Impact of High Inflation
- 5.5. Porter's Five Forces Analysis
- 5.5.1. Threat of New Entrants
- 5.5.2. Threat of Substitutes
- 5.5.3. Bargaining Power of Customers
- 5.5.4. Bargaining Power of Suppliers
- 5.5.5. Industry Rivalry
- 5.6. Value Chain & Critical Path Analysis
- 5.7. Regulatory Framework
6. Vertiports Market, by Type
- 6.1. Introduction
- 6.2. Verti Hubs
- 6.3. Vertibases
- 6.4. Vertipads
7. Vertiports Market, by Location
- 7.1. Introduction
- 7.2. Ground-based
- 7.3. Rooftop / Elevated
8. Americas Vertiports Market
- 8.1. Introduction
- 8.2. Argentina
- 8.3. Brazil
- 8.4. Canada
- 8.5. Mexico
- 8.6. United States
9. Asia-Pacific Vertiports Market
- 9.1. Introduction
- 9.2. Australia
- 9.3. China
- 9.4. India
- 9.5. Indonesia
- 9.6. Japan
- 9.7. Malaysia
- 9.8. Philippines
- 9.9. Singapore
- 9.10. South Korea
- 9.11. Taiwan
- 9.12. Thailand
- 9.13. Vietnam
10. Europe, Middle East & Africa Vertiports Market
- 10.1. Introduction
- 10.2. Denmark
- 10.3. Egypt
- 10.4. Finland
- 10.5. France
- 10.6. Germany
- 10.7. Israel
- 10.8. Italy
- 10.9. Netherlands
- 10.10. Nigeria
- 10.11. Norway
- 10.12. Poland
- 10.13. Qatar
- 10.14. Russia
- 10.15. Saudi Arabia
- 10.16. South Africa
- 10.17. Spain
- 10.18. Sweden
- 10.19. Switzerland
- 10.20. Turkey
- 10.21. United Arab Emirates
- 10.22. United Kingdom
11. Competitive Landscape
- 11.1. FPNV Positioning Matrix
- 11.2. Market Share Analysis, By Key Player
- 11.3. Competitive Scenario Analysis, By Key Player
- 11.3.1. Agreement, Collaboration, & Partnership
- 11.3.1.1. Partners Plan Low-Cost Modular Vertiports For eVTOL Aircraft
- 11.3.1.2. New Partnership Launched to Develop Vertiports in the UK
- 11.3.1.3. Lilium and UrbanV to Collaborate on Vertiports in Italy, the French Riviera and Beyond
- 11.3.1.4. UrbanV and SITA Partner to Provide Digital Solutions for Rome Vertiports, Explore Opportunities for Vertiports Globally
- 11.3.2. New Product Launch & Enhancement
- 11.3.2.1. Skyportz Launches Compact Vertiport Design for Property Developers
- 11.3.1. Agreement, Collaboration, & Partnership
12. Competitive Portfolio
- 12.1. Key Company Profiles
- 12.1.1. Aeroauto LLC
- 12.1.2. airsight GmbH
- 12.1.3. ANA HOLDINGS INC
- 12.1.4. Aeroports de Paris SA
- 12.1.5. Bayards Constructions Group
- 12.1.6. Ferrovial S.E.
- 12.1.7. Giancarlo Zema Design Group
- 12.1.8. Groupe ADP
- 12.1.9. Hanwha
- 12.1.10. Hyundai E&C
- 12.1.11. Joby Aviation, Inc.
- 12.1.12. Kookiejar of Sweden
- 12.1.13. Lilium GmbH
- 12.1.14. Mott MacDonald
- 12.1.15. Siemens AG
- 12.1.16. SITA
- 12.1.17. Skyports Limited
- 12.1.18. Skyscape Corporation
- 12.1.19. Skyway
- 12.1.20. Urban-Air Port Ltd.
- 12.1.21. UrbanV S.p.A
- 12.1.22. Varon Vehicles Corporation
- 12.1.23. Vertiko Mobility Inc.
- 12.1.24. Volatus Infrastructure & Energy Solutions
- 12.1.25. Volocopter GmbH
- 12.1.26. VPorts
- 12.2. Key Product Portfolio
13. Appendix
- 13.1. Discussion Guide
- 13.2. License & Pricing
LIST OF FIGURES
- FIGURE 1. VERTIPORTS MARKET RESEARCH PROCESS
- FIGURE 2. VERTIPORTS MARKET SIZE, 2023 VS 2030
- FIGURE 3. VERTIPORTS MARKET SIZE, 2018-2030 (USD MILLION)
- FIGURE 4. VERTIPORTS MARKET SIZE, BY REGION, 2023 VS 2030 (%)
- FIGURE 5. VERTIPORTS MARKET SIZE, BY REGION, 2023 VS 2024 VS 2030 (USD MILLION)
- FIGURE 6. VERTIPORTS MARKET DYNAMICS
- FIGURE 7. VERTIPORTS MARKET SIZE, BY TYPE, 2023 VS 2030 (%)
- FIGURE 8. VERTIPORTS MARKET SIZE, BY TYPE, 2023 VS 2024 VS 2030 (USD MILLION)
- FIGURE 9. VERTIPORTS MARKET SIZE, BY LOCATION, 2023 VS 2030 (%)
- FIGURE 10. VERTIPORTS MARKET SIZE, BY LOCATION, 2023 VS 2024 VS 2030 (USD MILLION)
- FIGURE 11. AMERICAS VERTIPORTS MARKET SIZE, BY COUNTRY, 2023 VS 2030 (%)
- FIGURE 12. AMERICAS VERTIPORTS MARKET SIZE, BY COUNTRY, 2023 VS 2024 VS 2030 (USD MILLION)
- FIGURE 13. UNITED STATES VERTIPORTS MARKET SIZE, BY STATE, 2023 VS 2030 (%)
- FIGURE 14. UNITED STATES VERTIPORTS MARKET SIZE, BY STATE, 2023 VS 2024 VS 2030 (USD MILLION)
- FIGURE 15. ASIA-PACIFIC VERTIPORTS MARKET SIZE, BY COUNTRY, 2023 VS 2030 (%)
- FIGURE 16. ASIA-PACIFIC VERTIPORTS MARKET SIZE, BY COUNTRY, 2023 VS 2024 VS 2030 (USD MILLION)
- FIGURE 17. EUROPE, MIDDLE EAST & AFRICA VERTIPORTS MARKET SIZE, BY COUNTRY, 2023 VS 2030 (%)
- FIGURE 18. EUROPE, MIDDLE EAST & AFRICA VERTIPORTS MARKET SIZE, BY COUNTRY, 2023 VS 2024 VS 2030 (USD MILLION)
- FIGURE 19. VERTIPORTS MARKET, FPNV POSITIONING MATRIX, 2023
- FIGURE 20. VERTIPORTS MARKET SHARE, BY KEY PLAYER, 2023
LIST OF TABLES
- TABLE 1. VERTIPORTS MARKET SEGMENTATION & COVERAGE
- TABLE 2. UNITED STATES DOLLAR EXCHANGE RATE, 2018-2023
- TABLE 3. VERTIPORTS MARKET SIZE, 2018-2030 (USD MILLION)
- TABLE 4. GLOBAL VERTIPORTS MARKET SIZE, BY REGION, 2018-2030 (USD MILLION)
- TABLE 5. VERTIPORTS MARKET SIZE, BY TYPE, 2018-2030 (USD MILLION)
- TABLE 6. VERTIPORTS MARKET SIZE, BY VERTI HUBS, BY REGION, 2018-2030 (USD MILLION)
- TABLE 7. VERTIPORTS MARKET SIZE, BY VERTIBASES, BY REGION, 2018-2030 (USD MILLION)
- TABLE 8. VERTIPORTS MARKET SIZE, BY VERTIPADS, BY REGION, 2018-2030 (USD MILLION)
- TABLE 9. VERTIPORTS MARKET SIZE, BY LOCATION, 2018-2030 (USD MILLION)
- TABLE 10. VERTIPORTS MARKET SIZE, BY GROUND-BASED, BY REGION, 2018-2030 (USD MILLION)
- TABLE 11. VERTIPORTS MARKET SIZE, BY ROOFTOP / ELEVATED, BY REGION, 2018-2030 (USD MILLION)
- TABLE 12. AMERICAS VERTIPORTS MARKET SIZE, BY TYPE, 2018-2030 (USD MILLION)
- TABLE 13. AMERICAS VERTIPORTS MARKET SIZE, BY LOCATION, 2018-2030 (USD MILLION)
- TABLE 14. AMERICAS VERTIPORTS MARKET SIZE, BY COUNTRY, 2018-2030 (USD MILLION)
- TABLE 15. ARGENTINA VERTIPORTS MARKET SIZE, BY TYPE, 2018-2030 (USD MILLION)
- TABLE 16. ARGENTINA VERTIPORTS MARKET SIZE, BY LOCATION, 2018-2030 (USD MILLION)
- TABLE 17. BRAZIL VERTIPORTS MARKET SIZE, BY TYPE, 2018-2030 (USD MILLION)
- TABLE 18. BRAZIL VERTIPORTS MARKET SIZE, BY LOCATION, 2018-2030 (USD MILLION)
- TABLE 19. CANADA VERTIPORTS MARKET SIZE, BY TYPE, 2018-2030 (USD MILLION)
- TABLE 20. CANADA VERTIPORTS MARKET SIZE, BY LOCATION, 2018-2030 (USD MILLION)
- TABLE 21. MEXICO VERTIPORTS MARKET SIZE, BY TYPE, 2018-2030 (USD MILLION)
- TABLE 22. MEXICO VERTIPORTS MARKET SIZE, BY LOCATION, 2018-2030 (USD MILLION)
- TABLE 23. UNITED STATES VERTIPORTS MARKET SIZE, BY TYPE, 2018-2030 (USD MILLION)
- TABLE 24. UNITED STATES VERTIPORTS MARKET SIZE, BY LOCATION, 2018-2030 (USD MILLION)
- TABLE 25. UNITED STATES VERTIPORTS MARKET SIZE, BY STATE, 2018-2030 (USD MILLION)
- TABLE 26. ASIA-PACIFIC VERTIPORTS MARKET SIZE, BY TYPE, 2018-2030 (USD MILLION)
- TABLE 27. ASIA-PACIFIC VERTIPORTS MARKET SIZE, BY LOCATION, 2018-2030 (USD MILLION)
- TABLE 28. ASIA-PACIFIC VERTIPORTS MARKET SIZE, BY COUNTRY, 2018-2030 (USD MILLION)
- TABLE 29. AUSTRALIA VERTIPORTS MARKET SIZE, BY TYPE, 2018-2030 (USD MILLION)
- TABLE 30. AUSTRALIA VERTIPORTS MARKET SIZE, BY LOCATION, 2018-2030 (USD MILLION)
- TABLE 31. CHINA VERTIPORTS MARKET SIZE, BY TYPE, 2018-2030 (USD MILLION)
- TABLE 32. CHINA VERTIPORTS MARKET SIZE, BY LOCATION, 2018-2030 (USD MILLION)
- TABLE 33. INDIA VERTIPORTS MARKET SIZE, BY TYPE, 2018-2030 (USD MILLION)
- TABLE 34. INDIA VERTIPORTS MARKET SIZE, BY LOCATION, 2018-2030 (USD MILLION)
- TABLE 35. INDONESIA VERTIPORTS MARKET SIZE, BY TYPE, 2018-2030 (USD MILLION)
- TABLE 36. INDONESIA VERTIPORTS MARKET SIZE, BY LOCATION, 2018-2030 (USD MILLION)
- TABLE 37. JAPAN VERTIPORTS MARKET SIZE, BY TYPE, 2018-2030 (USD MILLION)
- TABLE 38. JAPAN VERTIPORTS MARKET SIZE, BY LOCATION, 2018-2030 (USD MILLION)
- TABLE 39. MALAYSIA VERTIPORTS MARKET SIZE, BY TYPE, 2018-2030 (USD MILLION)
- TABLE 40. MALAYSIA VERTIPORTS MARKET SIZE, BY LOCATION, 2018-2030 (USD MILLION)
- TABLE 41. PHILIPPINES VERTIPORTS MARKET SIZE, BY TYPE, 2018-2030 (USD MILLION)
- TABLE 42. PHILIPPINES VERTIPORTS MARKET SIZE, BY LOCATION, 2018-2030 (USD MILLION)
- TABLE 43. SINGAPORE VERTIPORTS MARKET SIZE, BY TYPE, 2018-2030 (USD MILLION)
- TABLE 44. SINGAPORE VERTIPORTS MARKET SIZE, BY LOCATION, 2018-2030 (USD MILLION)
- TABLE 45. SOUTH KOREA VERTIPORTS MARKET SIZE, BY TYPE, 2018-2030 (USD MILLION)
- TABLE 46. SOUTH KOREA VERTIPORTS MARKET SIZE, BY LOCATION, 2018-2030 (USD MILLION)
- TABLE 47. TAIWAN VERTIPORTS MARKET SIZE, BY TYPE, 2018-2030 (USD MILLION)
- TABLE 48. TAIWAN VERTIPORTS MARKET SIZE, BY LOCATION, 2018-2030 (USD MILLION)
- TABLE 49. THAILAND VERTIPORTS MARKET SIZE, BY TYPE, 2018-2030 (USD MILLION)
- TABLE 50. THAILAND VERTIPORTS MARKET SIZE, BY LOCATION, 2018-2030 (USD MILLION)
- TABLE 51. VIETNAM VERTIPORTS MARKET SIZE, BY TYPE, 2018-2030 (USD MILLION)
- TABLE 52. VIETNAM VERTIPORTS MARKET SIZE, BY LOCATION, 2018-2030 (USD MILLION)
- TABLE 53. EUROPE, MIDDLE EAST & AFRICA VERTIPORTS MARKET SIZE, BY TYPE, 2018-2030 (USD MILLION)
- TABLE 54. EUROPE, MIDDLE EAST & AFRICA VERTIPORTS MARKET SIZE, BY LOCATION, 2018-2030 (USD MILLION)
- TABLE 55. EUROPE, MIDDLE EAST & AFRICA VERTIPORTS MARKET SIZE, BY COUNTRY, 2018-2030 (USD MILLION)
- TABLE 56. DENMARK VERTIPORTS MARKET SIZE, BY TYPE, 2018-2030 (USD MILLION)
- TABLE 57. DENMARK VERTIPORTS MARKET SIZE, BY LOCATION, 2018-2030 (USD MILLION)
- TABLE 58. EGYPT VERTIPORTS MARKET SIZE, BY TYPE, 2018-2030 (USD MILLION)
- TABLE 59. EGYPT VERTIPORTS MARKET SIZE, BY LOCATION, 2018-2030 (USD MILLION)
- TABLE 60. FINLAND VERTIPORTS MARKET SIZE, BY TYPE, 2018-2030 (USD MILLION)
- TABLE 61. FINLAND VERTIPORTS MARKET SIZE, BY LOCATION, 2018-2030 (USD MILLION)
- TABLE 62. FRANCE VERTIPORTS MARKET SIZE, BY TYPE, 2018-2030 (USD MILLION)
- TABLE 63. FRANCE VERTIPORTS MARKET SIZE, BY LOCATION, 2018-2030 (USD MILLION)
- TABLE 64. GERMANY VERTIPORTS MARKET SIZE, BY TYPE, 2018-2030 (USD MILLION)
- TABLE 65. GERMANY VERTIPORTS MARKET SIZE, BY LOCATION, 2018-2030 (USD MILLION)
- TABLE 66. ISRAEL VERTIPORTS MARKET SIZE, BY TYPE, 2018-2030 (USD MILLION)
- TABLE 67. ISRAEL VERTIPORTS MARKET SIZE, BY LOCATION, 2018-2030 (USD MILLION)
- TABLE 68. ITALY VERTIPORTS MARKET SIZE, BY TYPE, 2018-2030 (USD MILLION)
- TABLE 69. ITALY VERTIPORTS MARKET SIZE, BY LOCATION, 2018-2030 (USD MILLION)
- TABLE 70. NETHERLANDS VERTIPORTS MARKET SIZE, BY TYPE, 2018-2030 (USD MILLION)
- TABLE 71. NETHERLANDS VERTIPORTS MARKET SIZE, BY LOCATION, 2018-2030 (USD MILLION)
- TABLE 72. NIGERIA VERTIPORTS MARKET SIZE, BY TYPE, 2018-2030 (USD MILLION)
- TABLE 73. NIGERIA VERTIPORTS MARKET SIZE, BY LOCATION, 2018-2030 (USD MILLION)
- TABLE 74. NORWAY VERTIPORTS MARKET SIZE, BY TYPE, 2018-2030 (USD MILLION)
- TABLE 75. NORWAY VERTIPORTS MARKET SIZE, BY LOCATION, 2018-2030 (USD MILLION)
- TABLE 76. POLAND VERTIPORTS MARKET SIZE, BY TYPE, 2018-2030 (USD MILLION)
- TABLE 77. POLAND VERTIPORTS MARKET SIZE, BY LOCATION, 2018-2030 (USD MILLION)
- TABLE 78. QATAR VERTIPORTS MARKET SIZE, BY TYPE, 2018-2030 (USD MILLION)
- TABLE 79. QATAR VERTIPORTS MARKET SIZE, BY LOCATION, 2018-2030 (USD MILLION)
- TABLE 80. RUSSIA VERTIPORTS MARKET SIZE, BY TYPE, 2018-2030 (USD MILLION)
- TABLE 81. RUSSIA VERTIPORTS MARKET SIZE, BY LOCATION, 2018-2030 (USD MILLION)
- TABLE 82. SAUDI ARABIA VERTIPORTS MARKET SIZE, BY TYPE, 2018-2030 (USD MILLION)
- TABLE 83. SAUDI ARABIA VERTIPORTS MARKET SIZE, BY LOCATION, 2018-2030 (USD MILLION)
- TABLE 84. SOUTH AFRICA VERTIPORTS MARKET SIZE, BY TYPE, 2018-2030 (USD MILLION)
- TABLE 85. SOUTH AFRICA VERTIPORTS MARKET SIZE, BY LOCATION, 2018-2030 (USD MILLION)
- TABLE 86. SPAIN VERTIPORTS MARKET SIZE, BY TYPE, 2018-2030 (USD MILLION)
- TABLE 87. SPAIN VERTIPORTS MARKET SIZE, BY LOCATION, 2018-2030 (USD MILLION)
- TABLE 88. SWEDEN VERTIPORTS MARKET SIZE, BY TYPE, 2018-2030 (USD MILLION)
- TABLE 89. SWEDEN VERTIPORTS MARKET SIZE, BY LOCATION, 2018-2030 (USD MILLION)
- TABLE 90. SWITZERLAND VERTIPORTS MARKET SIZE, BY TYPE, 2018-2030 (USD MILLION)
- TABLE 91. SWITZERLAND VERTIPORTS MARKET SIZE, BY LOCATION, 2018-2030 (USD MILLION)
- TABLE 92. TURKEY VERTIPORTS MARKET SIZE, BY TYPE, 2018-2030 (USD MILLION)
- TABLE 93. TURKEY VERTIPORTS MARKET SIZE, BY LOCATION, 2018-2030 (USD MILLION)
- TABLE 94. UNITED ARAB EMIRATES VERTIPORTS MARKET SIZE, BY TYPE, 2018-2030 (USD MILLION)
- TABLE 95. UNITED ARAB EMIRATES VERTIPORTS MARKET SIZE, BY LOCATION, 2018-2030 (USD MILLION)
- TABLE 96. UNITED KINGDOM VERTIPORTS MARKET SIZE, BY TYPE, 2018-2030 (USD MILLION)
- TABLE 97. UNITED KINGDOM VERTIPORTS MARKET SIZE, BY LOCATION, 2018-2030 (USD MILLION)
- TABLE 98. VERTIPORTS MARKET, FPNV POSITIONING MATRIX, 2023
- TABLE 99. VERTIPORTS MARKET SHARE, BY KEY PLAYER, 2023
- TABLE 100. VERTIPORTS MARKET LICENSE & PRICING
 全球城市空中交通 (UAM) 市場:市場規模和佔有率分析 - 趨勢、驅動因素、競爭格局、未來預測(2024-2030 年)
 2024 年城市空中交通全球市場報告
 城市空中交通市場報告:2030 年趨勢、預測與競爭分析
 UAM 基礎設施市場的全球市場按運營、構成、最終用戶、生態系統和國家分類(2023-2033)
 城市空中交通的全球市場
 城市空中交通市場:按組件、範圍、平台營運、平台架構、最終用戶 - 2023-2030 年全球預測
 城市空中交通 (UAM) 和垂直機場:市場及技術的預測 (~2031年)
 城市空中交通的經營模式:air taxi,個人無人機,車輛的第3維
 城市空中交通的全球市場
 2023-2027 年全球城市空中交通市場