


 |
市場調查報告書
商品編碼
1415324
照明智慧佔用感測器市場:按感測器類型、操作和應用分類 - 2024-2030 年全球預測Smart Occupancy Sensors in Lighting Applications Market by Sensor Type (Dual-technology Sensors, Microwave Sensors, Passive Infrared (PIR) Sensors), Operation (Indoor Operation, Outdoor Operation), Application - Global Forecast 2024-2030 |
||||||
※ 本網頁內容可能與最新版本有所差異。詳細情況請與我們聯繫。
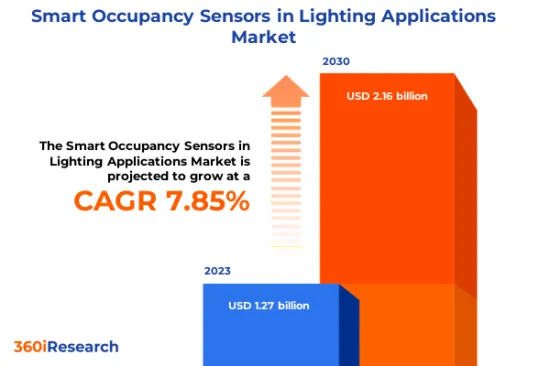
用於照明的智慧空間感測器市場規模預計2023年為12.7億美元,2024年達到13.7億美元,預計2030年將達到21.6億美元,複合年成長率為7.85%。
照明智慧佔用感測器的全球市場
| 主要市場統計 | |
|---|---|
| 基準年[2023] | 12.7億美元 |
| 預測年份 [2024] | 13.7億美元 |
| 預測年份 [2030] | 21.6億美元 |
| 複合年成長率(%) | 7.85% |
佔用感測器是專用的設備,可以偵測特定區域中是否有人,並相應地自動控制照明系統。在照明應用中,此感測器可提高能源效率、降低營運成本並提高使用者舒適度。隨著世界對節能的日益重視,各國政府正在實施嚴格的法規,要求採用節能照明解決方案。消費者對永續生活方式習慣的認知不斷提高,加速了對整合佔用感應功能的智慧照明系統的需求。然而,感測器精度低以及不同照明控制系統和傳統基礎設施之間的兼容性問題正在影響產品的普及。開拓保持高性能標準的低成本感測解決方案可以擴大市場範圍,同時迎合精打細算的客戶。探索人工智慧 (AI) 和機器學習演算法等精確檢測的新技術,可以提高佔用偵測能力並減少錯誤觸發。照明控制系統供應商和物聯網設備製造商之間的合作可以為整個智慧家庭生態系統的無縫整合鋪平道路。
區域洞察
由於基礎設施的強勁發展和節能意識的不斷增強,美洲地區在佔用感測器市場中佔據重要地位。隨著美國和加拿大為綠色建築技術提供眾多激勵措施並增加建設活動,該地區對照明佔用感測器的需求正在加速成長。由於快速的都市化和工業擴張,亞洲照明佔用感測器市場正在經歷顯著成長。在中國和印度等國家,對節能解決方案的需求持續成長,智慧城市計劃也不斷增加。雖然亞洲擁有完善的區域公司組合,但亞洲仍是國際公司製造能力的中心。在歐洲,對減少能源消費量的強烈興趣推動了照明佔用感測器的成長。歐盟 (EU) 嚴格的能源效率目標正在推動成員國在照明應用中採用更智慧的技術,從而導致對佔用感測器的需求增加。此外,該地區越來越多的趨勢是使用包含佔用感測器功能的智慧照明系統來維修現有建築物。歐洲公司為歐洲佔用感測器的生產和創新做出了巨大貢獻。
FPNV定位矩陣
FPNV定位矩陣對於評估照明智慧佔用感測器市場至關重要。我們檢視與業務策略和產品滿意度相關的關鍵指標,以對供應商進行全面評估。這種深入的分析使用戶能夠根據自己的要求做出明智的決策。根據評估,供應商被分為四個成功程度不同的像限:前沿(F)、探路者(P)、利基(N)和重要(V)。
市場佔有率分析
市場佔有率分析是一種綜合工具,可對照明智慧佔用感測器市場供應商的現狀進行深入而詳細的研究。全面比較和分析供應商在整體收益、基本客群和其他關鍵指標方面的貢獻,以便更好地了解公司的績效及其在爭奪市場佔有率時面臨的挑戰。此外,該分析還提供了對該行業競爭特徵的寶貴考察,包括在研究基準年觀察到的累積、分散主導地位和合併特徵等因素。這種詳細程度的提高使供應商能夠做出更明智的決策並制定有效的策略,從而在市場上獲得競爭優勢。
該報告對以下幾個方面提供了寶貴的見解:
1-市場滲透率:提供有關主要企業所服務的市場的全面資訊。
2-市場開拓:我們深入研究利潤豐厚的新興市場,並分析它們在成熟細分市場中的滲透率。
3- 市場多元化:提供有關新產品發布、開拓地區、最新發展和投資的詳細資訊。
4-競爭力評估與資訊:對主要企業的市場佔有率、策略、產品、認證、監管狀況、專利狀況、製造能力等進行全面評估。
5- 產品開發與創新:提供對未來技術、研發活動和突破性產品開發的見解。
本報告解決了以下關鍵問題:
1-照明智慧佔用感測器市場的市場規模和預測是多少?
2-在智慧照明感測器市場預測期內,有哪些產品、細分市場、應用和領域需要考慮投資?
3-照明智慧佔用感測器市場的技術趨勢和法律規範是什麼?
4-照明智慧佔用感測器市場主要供應商的市場佔有率是多少?
5-進入照明智慧佔位感測器市場的合適型態和策略手段是什麼?
目錄
第1章 前言
第2章調查方法
第3章執行摘要
第4章市場概況
第5章市場洞察
- 市場動態
- 促進因素
- 政府提高照明應用能源效率的舉措
- 在 ADAS 和電動車照明管理中使用佔用感應器
- 抑制因素
- 各種照明控制系統與傳統基礎設施之間的相容性問題
- 機會
- 照明佔用感測器模型和設計的進步
- 智慧建築、智慧家庭建設投資增加
- 任務
- 與誤報和占用感測器不準確相關的限制
- 促進因素
- 市場區隔分析
- 感測器類型:雙技術感測器提高可靠性和準確性
- 操作:室內佔用感測器經濟實惠且易於安裝的特點
- 應用:在與佔用感測器整合的建築照明中觀察到節能並提高居住者舒適度
- 市場趨勢分析
- 高通膨的累積效應
- 波特五力分析
- 價值鍊和關鍵路徑分析
- 法律規範
第 6 章照明市場智慧空間感測器(按感測器類型)
- 雙技術感測器
- 微波感測器
- 被動紅外線 (PIR) 感測器
- 超音波感測器
第7章照明智慧佔用感光元件市場:依營運分類
- 室內操作
- 戶外作業
第 8 章照明智慧空間感測器市場:按應用分類
- 汽車照明
- 建築照明
第9章北美和南美照明智慧佔用感應器市場
- 阿根廷
- 巴西
- 加拿大
- 墨西哥
- 美國
第10章亞太地區照明智慧佔用感測器市場
- 澳洲
- 中國
- 印度
- 印尼
- 日本
- 馬來西亞
- 菲律賓
- 新加坡
- 韓國
- 台灣
- 泰國
- 越南
第11章歐洲、中東和非洲照明智慧佔用感測器市場
- 丹麥
- 埃及
- 芬蘭
- 法國
- 德國
- 以色列
- 義大利
- 荷蘭
- 奈及利亞
- 挪威
- 波蘭
- 卡達
- 俄羅斯
- 沙烏地阿拉伯
- 南非
- 西班牙
- 瑞典
- 瑞士
- 土耳其
- 阿拉伯聯合大公國
- 英國
第12章競爭形勢
- FPNV定位矩陣
- 市場佔有率分析:按主要企業分類
- 主要企業競爭情境分析
- 併購
- 合約、合作和夥伴關係
- 新產品發布和功能增強
第13章競爭產品組合
- 主要公司簡介
- AP Associates
- Accu-Tech Lighting Solutions
- Acuity Brands, Inc.
- Alan Manufacturing, Inc.
- Analog Devices, Inc.
- Eaton Corporation PLC
- Enlighted, Inc. by Siemens SE
- General Electric Company
- Honeywell International Inc.
- Hubbell Incorporated
- Johnson Controls International PLC
- Legrand SA
- Leviton Manufacturing Co., Inc.
- Lutron Electronics Co., Inc.
- Novelda AS
- Paamvi Group
- Panasonic Corporation
- PointGrab Inc.
- Schneider Electric SE
- Signify NV by Koninklijke Philips NV
- Starrbot Automations Pvt. Ltd.
- TE Connectivity Ltd.
- Telkonet, Inc.
- 主要產品系列
第14章附錄
- 討論指南
- 關於許可證和定價
[197 Pages Report] The Smart Occupancy Sensors in Lighting Applications Market size was estimated at USD 1.27 billion in 2023 and expected to reach USD 1.37 billion in 2024, at a CAGR 7.85% to reach USD 2.16 billion by 2030.
Global Smart Occupancy Sensors in Lighting Applications Market
| KEY MARKET STATISTICS | |
|---|---|
| Base Year [2023] | USD 1.27 billion |
| Estimated Year [2024] | USD 1.37 billion |
| Forecast Year [2030] | USD 2.16 billion |
| CAGR (%) | 7.85% |
An occupancy sensor is a specialized device that detects the presence of people in a specific area and automatically controls the lighting system accordingly. In lighting applications, these sensors improve energy efficiency, reduce operational costs, and enhance user comfort. A growing global emphasis on energy conservation has prompted governments worldwide to implement stringent regulations demanding energy-efficient lighting solutions. Increasing consumer awareness about sustainable living practices has accelerated the demand for smart lighting systems with integrated occupancy sensing capabilities. However, the inaccuracy of sensors and compatibility issues between different lighting control systems and legacy infrastructure impact product adoption. The development of low-cost sensing solutions that maintain high-performance standards can cater to budget-conscious clients while simultaneously expanding market reach. Researching novel techniques for accurate detection, including artificial intelligence (AI) and machine learning algorithms, can help improve occupancy sensing capabilities and mitigate false triggers. Collaborations between lighting control system providers and IoT device manufacturers could pave the way for more seamless integration across smart home ecosystems.
Regional Insights
The Americas region is a significant player in the occupancy sensors market due to its robust infrastructure development and increasing awareness regarding energy conservation. Numerous incentives provided for green building technologies and growing construction activities in the U.S. and Canada have accelerated the demand for an occupancy sensor for lighting in the region. Asia's occupancy sensor for lighting market showcases an impressive growth trajectory due to rapid urbanization and industrial expansion. Countries such as China and India are witnessing an ever-growing demand for energy-efficient solutions and a rise in smart city projects. Asia serves as a hub for manufacturing capabilities for international players while having an established portfolio from regional companies. Europe's strong focus on reducing energy consumption has accelerated the growth of occupancy sensors for lighting applications within its boundaries. The European Union's strict energy efficiency targets encourage member countries to incorporate smarter technologies in their lighting applications, resulting in a higher demand for occupancy sensors. The region also witnesses an increasing trend of retrofitting existing buildings with smart lighting systems that include occupancy sensing capabilities. European companies contribute significantly to the production and innovation of occupancy sensors within Europe.
FPNV Positioning Matrix
The FPNV Positioning Matrix is pivotal in evaluating the Smart Occupancy Sensors in Lighting Applications Market. It offers a comprehensive assessment of vendors, examining key metrics related to Business Strategy and Product Satisfaction. This in-depth analysis empowers users to make well-informed decisions aligned with their requirements. Based on the evaluation, the vendors are then categorized into four distinct quadrants representing varying levels of success: Forefront (F), Pathfinder (P), Niche (N), or Vital (V).
Market Share Analysis
The Market Share Analysis is a comprehensive tool that provides an insightful and in-depth examination of the current state of vendors in the Smart Occupancy Sensors in Lighting Applications Market. By meticulously comparing and analyzing vendor contributions in terms of overall revenue, customer base, and other key metrics, we can offer companies a greater understanding of their performance and the challenges they face when competing for market share. Additionally, this analysis provides valuable insights into the competitive nature of the sector, including factors such as accumulation, fragmentation dominance, and amalgamation traits observed over the base year period studied. With this expanded level of detail, vendors can make more informed decisions and devise effective strategies to gain a competitive edge in the market.
Key Company Profiles
The report delves into recent significant developments in the Smart Occupancy Sensors in Lighting Applications Market, highlighting leading vendors and their innovative profiles. These include A.P. Associates, Accu-Tech Lighting Solutions, Acuity Brands, Inc., Alan Manufacturing, Inc., Analog Devices, Inc., Eaton Corporation PLC, Enlighted, Inc. by Siemens SE, General Electric Company, Honeywell International Inc., Hubbell Incorporated, Johnson Controls International PLC, Legrand SA, Leviton Manufacturing Co., Inc., Lutron Electronics Co., Inc., Novelda AS, Paamvi Group, Panasonic Corporation, PointGrab Inc., Schneider Electric SE, Signify N.V. by Koninklijke Philips N.V., Starrbot Automations Pvt. Ltd., TE Connectivity Ltd., and Telkonet, Inc..
Market Segmentation & Coverage
This research report categorizes the Smart Occupancy Sensors in Lighting Applications Market to forecast the revenues and analyze trends in each of the following sub-markets:
- Sensor Type
- Dual-technology Sensors
- Microwave Sensors
- Passive Infrared (PIR) Sensors
- Ultrasonic Sensors
- Operation
- Indoor Operation
- Outdoor Operation
- Application
- Automotive Lightings
- Building Lightings
- Region
- Americas
- Argentina
- Brazil
- Canada
- Mexico
- United States
- California
- Florida
- Illinois
- New York
- Ohio
- Pennsylvania
- Texas
- Asia-Pacific
- Australia
- China
- India
- Indonesia
- Japan
- Malaysia
- Philippines
- Singapore
- South Korea
- Taiwan
- Thailand
- Vietnam
- Europe, Middle East & Africa
- Denmark
- Egypt
- Finland
- France
- Germany
- Israel
- Italy
- Netherlands
- Nigeria
- Norway
- Poland
- Qatar
- Russia
- Saudi Arabia
- South Africa
- Spain
- Sweden
- Switzerland
- Turkey
- United Arab Emirates
- United Kingdom
- Americas
The report offers valuable insights on the following aspects:
1. Market Penetration: It presents comprehensive information on the market provided by key players.
2. Market Development: It delves deep into lucrative emerging markets and analyzes the penetration across mature market segments.
3. Market Diversification: It provides detailed information on new product launches, untapped geographic regions, recent developments, and investments.
4. Competitive Assessment & Intelligence: It conducts an exhaustive assessment of market shares, strategies, products, certifications, regulatory approvals, patent landscape, and manufacturing capabilities of the leading players.
5. Product Development & Innovation: It offers intelligent insights on future technologies, R&D activities, and breakthrough product developments.
The report addresses key questions such as:
1. What is the market size and forecast of the Smart Occupancy Sensors in Lighting Applications Market?
2. Which products, segments, applications, and areas should one consider investing in over the forecast period in the Smart Occupancy Sensors in Lighting Applications Market?
3. What are the technology trends and regulatory frameworks in the Smart Occupancy Sensors in Lighting Applications Market?
4. What is the market share of the leading vendors in the Smart Occupancy Sensors in Lighting Applications Market?
5. Which modes and strategic moves are suitable for entering the Smart Occupancy Sensors in Lighting Applications Market?
Table of Contents
1. Preface
- 1.1. Objectives of the Study
- 1.2. Market Segmentation & Coverage
- 1.3. Years Considered for the Study
- 1.4. Currency & Pricing
- 1.5. Language
- 1.6. Limitations
- 1.7. Assumptions
- 1.8. Stakeholders
2. Research Methodology
- 2.1. Define: Research Objective
- 2.2. Determine: Research Design
- 2.3. Prepare: Research Instrument
- 2.4. Collect: Data Source
- 2.5. Analyze: Data Interpretation
- 2.6. Formulate: Data Verification
- 2.7. Publish: Research Report
- 2.8. Repeat: Report Update
3. Executive Summary
4. Market Overview
- 4.1. Introduction
- 4.2. Smart Occupancy Sensors in Lighting Applications Market, by Region
5. Market Insights
- 5.1. Market Dynamics
- 5.1.1. Drivers
- 5.1.1.1. Government initiatives promoting energy efficiency in lighting applications
- 5.1.1.2. Use of occupancy sensors in ADAS and electric vehicle lighting management
- 5.1.2. Restraints
- 5.1.2.1. Compatibility issues between different lighting control systems and legacy infrastructure
- 5.1.3. Opportunities
- 5.1.3.1. Advancements in models and designs of occupancy sensors for lights
- 5.1.3.2. Rising investments in constructing smart buildings and homes
- 5.1.4. Challenges
- 5.1.4.1. Limitations associated with false positives and inaccuracy of occupancy sensors
- 5.1.1. Drivers
- 5.2. Market Segmentation Analysis
- 5.2.1. Sensor Type: Increased reliability and accuracy of dual technology sensors
- 5.2.2. Operation: Affordability and easy installation capabilities of indoor occupancy sensors
- 5.2.3. Application: Improved energy savings and occupant comfort observed in building lightings integrated with occupancy sensors
- 5.3. Market Trend Analysis
- 5.4. Cumulative Impact of High Inflation
- 5.5. Porter's Five Forces Analysis
- 5.5.1. Threat of New Entrants
- 5.5.2. Threat of Substitutes
- 5.5.3. Bargaining Power of Customers
- 5.5.4. Bargaining Power of Suppliers
- 5.5.5. Industry Rivalry
- 5.6. Value Chain & Critical Path Analysis
- 5.7. Regulatory Framework
6. Smart Occupancy Sensors in Lighting Applications Market, by Sensor Type
- 6.1. Introduction
- 6.2. Dual-technology Sensors
- 6.3. Microwave Sensors
- 6.4. Passive Infrared (PIR) Sensors
- 6.5. Ultrasonic Sensors
7. Smart Occupancy Sensors in Lighting Applications Market, by Operation
- 7.1. Introduction
- 7.2. Indoor Operation
- 7.3. Outdoor Operation
8. Smart Occupancy Sensors in Lighting Applications Market, by Application
- 8.1. Introduction
- 8.2. Automotive Lightings
- 8.3. Building Lightings
9. Americas Smart Occupancy Sensors in Lighting Applications Market
- 9.1. Introduction
- 9.2. Argentina
- 9.3. Brazil
- 9.4. Canada
- 9.5. Mexico
- 9.6. United States
10. Asia-Pacific Smart Occupancy Sensors in Lighting Applications Market
- 10.1. Introduction
- 10.2. Australia
- 10.3. China
- 10.4. India
- 10.5. Indonesia
- 10.6. Japan
- 10.7. Malaysia
- 10.8. Philippines
- 10.9. Singapore
- 10.10. South Korea
- 10.11. Taiwan
- 10.12. Thailand
- 10.13. Vietnam
11. Europe, Middle East & Africa Smart Occupancy Sensors in Lighting Applications Market
- 11.1. Introduction
- 11.2. Denmark
- 11.3. Egypt
- 11.4. Finland
- 11.5. France
- 11.6. Germany
- 11.7. Israel
- 11.8. Italy
- 11.9. Netherlands
- 11.10. Nigeria
- 11.11. Norway
- 11.12. Poland
- 11.13. Qatar
- 11.14. Russia
- 11.15. Saudi Arabia
- 11.16. South Africa
- 11.17. Spain
- 11.18. Sweden
- 11.19. Switzerland
- 11.20. Turkey
- 11.21. United Arab Emirates
- 11.22. United Kingdom
12. Competitive Landscape
- 12.1. FPNV Positioning Matrix
- 12.2. Market Share Analysis, By Key Player
- 12.3. Competitive Scenario Analysis, By Key Player
- 12.3.1. Merger & Acquisition
- 12.3.1.1. Signify Acquires Key Assets of Douglas Lighting Controls
- 12.3.2. Agreement, Collaboration, & Partnership
- 12.3.2.1. Cosmicnode Announces Exciting Partnership With Industry Leader In Lighting Sensors
- 12.3.3. New Product Launch & Enhancement
- 12.3.3.1. Current Launches NX Dual Tech OMNI Module
- 12.3.1. Merger & Acquisition
13. Competitive Portfolio
- 13.1. Key Company Profiles
- 13.1.1. A.P. Associates
- 13.1.2. Accu-Tech Lighting Solutions
- 13.1.3. Acuity Brands, Inc.
- 13.1.4. Alan Manufacturing, Inc.
- 13.1.5. Analog Devices, Inc.
- 13.1.6. Eaton Corporation PLC
- 13.1.7. Enlighted, Inc. by Siemens SE
- 13.1.8. General Electric Company
- 13.1.9. Honeywell International Inc.
- 13.1.10. Hubbell Incorporated
- 13.1.11. Johnson Controls International PLC
- 13.1.12. Legrand SA
- 13.1.13. Leviton Manufacturing Co., Inc.
- 13.1.14. Lutron Electronics Co., Inc.
- 13.1.15. Novelda AS
- 13.1.16. Paamvi Group
- 13.1.17. Panasonic Corporation
- 13.1.18. PointGrab Inc.
- 13.1.19. Schneider Electric SE
- 13.1.20. Signify N.V. by Koninklijke Philips N.V.
- 13.1.21. Starrbot Automations Pvt. Ltd.
- 13.1.22. TE Connectivity Ltd.
- 13.1.23. Telkonet, Inc.
- 13.2. Key Product Portfolio
14. Appendix
- 14.1. Discussion Guide
- 14.2. License & Pricing
LIST OF FIGURES
- FIGURE 1. SMART OCCUPANCY SENSORS IN LIGHTING APPLICATIONS MARKET RESEARCH PROCESS
- FIGURE 2. SMART OCCUPANCY SENSORS IN LIGHTING APPLICATIONS MARKET SIZE, 2023 VS 2030
- FIGURE 3. SMART OCCUPANCY SENSORS IN LIGHTING APPLICATIONS MARKET SIZE, 2018-2030 (USD MILLION)
- FIGURE 4. SMART OCCUPANCY SENSORS IN LIGHTING APPLICATIONS MARKET SIZE, BY REGION, 2023 VS 2030 (%)
- FIGURE 5. SMART OCCUPANCY SENSORS IN LIGHTING APPLICATIONS MARKET SIZE, BY REGION, 2023 VS 2024 VS 2030 (USD MILLION)
- FIGURE 6. SMART OCCUPANCY SENSORS IN LIGHTING APPLICATIONS MARKET DYNAMICS
- FIGURE 7. SMART OCCUPANCY SENSORS IN LIGHTING APPLICATIONS MARKET SIZE, BY SENSOR TYPE, 2023 VS 2030 (%)
- FIGURE 8. SMART OCCUPANCY SENSORS IN LIGHTING APPLICATIONS MARKET SIZE, BY SENSOR TYPE, 2023 VS 2024 VS 2030 (USD MILLION)
- FIGURE 9. SMART OCCUPANCY SENSORS IN LIGHTING APPLICATIONS MARKET SIZE, BY OPERATION, 2023 VS 2030 (%)
- FIGURE 10. SMART OCCUPANCY SENSORS IN LIGHTING APPLICATIONS MARKET SIZE, BY OPERATION, 2023 VS 2024 VS 2030 (USD MILLION)
- FIGURE 11. SMART OCCUPANCY SENSORS IN LIGHTING APPLICATIONS MARKET SIZE, BY APPLICATION, 2023 VS 2030 (%)
- FIGURE 12. SMART OCCUPANCY SENSORS IN LIGHTING APPLICATIONS MARKET SIZE, BY APPLICATION, 2023 VS 2024 VS 2030 (USD MILLION)
- FIGURE 13. AMERICAS SMART OCCUPANCY SENSORS IN LIGHTING APPLICATIONS MARKET SIZE, BY COUNTRY, 2023 VS 2030 (%)
- FIGURE 14. AMERICAS SMART OCCUPANCY SENSORS IN LIGHTING APPLICATIONS MARKET SIZE, BY COUNTRY, 2023 VS 2024 VS 2030 (USD MILLION)
- FIGURE 15. UNITED STATES SMART OCCUPANCY SENSORS IN LIGHTING APPLICATIONS MARKET SIZE, BY STATE, 2023 VS 2030 (%)
- FIGURE 16. UNITED STATES SMART OCCUPANCY SENSORS IN LIGHTING APPLICATIONS MARKET SIZE, BY STATE, 2023 VS 2024 VS 2030 (USD MILLION)
- FIGURE 17. ASIA-PACIFIC SMART OCCUPANCY SENSORS IN LIGHTING APPLICATIONS MARKET SIZE, BY COUNTRY, 2023 VS 2030 (%)
- FIGURE 18. ASIA-PACIFIC SMART OCCUPANCY SENSORS IN LIGHTING APPLICATIONS MARKET SIZE, BY COUNTRY, 2023 VS 2024 VS 2030 (USD MILLION)
- FIGURE 19. EUROPE, MIDDLE EAST & AFRICA SMART OCCUPANCY SENSORS IN LIGHTING APPLICATIONS MARKET SIZE, BY COUNTRY, 2023 VS 2030 (%)
- FIGURE 20. EUROPE, MIDDLE EAST & AFRICA SMART OCCUPANCY SENSORS IN LIGHTING APPLICATIONS MARKET SIZE, BY COUNTRY, 2023 VS 2024 VS 2030 (USD MILLION)
- FIGURE 21. SMART OCCUPANCY SENSORS IN LIGHTING APPLICATIONS MARKET, FPNV POSITIONING MATRIX, 2023
- FIGURE 22. SMART OCCUPANCY SENSORS IN LIGHTING APPLICATIONS MARKET SHARE, BY KEY PLAYER, 2023
LIST OF TABLES
- TABLE 1. SMART OCCUPANCY SENSORS IN LIGHTING APPLICATIONS MARKET SEGMENTATION & COVERAGE
- TABLE 2. UNITED STATES DOLLAR EXCHANGE RATE, 2018-2023
- TABLE 3. SMART OCCUPANCY SENSORS IN LIGHTING APPLICATIONS MARKET SIZE, 2018-2030 (USD MILLION)
- TABLE 4. GLOBAL SMART OCCUPANCY SENSORS IN LIGHTING APPLICATIONS MARKET SIZE, BY REGION, 2018-2030 (USD MILLION)
- TABLE 5. SMART OCCUPANCY SENSORS IN LIGHTING APPLICATIONS MARKET SIZE, BY SENSOR TYPE, 2018-2030 (USD MILLION)
- TABLE 6. SMART OCCUPANCY SENSORS IN LIGHTING APPLICATIONS MARKET SIZE, BY DUAL-TECHNOLOGY SENSORS, BY REGION, 2018-2030 (USD MILLION)
- TABLE 7. SMART OCCUPANCY SENSORS IN LIGHTING APPLICATIONS MARKET SIZE, BY MICROWAVE SENSORS, BY REGION, 2018-2030 (USD MILLION)
- TABLE 8. SMART OCCUPANCY SENSORS IN LIGHTING APPLICATIONS MARKET SIZE, BY PASSIVE INFRARED (PIR) SENSORS, BY REGION, 2018-2030 (USD MILLION)
- TABLE 9. SMART OCCUPANCY SENSORS IN LIGHTING APPLICATIONS MARKET SIZE, BY ULTRASONIC SENSORS, BY REGION, 2018-2030 (USD MILLION)
- TABLE 10. SMART OCCUPANCY SENSORS IN LIGHTING APPLICATIONS MARKET SIZE, BY OPERATION, 2018-2030 (USD MILLION)
- TABLE 11. SMART OCCUPANCY SENSORS IN LIGHTING APPLICATIONS MARKET SIZE, BY INDOOR OPERATION, BY REGION, 2018-2030 (USD MILLION)
- TABLE 12. SMART OCCUPANCY SENSORS IN LIGHTING APPLICATIONS MARKET SIZE, BY OUTDOOR OPERATION, BY REGION, 2018-2030 (USD MILLION)
- TABLE 13. SMART OCCUPANCY SENSORS IN LIGHTING APPLICATIONS MARKET SIZE, BY APPLICATION, 2018-2030 (USD MILLION)
- TABLE 14. SMART OCCUPANCY SENSORS IN LIGHTING APPLICATIONS MARKET SIZE, BY AUTOMOTIVE LIGHTINGS, BY REGION, 2018-2030 (USD MILLION)
- TABLE 15. SMART OCCUPANCY SENSORS IN LIGHTING APPLICATIONS MARKET SIZE, BY BUILDING LIGHTINGS, BY REGION, 2018-2030 (USD MILLION)
- TABLE 16. AMERICAS SMART OCCUPANCY SENSORS IN LIGHTING APPLICATIONS MARKET SIZE, BY SENSOR TYPE, 2018-2030 (USD MILLION)
- TABLE 17. AMERICAS SMART OCCUPANCY SENSORS IN LIGHTING APPLICATIONS MARKET SIZE, BY OPERATION, 2018-2030 (USD MILLION)
- TABLE 18. AMERICAS SMART OCCUPANCY SENSORS IN LIGHTING APPLICATIONS MARKET SIZE, BY APPLICATION, 2018-2030 (USD MILLION)
- TABLE 19. AMERICAS SMART OCCUPANCY SENSORS IN LIGHTING APPLICATIONS MARKET SIZE, BY COUNTRY, 2018-2030 (USD MILLION)
- TABLE 20. ARGENTINA SMART OCCUPANCY SENSORS IN LIGHTING APPLICATIONS MARKET SIZE, BY SENSOR TYPE, 2018-2030 (USD MILLION)
- TABLE 21. ARGENTINA SMART OCCUPANCY SENSORS IN LIGHTING APPLICATIONS MARKET SIZE, BY OPERATION, 2018-2030 (USD MILLION)
- TABLE 22. ARGENTINA SMART OCCUPANCY SENSORS IN LIGHTING APPLICATIONS MARKET SIZE, BY APPLICATION, 2018-2030 (USD MILLION)
- TABLE 23. BRAZIL SMART OCCUPANCY SENSORS IN LIGHTING APPLICATIONS MARKET SIZE, BY SENSOR TYPE, 2018-2030 (USD MILLION)
- TABLE 24. BRAZIL SMART OCCUPANCY SENSORS IN LIGHTING APPLICATIONS MARKET SIZE, BY OPERATION, 2018-2030 (USD MILLION)
- TABLE 25. BRAZIL SMART OCCUPANCY SENSORS IN LIGHTING APPLICATIONS MARKET SIZE, BY APPLICATION, 2018-2030 (USD MILLION)
- TABLE 26. CANADA SMART OCCUPANCY SENSORS IN LIGHTING APPLICATIONS MARKET SIZE, BY SENSOR TYPE, 2018-2030 (USD MILLION)
- TABLE 27. CANADA SMART OCCUPANCY SENSORS IN LIGHTING APPLICATIONS MARKET SIZE, BY OPERATION, 2018-2030 (USD MILLION)
- TABLE 28. CANADA SMART OCCUPANCY SENSORS IN LIGHTING APPLICATIONS MARKET SIZE, BY APPLICATION, 2018-2030 (USD MILLION)
- TABLE 29. MEXICO SMART OCCUPANCY SENSORS IN LIGHTING APPLICATIONS MARKET SIZE, BY SENSOR TYPE, 2018-2030 (USD MILLION)
- TABLE 30. MEXICO SMART OCCUPANCY SENSORS IN LIGHTING APPLICATIONS MARKET SIZE, BY OPERATION, 2018-2030 (USD MILLION)
- TABLE 31. MEXICO SMART OCCUPANCY SENSORS IN LIGHTING APPLICATIONS MARKET SIZE, BY APPLICATION, 2018-2030 (USD MILLION)
- TABLE 32. UNITED STATES SMART OCCUPANCY SENSORS IN LIGHTING APPLICATIONS MARKET SIZE, BY SENSOR TYPE, 2018-2030 (USD MILLION)
- TABLE 33. UNITED STATES SMART OCCUPANCY SENSORS IN LIGHTING APPLICATIONS MARKET SIZE, BY OPERATION, 2018-2030 (USD MILLION)
- TABLE 34. UNITED STATES SMART OCCUPANCY SENSORS IN LIGHTING APPLICATIONS MARKET SIZE, BY APPLICATION, 2018-2030 (USD MILLION)
- TABLE 35. UNITED STATES SMART OCCUPANCY SENSORS IN LIGHTING APPLICATIONS MARKET SIZE, BY STATE, 2018-2030 (USD MILLION)
- TABLE 36. ASIA-PACIFIC SMART OCCUPANCY SENSORS IN LIGHTING APPLICATIONS MARKET SIZE, BY SENSOR TYPE, 2018-2030 (USD MILLION)
- TABLE 37. ASIA-PACIFIC SMART OCCUPANCY SENSORS IN LIGHTING APPLICATIONS MARKET SIZE, BY OPERATION, 2018-2030 (USD MILLION)
- TABLE 38. ASIA-PACIFIC SMART OCCUPANCY SENSORS IN LIGHTING APPLICATIONS MARKET SIZE, BY APPLICATION, 2018-2030 (USD MILLION)
- TABLE 39. ASIA-PACIFIC SMART OCCUPANCY SENSORS IN LIGHTING APPLICATIONS MARKET SIZE, BY COUNTRY, 2018-2030 (USD MILLION)
- TABLE 40. AUSTRALIA SMART OCCUPANCY SENSORS IN LIGHTING APPLICATIONS MARKET SIZE, BY SENSOR TYPE, 2018-2030 (USD MILLION)
- TABLE 41. AUSTRALIA SMART OCCUPANCY SENSORS IN LIGHTING APPLICATIONS MARKET SIZE, BY OPERATION, 2018-2030 (USD MILLION)
- TABLE 42. AUSTRALIA SMART OCCUPANCY SENSORS IN LIGHTING APPLICATIONS MARKET SIZE, BY APPLICATION, 2018-2030 (USD MILLION)
- TABLE 43. CHINA SMART OCCUPANCY SENSORS IN LIGHTING APPLICATIONS MARKET SIZE, BY SENSOR TYPE, 2018-2030 (USD MILLION)
- TABLE 44. CHINA SMART OCCUPANCY SENSORS IN LIGHTING APPLICATIONS MARKET SIZE, BY OPERATION, 2018-2030 (USD MILLION)
- TABLE 45. CHINA SMART OCCUPANCY SENSORS IN LIGHTING APPLICATIONS MARKET SIZE, BY APPLICATION, 2018-2030 (USD MILLION)
- TABLE 46. INDIA SMART OCCUPANCY SENSORS IN LIGHTING APPLICATIONS MARKET SIZE, BY SENSOR TYPE, 2018-2030 (USD MILLION)
- TABLE 47. INDIA SMART OCCUPANCY SENSORS IN LIGHTING APPLICATIONS MARKET SIZE, BY OPERATION, 2018-2030 (USD MILLION)
- TABLE 48. INDIA SMART OCCUPANCY SENSORS IN LIGHTING APPLICATIONS MARKET SIZE, BY APPLICATION, 2018-2030 (USD MILLION)
- TABLE 49. INDONESIA SMART OCCUPANCY SENSORS IN LIGHTING APPLICATIONS MARKET SIZE, BY SENSOR TYPE, 2018-2030 (USD MILLION)
- TABLE 50. INDONESIA SMART OCCUPANCY SENSORS IN LIGHTING APPLICATIONS MARKET SIZE, BY OPERATION, 2018-2030 (USD MILLION)
- TABLE 51. INDONESIA SMART OCCUPANCY SENSORS IN LIGHTING APPLICATIONS MARKET SIZE, BY APPLICATION, 2018-2030 (USD MILLION)
- TABLE 52. JAPAN SMART OCCUPANCY SENSORS IN LIGHTING APPLICATIONS MARKET SIZE, BY SENSOR TYPE, 2018-2030 (USD MILLION)
- TABLE 53. JAPAN SMART OCCUPANCY SENSORS IN LIGHTING APPLICATIONS MARKET SIZE, BY OPERATION, 2018-2030 (USD MILLION)
- TABLE 54. JAPAN SMART OCCUPANCY SENSORS IN LIGHTING APPLICATIONS MARKET SIZE, BY APPLICATION, 2018-2030 (USD MILLION)
- TABLE 55. MALAYSIA SMART OCCUPANCY SENSORS IN LIGHTING APPLICATIONS MARKET SIZE, BY SENSOR TYPE, 2018-2030 (USD MILLION)
- TABLE 56. MALAYSIA SMART OCCUPANCY SENSORS IN LIGHTING APPLICATIONS MARKET SIZE, BY OPERATION, 2018-2030 (USD MILLION)
- TABLE 57. MALAYSIA SMART OCCUPANCY SENSORS IN LIGHTING APPLICATIONS MARKET SIZE, BY APPLICATION, 2018-2030 (USD MILLION)
- TABLE 58. PHILIPPINES SMART OCCUPANCY SENSORS IN LIGHTING APPLICATIONS MARKET SIZE, BY SENSOR TYPE, 2018-2030 (USD MILLION)
- TABLE 59. PHILIPPINES SMART OCCUPANCY SENSORS IN LIGHTING APPLICATIONS MARKET SIZE, BY OPERATION, 2018-2030 (USD MILLION)
- TABLE 60. PHILIPPINES SMART OCCUPANCY SENSORS IN LIGHTING APPLICATIONS MARKET SIZE, BY APPLICATION, 2018-2030 (USD MILLION)
- TABLE 61. SINGAPORE SMART OCCUPANCY SENSORS IN LIGHTING APPLICATIONS MARKET SIZE, BY SENSOR TYPE, 2018-2030 (USD MILLION)
- TABLE 62. SINGAPORE SMART OCCUPANCY SENSORS IN LIGHTING APPLICATIONS MARKET SIZE, BY OPERATION, 2018-2030 (USD MILLION)
- TABLE 63. SINGAPORE SMART OCCUPANCY SENSORS IN LIGHTING APPLICATIONS MARKET SIZE, BY APPLICATION, 2018-2030 (USD MILLION)
- TABLE 64. SOUTH KOREA SMART OCCUPANCY SENSORS IN LIGHTING APPLICATIONS MARKET SIZE, BY SENSOR TYPE, 2018-2030 (USD MILLION)
- TABLE 65. SOUTH KOREA SMART OCCUPANCY SENSORS IN LIGHTING APPLICATIONS MARKET SIZE, BY OPERATION, 2018-2030 (USD MILLION)
- TABLE 66. SOUTH KOREA SMART OCCUPANCY SENSORS IN LIGHTING APPLICATIONS MARKET SIZE, BY APPLICATION, 2018-2030 (USD MILLION)
- TABLE 67. TAIWAN SMART OCCUPANCY SENSORS IN LIGHTING APPLICATIONS MARKET SIZE, BY SENSOR TYPE, 2018-2030 (USD MILLION)
- TABLE 68. TAIWAN SMART OCCUPANCY SENSORS IN LIGHTING APPLICATIONS MARKET SIZE, BY OPERATION, 2018-2030 (USD MILLION)
- TABLE 69. TAIWAN SMART OCCUPANCY SENSORS IN LIGHTING APPLICATIONS MARKET SIZE, BY APPLICATION, 2018-2030 (USD MILLION)
- TABLE 70. THAILAND SMART OCCUPANCY SENSORS IN LIGHTING APPLICATIONS MARKET SIZE, BY SENSOR TYPE, 2018-2030 (USD MILLION)
- TABLE 71. THAILAND SMART OCCUPANCY SENSORS IN LIGHTING APPLICATIONS MARKET SIZE, BY OPERATION, 2018-2030 (USD MILLION)
- TABLE 72. THAILAND SMART OCCUPANCY SENSORS IN LIGHTING APPLICATIONS MARKET SIZE, BY APPLICATION, 2018-2030 (USD MILLION)
- TABLE 73. VIETNAM SMART OCCUPANCY SENSORS IN LIGHTING APPLICATIONS MARKET SIZE, BY SENSOR TYPE, 2018-2030 (USD MILLION)
- TABLE 74. VIETNAM SMART OCCUPANCY SENSORS IN LIGHTING APPLICATIONS MARKET SIZE, BY OPERATION, 2018-2030 (USD MILLION)
- TABLE 75. VIETNAM SMART OCCUPANCY SENSORS IN LIGHTING APPLICATIONS MARKET SIZE, BY APPLICATION, 2018-2030 (USD MILLION)
- TABLE 76. EUROPE, MIDDLE EAST & AFRICA SMART OCCUPANCY SENSORS IN LIGHTING APPLICATIONS MARKET SIZE, BY SENSOR TYPE, 2018-2030 (USD MILLION)
- TABLE 77. EUROPE, MIDDLE EAST & AFRICA SMART OCCUPANCY SENSORS IN LIGHTING APPLICATIONS MARKET SIZE, BY OPERATION, 2018-2030 (USD MILLION)
- TABLE 78. EUROPE, MIDDLE EAST & AFRICA SMART OCCUPANCY SENSORS IN LIGHTING APPLICATIONS MARKET SIZE, BY APPLICATION, 2018-2030 (USD MILLION)
- TABLE 79. EUROPE, MIDDLE EAST & AFRICA SMART OCCUPANCY SENSORS IN LIGHTING APPLICATIONS MARKET SIZE, BY COUNTRY, 2018-2030 (USD MILLION)
- TABLE 80. DENMARK SMART OCCUPANCY SENSORS IN LIGHTING APPLICATIONS MARKET SIZE, BY SENSOR TYPE, 2018-2030 (USD MILLION)
- TABLE 81. DENMARK SMART OCCUPANCY SENSORS IN LIGHTING APPLICATIONS MARKET SIZE, BY OPERATION, 2018-2030 (USD MILLION)
- TABLE 82. DENMARK SMART OCCUPANCY SENSORS IN LIGHTING APPLICATIONS MARKET SIZE, BY APPLICATION, 2018-2030 (USD MILLION)
- TABLE 83. EGYPT SMART OCCUPANCY SENSORS IN LIGHTING APPLICATIONS MARKET SIZE, BY SENSOR TYPE, 2018-2030 (USD MILLION)
- TABLE 84. EGYPT SMART OCCUPANCY SENSORS IN LIGHTING APPLICATIONS MARKET SIZE, BY OPERATION, 2018-2030 (USD MILLION)
- TABLE 85. EGYPT SMART OCCUPANCY SENSORS IN LIGHTING APPLICATIONS MARKET SIZE, BY APPLICATION, 2018-2030 (USD MILLION)
- TABLE 86. FINLAND SMART OCCUPANCY SENSORS IN LIGHTING APPLICATIONS MARKET SIZE, BY SENSOR TYPE, 2018-2030 (USD MILLION)
- TABLE 87. FINLAND SMART OCCUPANCY SENSORS IN LIGHTING APPLICATIONS MARKET SIZE, BY OPERATION, 2018-2030 (USD MILLION)
- TABLE 88. FINLAND SMART OCCUPANCY SENSORS IN LIGHTING APPLICATIONS MARKET SIZE, BY APPLICATION, 2018-2030 (USD MILLION)
- TABLE 89. FRANCE SMART OCCUPANCY SENSORS IN LIGHTING APPLICATIONS MARKET SIZE, BY SENSOR TYPE, 2018-2030 (USD MILLION)
- TABLE 90. FRANCE SMART OCCUPANCY SENSORS IN LIGHTING APPLICATIONS MARKET SIZE, BY OPERATION, 2018-2030 (USD MILLION)
- TABLE 91. FRANCE SMART OCCUPANCY SENSORS IN LIGHTING APPLICATIONS MARKET SIZE, BY APPLICATION, 2018-2030 (USD MILLION)
- TABLE 92. GERMANY SMART OCCUPANCY SENSORS IN LIGHTING APPLICATIONS MARKET SIZE, BY SENSOR TYPE, 2018-2030 (USD MILLION)
- TABLE 93. GERMANY SMART OCCUPANCY SENSORS IN LIGHTING APPLICATIONS MARKET SIZE, BY OPERATION, 2018-2030 (USD MILLION)
- TABLE 94. GERMANY SMART OCCUPANCY SENSORS IN LIGHTING APPLICATIONS MARKET SIZE, BY APPLICATION, 2018-2030 (USD MILLION)
- TABLE 95. ISRAEL SMART OCCUPANCY SENSORS IN LIGHTING APPLICATIONS MARKET SIZE, BY SENSOR TYPE, 2018-2030 (USD MILLION)
- TABLE 96. ISRAEL SMART OCCUPANCY SENSORS IN LIGHTING APPLICATIONS MARKET SIZE, BY OPERATION, 2018-2030 (USD MILLION)
- TABLE 97. ISRAEL SMART OCCUPANCY SENSORS IN LIGHTING APPLICATIONS MARKET SIZE, BY APPLICATION, 2018-2030 (USD MILLION)
- TABLE 98. ITALY SMART OCCUPANCY SENSORS IN LIGHTING APPLICATIONS MARKET SIZE, BY SENSOR TYPE, 2018-2030 (USD MILLION)
- TABLE 99. ITALY SMART OCCUPANCY SENSORS IN LIGHTING APPLICATIONS MARKET SIZE, BY OPERATION, 2018-2030 (USD MILLION)
- TABLE 100. ITALY SMART OCCUPANCY SENSORS IN LIGHTING APPLICATIONS MARKET SIZE, BY APPLICATION, 2018-2030 (USD MILLION)
- TABLE 101. NETHERLANDS SMART OCCUPANCY SENSORS IN LIGHTING APPLICATIONS MARKET SIZE, BY SENSOR TYPE, 2018-2030 (USD MILLION)
- TABLE 102. NETHERLANDS SMART OCCUPANCY SENSORS IN LIGHTING APPLICATIONS MARKET SIZE, BY OPERATION, 2018-2030 (USD MILLION)
- TABLE 103. NETHERLANDS SMART OCCUPANCY SENSORS IN LIGHTING APPLICATIONS MARKET SIZE, BY APPLICATION, 2018-2030 (USD MILLION)
- TABLE 104. NIGERIA SMART OCCUPANCY SENSORS IN LIGHTING APPLICATIONS MARKET SIZE, BY SENSOR TYPE, 2018-2030 (USD MILLION)
- TABLE 105. NIGERIA SMART OCCUPANCY SENSORS IN LIGHTING APPLICATIONS MARKET SIZE, BY OPERATION, 2018-2030 (USD MILLION)
- TABLE 106. NIGERIA SMART OCCUPANCY SENSORS IN LIGHTING APPLICATIONS MARKET SIZE, BY APPLICATION, 2018-2030 (USD MILLION)
- TABLE 107. NORWAY SMART OCCUPANCY SENSORS IN LIGHTING APPLICATIONS MARKET SIZE, BY SENSOR TYPE, 2018-2030 (USD MILLION)
- TABLE 108. NORWAY SMART OCCUPANCY SENSORS IN LIGHTING APPLICATIONS MARKET SIZE, BY OPERATION, 2018-2030 (USD MILLION)
- TABLE 109. NORWAY SMART OCCUPANCY SENSORS IN LIGHTING APPLICATIONS MARKET SIZE, BY APPLICATION, 2018-2030 (USD MILLION)
- TABLE 110. POLAND SMART OCCUPANCY SENSORS IN LIGHTING APPLICATIONS MARKET SIZE, BY SENSOR TYPE, 2018-2030 (USD MILLION)
- TABLE 111. POLAND SMART OCCUPANCY SENSORS IN LIGHTING APPLICATIONS MARKET SIZE, BY OPERATION, 2018-2030 (USD MILLION)
- TABLE 112. POLAND SMART OCCUPANCY SENSORS IN LIGHTING APPLICATIONS MARKET SIZE, BY APPLICATION, 2018-2030 (USD MILLION)
- TABLE 113. QATAR SMART OCCUPANCY SENSORS IN LIGHTING APPLICATIONS MARKET SIZE, BY SENSOR TYPE, 2018-2030 (USD MILLION)
- TABLE 114. QATAR SMART OCCUPANCY SENSORS IN LIGHTING APPLICATIONS MARKET SIZE, BY OPERATION, 2018-2030 (USD MILLION)
- TABLE 115. QATAR SMART OCCUPANCY SENSORS IN LIGHTING APPLICATIONS MARKET SIZE, BY APPLICATION, 2018-2030 (USD MILLION)
- TABLE 116. RUSSIA SMART OCCUPANCY SENSORS IN LIGHTING APPLICATIONS MARKET SIZE, BY SENSOR TYPE, 2018-2030 (USD MILLION)
- TABLE 117. RUSSIA SMART OCCUPANCY SENSORS IN LIGHTING APPLICATIONS MARKET SIZE, BY OPERATION, 2018-2030 (USD MILLION)
- TABLE 118. RUSSIA SMART OCCUPANCY SENSORS IN LIGHTING APPLICATIONS MARKET SIZE, BY APPLICATION, 2018-2030 (USD MILLION)
- TABLE 119. SAUDI ARABIA SMART OCCUPANCY SENSORS IN LIGHTING APPLICATIONS MARKET SIZE, BY SENSOR TYPE, 2018-2030 (USD MILLION)
- TABLE 120. SAUDI ARABIA SMART OCCUPANCY SENSORS IN LIGHTING APPLICATIONS MARKET SIZE, BY OPERATION, 2018-2030 (USD MILLION)
- TABLE 121. SAUDI ARABIA SMART OCCUPANCY SENSORS IN LIGHTING APPLICATIONS MARKET SIZE, BY APPLICATION, 2018-2030 (USD MILLION)
- TABLE 122. SOUTH AFRICA SMART OCCUPANCY SENSORS IN LIGHTING APPLICATIONS MARKET SIZE, BY SENSOR TYPE, 2018-2030 (USD MILLION)
- TABLE 123. SOUTH AFRICA SMART OCCUPANCY SENSORS IN LIGHTING APPLICATIONS MARKET SIZE, BY OPERATION, 2018-2030 (USD MILLION)
- TABLE 124. SOUTH AFRICA SMART OCCUPANCY SENSORS IN LIGHTING APPLICATIONS MARKET SIZE, BY APPLICATION, 2018-2030 (USD MILLION)
- TABLE 125. SPAIN SMART OCCUPANCY SENSORS IN LIGHTING APPLICATIONS MARKET SIZE, BY SENSOR TYPE, 2018-2030 (USD MILLION)
- TABLE 126. SPAIN SMART OCCUPANCY SENSORS IN LIGHTING APPLICATIONS MARKET SIZE, BY OPERATION, 2018-2030 (USD MILLION)
- TABLE 127. SPAIN SMART OCCUPANCY SENSORS IN LIGHTING APPLICATIONS MARKET SIZE, BY APPLICATION, 2018-2030 (USD MILLION)
- TABLE 128. SWEDEN SMART OCCUPANCY SENSORS IN LIGHTING APPLICATIONS MARKET SIZE, BY SENSOR TYPE, 2018-2030 (USD MILLION)
- TABLE 129. SWEDEN SMART OCCUPANCY SENSORS IN LIGHTING APPLICATIONS MARKET SIZE, BY OPERATION, 2018-2030 (USD MILLION)
- TABLE 130. SWEDEN SMART OCCUPANCY SENSORS IN LIGHTING APPLICATIONS MARKET SIZE, BY APPLICATION, 2018-2030 (USD MILLION)
- TABLE 131. SWITZERLAND SMART OCCUPANCY SENSORS IN LIGHTING APPLICATIONS MARKET SIZE, BY SENSOR TYPE, 2018-2030 (USD MILLION)
- TABLE 132. SWITZERLAND SMART OCCUPANCY SENSORS IN LIGHTING APPLICATIONS MARKET SIZE, BY OPERATION, 2018-2030 (USD MILLION)
- TABLE 133. SWITZERLAND SMART OCCUPANCY SENSORS IN LIGHTING APPLICATIONS MARKET SIZE, BY APPLICATION, 2018-2030 (USD MILLION)
- TABLE 134. TURKEY SMART OCCUPANCY SENSORS IN LIGHTING APPLICATIONS MARKET SIZE, BY SENSOR TYPE, 2018-2030 (USD MILLION)
- TABLE 135. TURKEY SMART OCCUPANCY SENSORS IN LIGHTING APPLICATIONS MARKET SIZE, BY OPERATION, 2018-2030 (USD MILLION)
- TABLE 136. TURKEY SMART OCCUPANCY SENSORS IN LIGHTING APPLICATIONS MARKET SIZE, BY APPLICATION, 2018-2030 (USD MILLION)
- TABLE 137. UNITED ARAB EMIRATES SMART OCCUPANCY SENSORS IN LIGHTING APPLICATIONS MARKET SIZE, BY SENSOR TYPE, 2018-2030 (USD MILLION)
- TABLE 138. UNITED ARAB EMIRATES SMART OCCUPANCY SENSORS IN LIGHTING APPLICATIONS MARKET SIZE, BY OPERATION, 2018-2030 (USD MILLION)
- TABLE 139. UNITED ARAB EMIRATES SMART OCCUPANCY SENSORS IN LIGHTING APPLICATIONS MARKET SIZE, BY APPLICATION, 2018-2030 (USD MILLION)
- TABLE 140. UNITED KINGDOM SMART OCCUPANCY SENSORS IN LIGHTING APPLICATIONS MARKET SIZE, BY SENSOR TYPE, 2018-2030 (USD MILLION)
- TABLE 141. UNITED KINGDOM SMART OCCUPANCY SENSORS IN LIGHTING APPLICATIONS MARKET SIZE, BY OPERATION, 2018-2030 (USD MILLION)
- TABLE 142. UNITED KINGDOM SMART OCCUPANCY SENSORS IN LIGHTING APPLICATIONS MARKET SIZE, BY APPLICATION, 2018-2030 (USD MILLION)
- TABLE 143. SMART OCCUPANCY SENSORS IN LIGHTING APPLICATIONS MARKET, FPNV POSITIONING MATRIX, 2023
- TABLE 144. SMART OCCUPANCY SENSORS IN LIGHTING APPLICATIONS MARKET SHARE, BY KEY PLAYER, 2023
- TABLE 145. SMART OCCUPANCY SENSORS IN LIGHTING APPLICATIONS MARKET LICENSE & PRICING
 佔用檢測:佔用檢測系統在減少商業建築能源使用同時保持舒適度和生產力方面的不斷發展的作用
 2024-2032 年按網路類型、技術、建築類型、涵蓋範圍積、應用和區域分類的佔用感測器市場報告
 佔用感測器市場 - 按技術(被動紅外線、超音波、雙技術、微波)、按操作(室內操作、室外操作)、按涵蓋範圍積、按建築類型、按網路連接、按應用和預測,2024 年至 2032 年
 有線佔用測器的全球市場
 全球佔用感測器市場:按營運、涵蓋範圍積、建築類型、連接性別、技術、用途- 預測 2023-2030
 到 2028 年的有線佔用傳感器市場預測——按建築類型(商業建築、住宅)、應用(安全監控、照明控制、暖通空調)、最終用戶和地區進行的全球分析
 到 2028 年的無線佔用傳感器市場預測——按建築類型、類型(雙技術、被動紅外、超聲波、其他類型)、應用、最終用戶和地區進行的全球分析
 在場感測器的全球市場
 佔有感測器的全球市場 (2023-2028年):趨勢、成長機會、競爭分析
 佔用傳感器市場 - COVID-19 的增長、趨勢、影響和預測(2022-2027 年)