


 |
市場調查報告書
商品編碼
1413912
數位功率計市場:按階段和應用分列 - 2024 年至 2030 年全球預測Digital Power Meters Market by Phase (Single Phase, Three Phase), Application (Commercial, Industrial, Residential) - Global Forecast 2024-2030 |
||||||
※ 本網頁內容可能與最新版本有所差異。詳細情況請與我們聯繫。
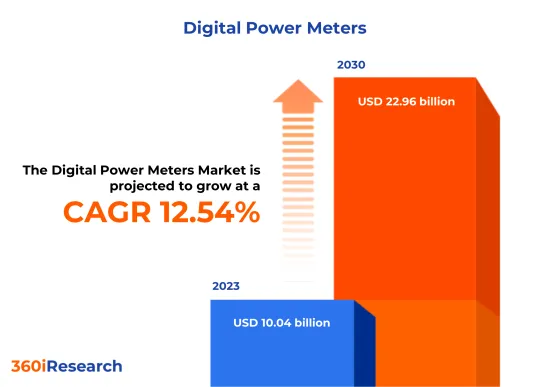
預計2023年數位電錶市場規模為100.4億美元,2024年達112.6億美元,2030年預計將達229.6億美元,複合年成長率為12.54%。
全球數位功率計市場
| 主要市場統計 | |
|---|---|
| 基準年[2023] | 100.4億美元 |
| 預測年份 [2024] | 112.6億美元 |
| 預測年份 [2030] | 229.6億美元 |
| 複合年成長率(%) | 12.54% |
數位功率計是一種先進的測量設備,可記錄住宅、企業或電動設備消耗的電力。與先前的類比儀表不同,這些儀表採用數位技術來收集、處理和顯示資料。它以其高精度、高可靠性以及能夠提供有關一段時間內的電力使用情況的詳細資訊聞名。這些儀表通常具有數位顯示器,並且可以結合先進的功能,例如使用時間收費、資料通訊和遠端讀取功能。您可以監控各種電氣參數,例如電壓、電流、功率因數和千瓦時 (kWh)消費量。節能意識的增強和智慧家庭的興起,以及政府在能源管理和智慧電網技術方面的舉措,正在推動數位電錶的採用。然而,資料安全問題和數位儀表的複雜功能以及較高的初始成本可能會阻礙市場成長。然而,先進能源管理軟體的開發和先進電池儲存整合的研究預計將為市場成長創造機會。
區域洞察
由於能源效率和電網現代化的共同努力,美洲對數位電錶表現出強勁的需求。這些國家由於擁有大量智慧家庭且正向智慧電網轉型,已成為數位電錶技術的重要消費者。這些地區的客戶傾向於提供即時監控和能源管理的整合解決方案。美國智慧電網投資津貼(SGIG) 和加拿大智慧電網計畫等舉措凸顯了該地區對加強電網基礎設施和推動對先進儀器儀表需求的重視。歐洲、中東和非洲地區的數位功率計呈現出多元化的市場形勢。歐盟 (EU) 對數位化和永續能源的推動正在極大地加速創新測量解決方案的採用。由於節能和高效資源管理的需求,歐盟國家正積極採用創新的電網技術。客戶喜歡符合嚴格監管標準並提供資料安全的產品。基礎設施和智慧城市計劃的成長導致中東地區對先進儀器基礎設施 (AMI) 的接受度不斷提高。由於電力監控和減少盜竊的需要,非洲的意識和採用率正在提高。一些非洲國家現在正在利用行動技術整合到預付式數位電錶解決方案中。亞太地區數位電錶市場是由需要高效電源管理系統的大型基礎設施計劃所推動的。此外,該地區國家注重節能和技術先進的基礎設施,客戶偏好偏向高精度和耐用的功率計,這也對市場需求做出了重大貢獻。
FPNV定位矩陣
FPNV定位矩陣對於評估數位功率計市場至關重要。我們檢視與業務策略和產品滿意度相關的關鍵指標,以對供應商進行全面評估。這種深入的分析使用戶能夠根據自己的要求做出明智的決策。根據評估,供應商被分為四個成功程度不同的像限。最前線 (F)、探路者 (P)、利基 (N) 和重要 (V)。
市場佔有率分析
市場佔有率分析是一種綜合工具,可以對數位功率計市場供應商的現狀進行深入而詳細的研究。全面比較和分析供應商在整體收益、基本客群和其他關鍵指標方面的貢獻,以便更好地了解公司的績效及其在爭奪市場佔有率時面臨的挑戰。此外,該分析還提供了對該行業競爭特徵的寶貴考察,包括在研究基準年觀察到的累積、分散主導地位和合併特徵等因素。詳細程度的提高使供應商能夠做出更明智的決策並制定有效的策略,從而在市場上獲得競爭優勢。
該報告對以下幾個方面提供了寶貴的見解:
1-市場滲透率:提供有關主要企業所服務的市場的全面資訊。
2-市場開拓:我們深入研究利潤豐厚的新興市場,並分析它們在成熟細分市場中的滲透率。
3- 市場多元化:提供有關新產品發布、開拓地區、最新發展和投資的詳細資訊。
4-競爭力評估與資訊:對主要企業的市場佔有率、策略、產品、認證、監管狀況、專利狀況、製造能力等進行全面評估。
5- 產品開發與創新:提供對未來技術、研發活動和突破性產品開發的見解。
本報告解決了以下關鍵問題:
1-數位電錶市場的市場規模和預測是多少?
2-在數位功率計市場的預測期間內,有哪些產品、細分市場、應用和領域需要考慮投資?
3-數位電錶市場的技術趨勢和法律規範是什麼?
4-數位功率計市場主要供應商的市場佔有率是多少?
5-進入數位電錶市場合適的型態和策略手段是什麼?
目錄
第1章 前言
第2章調查方法
第3章執行摘要
第4章市場概況
第5章市場洞察
- 市場動態
- 促進因素
- 由於節能意識的提高,智慧家庭的增加
- 政府能源管理和智慧電網技術舉措
- 對遠端監控和控制能源使用的需求不斷增加
- 抑制因素
- 數位電能計量基礎設施的初始投資較高
- 機會
- 透過物聯網和資料分析的創新擴展數位功率計的功能
- 透過探索先進的電池整合開發先進的能源管理軟體
- 任務
- 對資料安全和數位儀表複雜功能的擔憂
- 促進因素
- 市場區隔分析
- 相位:三相電錶在工業環境中至關重要,因為它們可以處理高負載並保持電能品質
- 應用:推動數位功率計在商業領域的使用
- 市場趨勢分析
- 高通膨的累積效應
- 波特五力分析
- 價值鍊和關鍵路徑分析
- 法律規範
第6章數位功率計市場:愛別
- 介紹
- 單相
- 三相
第7章數位功率計市場:依應用分類
- 介紹
- 商業的
- 工業的
- 住宅
第8章美洲數位功率計市場
- 介紹
- 阿根廷
- 巴西
- 加拿大
- 墨西哥
- 美國
第9章亞太數位功率計市場
- 介紹
- 澳洲
- 中國
- 印度
- 印尼
- 日本
- 馬來西亞
- 菲律賓
- 新加坡
- 韓國
- 台灣
- 泰國
- 越南
第10章歐洲、中東和非洲數位電錶市場
- 介紹
- 丹麥
- 埃及
- 芬蘭
- 法國
- 德國
- 以色列
- 義大利
- 荷蘭
- 奈及利亞
- 挪威
- 波蘭
- 卡達
- 俄羅斯
- 沙烏地阿拉伯
- 南非
- 西班牙
- 瑞典
- 瑞士
- 土耳其
- 阿拉伯聯合大公國
- 英國
第11章競爭形勢
- FPNV定位矩陣
- 市場佔有率分析:主要企業
- 主要企業競爭情境分析
- 併購
- 新產品發布和功能增強
- 獎項/獎勵/擴展
第12章競爭產品組合
- 主要公司簡介
- ABB Ltd.
- Advanced Electronics Company
- Carrel Electrade Limited
- Circutor SA
- EASTRON ELECTRONIC CO., LTD.
- Eaton Corporation PLC
- EKM Metering Inc.
- Elster Group GmbH by Honeywell International Inc.
- General Electric company
- Holley Technology Ltd.
- HPL Electric and Power Limited
- Iskraemeco Group
- Itron, Inc.
- Jiangsu Linyang Energy Co., Ltd.
- Kamstrup A/S
- Landis+Gyr AG
- Murata Manufacturing Co., Ltd.
- Ningbo Sanxing Electric Co. Ltd.
- Osaki Electric Co. Ltd.
- Schneider Electric SE
- Sensus by Xylem Inc.
- Siemens AG
- Simpson Electric Company, Inc.
- TE Connectivity Ltd.
- Wasion International Co., Ltd.
- 主要產品系列
第13章附錄
- 討論指南
- 關於許可證和定價
[189 Pages Report] The Digital Power Meters Market size was estimated at USD 10.04 billion in 2023 and expected to reach USD 11.26 billion in 2024, at a CAGR 12.54% to reach USD 22.96 billion by 2030.
Global Digital Power Meters Market
| KEY MARKET STATISTICS | |
|---|---|
| Base Year [2023] | USD 10.04 billion |
| Estimated Year [2024] | USD 11.26 billion |
| Forecast Year [2030] | USD 22.96 billion |
| CAGR (%) | 12.54% |
Digital Power Meters are advanced measurement devices that record the amount of electric energy consumed by a residence, business establishment, or an electronically powered device. Unlike their analog predecessors, these meters employ digital technology to collect, process, and display the data. They are known for their high accuracy, reliability, and ability to provide detailed information about power usage over time. These meters typically feature a digital display and may incorporate sophisticated functions such as time-of-use billing, data communication, and remote reading capabilities. They can monitor various electrical parameters, including voltage, current, power factor, and kilowatt-hours (kWh) energy consumption. Growing number of smart homes with increasing awareness about energy conservation and government initiatives for energy management and smart grid technologies increases the adoption of digital power meters. However, concerns regarding data security and the complex functionality of digital meters with high initial costs may impede market growth. Nevertheless, developing sophisticated energy management software with research into advanced battery storage integration is anticipated to create lucrative opportunities for market growth.
Regional Insights
The Americas is showcasing a strong demand for digital power meters driven by concerted efforts for energy efficiency and grid modernization. These countries have become significant digital power meter technology consumers with many smart homes and an ongoing transition to smart grids. Customers in these territories are inclined towards integrated solutions providing real-time monitoring and energy management. Initiatives such as the U.S. Smart Grid Investment Grant (SGIG) and Canada's Smart Grid Program underline the region's focus on enhancing power grid infrastructure, propelling demand for advanced metering devices. The EMEA region presents a diverse market landscape for digital power meters. The European Union's drive for digitalization and sustainable energy has significantly spurred the adoption of innovative metering solutions. Requirements for energy saving and efficient resource management make EU countries avid adopters of innovative grid technologies. Customers prefer products that align with stringent regulatory standards and provide data security. With its growing infrastructure and smart city projects, the Middle East is becoming increasingly receptive to advanced metering infrastructure (AMI). In Africa, there is growing awareness and adoption driven by the need for electricity monitoring and theft reduction. Several African countries now leverage mobile technology integration for pre-paid digital power meter solutions. The digital power meter market in Asia Pacific is driven by massive infrastructure projects that demand highly efficient power management systems. Furthermore, countries in this region focus on energy conservation and technologically sophisticated infrastructure that contributes significantly to market demand, with customer preferences skewed towards high-precision and durable power meters.
FPNV Positioning Matrix
The FPNV Positioning Matrix is pivotal in evaluating the Digital Power Meters Market. It offers a comprehensive assessment of vendors, examining key metrics related to Business Strategy and Product Satisfaction. This in-depth analysis empowers users to make well-informed decisions aligned with their requirements. Based on the evaluation, the vendors are then categorized into four distinct quadrants representing varying levels of success: Forefront (F), Pathfinder (P), Niche (N), or Vital (V).
Market Share Analysis
The Market Share Analysis is a comprehensive tool that provides an insightful and in-depth examination of the current state of vendors in the Digital Power Meters Market. By meticulously comparing and analyzing vendor contributions in terms of overall revenue, customer base, and other key metrics, we can offer companies a greater understanding of their performance and the challenges they face when competing for market share. Additionally, this analysis provides valuable insights into the competitive nature of the sector, including factors such as accumulation, fragmentation dominance, and amalgamation traits observed over the base year period studied. With this expanded level of detail, vendors can make more informed decisions and devise effective strategies to gain a competitive edge in the market.
Key Company Profiles
The report delves into recent significant developments in the Digital Power Meters Market, highlighting leading vendors and their innovative profiles. These include ABB Ltd., Advanced Electronics Company, Carrel Electrade Limited, Circutor SA, EASTRON ELECTRONIC CO., LTD., Eaton Corporation PLC, EKM Metering Inc., Elster Group GmbH by Honeywell International Inc., General Electric company, Holley Technology Ltd., HPL Electric and Power Limited, Iskraemeco Group, Itron, Inc., Jiangsu Linyang Energy Co., Ltd., Kamstrup A/S, Landis+Gyr AG, Murata Manufacturing Co., Ltd., Ningbo Sanxing Electric Co. Ltd., Osaki Electric Co. Ltd., Schneider Electric SE, Sensus by Xylem Inc., Siemens AG, Simpson Electric Company, Inc., TE Connectivity Ltd., and Wasion International Co., Ltd..
Market Segmentation & Coverage
This research report categorizes the Digital Power Meters Market to forecast the revenues and analyze trends in each of the following sub-markets:
- Phase
- Single Phase
- Three Phase
- Application
- Commercial
- Industrial
- Residential
- Region
- Americas
- Argentina
- Brazil
- Canada
- Mexico
- United States
- California
- Florida
- Illinois
- New York
- Ohio
- Pennsylvania
- Texas
- Asia-Pacific
- Australia
- China
- India
- Indonesia
- Japan
- Malaysia
- Philippines
- Singapore
- South Korea
- Taiwan
- Thailand
- Vietnam
- Europe, Middle East & Africa
- Denmark
- Egypt
- Finland
- France
- Germany
- Israel
- Italy
- Netherlands
- Nigeria
- Norway
- Poland
- Qatar
- Russia
- Saudi Arabia
- South Africa
- Spain
- Sweden
- Switzerland
- Turkey
- United Arab Emirates
- United Kingdom
- Americas
The report offers valuable insights on the following aspects:
1. Market Penetration: It presents comprehensive information on the market provided by key players.
2. Market Development: It delves deep into lucrative emerging markets and analyzes the penetration across mature market segments.
3. Market Diversification: It provides detailed information on new product launches, untapped geographic regions, recent developments, and investments.
4. Competitive Assessment & Intelligence: It conducts an exhaustive assessment of market shares, strategies, products, certifications, regulatory approvals, patent landscape, and manufacturing capabilities of the leading players.
5. Product Development & Innovation: It offers intelligent insights on future technologies, R&D activities, and breakthrough product developments.
The report addresses key questions such as:
1. What is the market size and forecast of the Digital Power Meters Market?
2. Which products, segments, applications, and areas should one consider investing in over the forecast period in the Digital Power Meters Market?
3. What are the technology trends and regulatory frameworks in the Digital Power Meters Market?
4. What is the market share of the leading vendors in the Digital Power Meters Market?
5. Which modes and strategic moves are suitable for entering the Digital Power Meters Market?
Table of Contents
1. Preface
- 1.1. Objectives of the Study
- 1.2. Market Segmentation & Coverage
- 1.3. Years Considered for the Study
- 1.4. Currency & Pricing
- 1.5. Language
- 1.6. Limitations
- 1.7. Assumptions
- 1.8. Stakeholders
2. Research Methodology
- 2.1. Define: Research Objective
- 2.2. Determine: Research Design
- 2.3. Prepare: Research Instrument
- 2.4. Collect: Data Source
- 2.5. Analyze: Data Interpretation
- 2.6. Formulate: Data Verification
- 2.7. Publish: Research Report
- 2.8. Repeat: Report Update
3. Executive Summary
4. Market Overview
- 4.1. Introduction
- 4.2. Digital Power Meters Market, by Region
5. Market Insights
- 5.1. Market Dynamics
- 5.1.1. Drivers
- 5.1.1.1. Growing number of smart homes with increasing awareness about energy conservation
- 5.1.1.2. Government initiatives for energy management and smart grid technologies
- 5.1.1.3. Increasing need for remote monitoring and control of energy usage
- 5.1.2. Restraints
- 5.1.2.1. High initial investment in digital power meter infrastructure
- 5.1.3. Opportunities
- 5.1.3.1. Expanding capabilities of digital power meters due to innovations in IoT and data analytics
- 5.1.3.2. Development of sophisticated energy management software with research into advanced battery storage integration
- 5.1.4. Challenges
- 5.1.4.1. Concern regarding data security and complex functionality of digital meters
- 5.1.1. Drivers
- 5.2. Market Segmentation Analysis
- 5.2.1. Phase: Three-phase meters are essential in industrial settings due to their ability to handle high loads and maintain power quality
- 5.2.2. Application: Evolving usage of digital power meters in the commercial sector
- 5.3. Market Trend Analysis
- 5.4. Cumulative Impact of High Inflation
- 5.5. Porter's Five Forces Analysis
- 5.5.1. Threat of New Entrants
- 5.5.2. Threat of Substitutes
- 5.5.3. Bargaining Power of Customers
- 5.5.4. Bargaining Power of Suppliers
- 5.5.5. Industry Rivalry
- 5.6. Value Chain & Critical Path Analysis
- 5.7. Regulatory Framework
6. Digital Power Meters Market, by Phase
- 6.1. Introduction
- 6.2. Single Phase
- 6.3. Three Phase
7. Digital Power Meters Market, by Application
- 7.1. Introduction
- 7.2. Commercial
- 7.3. Industrial
- 7.4. Residential
8. Americas Digital Power Meters Market
- 8.1. Introduction
- 8.2. Argentina
- 8.3. Brazil
- 8.4. Canada
- 8.5. Mexico
- 8.6. United States
9. Asia-Pacific Digital Power Meters Market
- 9.1. Introduction
- 9.2. Australia
- 9.3. China
- 9.4. India
- 9.5. Indonesia
- 9.6. Japan
- 9.7. Malaysia
- 9.8. Philippines
- 9.9. Singapore
- 9.10. South Korea
- 9.11. Taiwan
- 9.12. Thailand
- 9.13. Vietnam
10. Europe, Middle East & Africa Digital Power Meters Market
- 10.1. Introduction
- 10.2. Denmark
- 10.3. Egypt
- 10.4. Finland
- 10.5. France
- 10.6. Germany
- 10.7. Israel
- 10.8. Italy
- 10.9. Netherlands
- 10.10. Nigeria
- 10.11. Norway
- 10.12. Poland
- 10.13. Qatar
- 10.14. Russia
- 10.15. Saudi Arabia
- 10.16. South Africa
- 10.17. Spain
- 10.18. Sweden
- 10.19. Switzerland
- 10.20. Turkey
- 10.21. United Arab Emirates
- 10.22. United Kingdom
11. Competitive Landscape
- 11.1. FPNV Positioning Matrix
- 11.2. Market Share Analysis, By Key Player
- 11.3. Competitive Scenario Analysis, By Key Player
- 11.3.1. Merger & Acquisition
- 11.3.1.1. Gridspertise Acquires Nordic Metering Provider Aidon
- 11.3.2. New Product Launch & Enhancement
- 11.3.2.1. ABB India Strengthens its Portfolio of Energy Efficiency Devices with a New Range of Smart Metering Solutions for Efficient Energy Management
- 11.3.3. Award, Recognition, & Expansion
- 11.3.3.1. Adani Energy forms JV with IHC-backed Firm to Expand Smart-Meter Business
- 11.3.1. Merger & Acquisition
12. Competitive Portfolio
- 12.1. Key Company Profiles
- 12.1.1. ABB Ltd.
- 12.1.2. Advanced Electronics Company
- 12.1.3. Carrel Electrade Limited
- 12.1.4. Circutor SA
- 12.1.5. EASTRON ELECTRONIC CO., LTD.
- 12.1.6. Eaton Corporation PLC
- 12.1.7. EKM Metering Inc.
- 12.1.8. Elster Group GmbH by Honeywell International Inc.
- 12.1.9. General Electric company
- 12.1.10. Holley Technology Ltd.
- 12.1.11. HPL Electric and Power Limited
- 12.1.12. Iskraemeco Group
- 12.1.13. Itron, Inc.
- 12.1.14. Jiangsu Linyang Energy Co., Ltd.
- 12.1.15. Kamstrup A/S
- 12.1.16. Landis+Gyr AG
- 12.1.17. Murata Manufacturing Co., Ltd.
- 12.1.18. Ningbo Sanxing Electric Co. Ltd.
- 12.1.19. Osaki Electric Co. Ltd.
- 12.1.20. Schneider Electric SE
- 12.1.21. Sensus by Xylem Inc.
- 12.1.22. Siemens AG
- 12.1.23. Simpson Electric Company, Inc.
- 12.1.24. TE Connectivity Ltd.
- 12.1.25. Wasion International Co., Ltd.
- 12.2. Key Product Portfolio
13. Appendix
- 13.1. Discussion Guide
- 13.2. License & Pricing
LIST OF FIGURES
- FIGURE 1. DIGITAL POWER METERS MARKET RESEARCH PROCESS
- FIGURE 2. DIGITAL POWER METERS MARKET SIZE, 2023 VS 2030
- FIGURE 3. DIGITAL POWER METERS MARKET SIZE, 2018-2030 (USD MILLION)
- FIGURE 4. DIGITAL POWER METERS MARKET SIZE, BY REGION, 2023 VS 2030 (%)
- FIGURE 5. DIGITAL POWER METERS MARKET SIZE, BY REGION, 2023 VS 2024 VS 2030 (USD MILLION)
- FIGURE 6. DIGITAL POWER METERS MARKET DYNAMICS
- FIGURE 7. DIGITAL POWER METERS MARKET SIZE, BY PHASE, 2023 VS 2030 (%)
- FIGURE 8. DIGITAL POWER METERS MARKET SIZE, BY PHASE, 2023 VS 2024 VS 2030 (USD MILLION)
- FIGURE 9. DIGITAL POWER METERS MARKET SIZE, BY APPLICATION, 2023 VS 2030 (%)
- FIGURE 10. DIGITAL POWER METERS MARKET SIZE, BY APPLICATION, 2023 VS 2024 VS 2030 (USD MILLION)
- FIGURE 11. AMERICAS DIGITAL POWER METERS MARKET SIZE, BY COUNTRY, 2023 VS 2030 (%)
- FIGURE 12. AMERICAS DIGITAL POWER METERS MARKET SIZE, BY COUNTRY, 2023 VS 2024 VS 2030 (USD MILLION)
- FIGURE 13. UNITED STATES DIGITAL POWER METERS MARKET SIZE, BY STATE, 2023 VS 2030 (%)
- FIGURE 14. UNITED STATES DIGITAL POWER METERS MARKET SIZE, BY STATE, 2023 VS 2024 VS 2030 (USD MILLION)
- FIGURE 15. ASIA-PACIFIC DIGITAL POWER METERS MARKET SIZE, BY COUNTRY, 2023 VS 2030 (%)
- FIGURE 16. ASIA-PACIFIC DIGITAL POWER METERS MARKET SIZE, BY COUNTRY, 2023 VS 2024 VS 2030 (USD MILLION)
- FIGURE 17. EUROPE, MIDDLE EAST & AFRICA DIGITAL POWER METERS MARKET SIZE, BY COUNTRY, 2023 VS 2030 (%)
- FIGURE 18. EUROPE, MIDDLE EAST & AFRICA DIGITAL POWER METERS MARKET SIZE, BY COUNTRY, 2023 VS 2024 VS 2030 (USD MILLION)
- FIGURE 19. DIGITAL POWER METERS MARKET, FPNV POSITIONING MATRIX, 2023
- FIGURE 20. DIGITAL POWER METERS MARKET SHARE, BY KEY PLAYER, 2023
LIST OF TABLES
- TABLE 1. DIGITAL POWER METERS MARKET SEGMENTATION & COVERAGE
- TABLE 2. UNITED STATES DOLLAR EXCHANGE RATE, 2018-2023
- TABLE 3. DIGITAL POWER METERS MARKET SIZE, 2018-2030 (USD MILLION)
- TABLE 4. GLOBAL DIGITAL POWER METERS MARKET SIZE, BY REGION, 2018-2030 (USD MILLION)
- TABLE 5. DIGITAL POWER METERS MARKET SIZE, BY PHASE, 2018-2030 (USD MILLION)
- TABLE 6. DIGITAL POWER METERS MARKET SIZE, BY SINGLE PHASE, BY REGION, 2018-2030 (USD MILLION)
- TABLE 7. DIGITAL POWER METERS MARKET SIZE, BY THREE PHASE, BY REGION, 2018-2030 (USD MILLION)
- TABLE 8. DIGITAL POWER METERS MARKET SIZE, BY APPLICATION, 2018-2030 (USD MILLION)
- TABLE 9. DIGITAL POWER METERS MARKET SIZE, BY COMMERCIAL, BY REGION, 2018-2030 (USD MILLION)
- TABLE 10. DIGITAL POWER METERS MARKET SIZE, BY INDUSTRIAL, BY REGION, 2018-2030 (USD MILLION)
- TABLE 11. DIGITAL POWER METERS MARKET SIZE, BY RESIDENTIAL, BY REGION, 2018-2030 (USD MILLION)
- TABLE 12. AMERICAS DIGITAL POWER METERS MARKET SIZE, BY PHASE, 2018-2030 (USD MILLION)
- TABLE 13. AMERICAS DIGITAL POWER METERS MARKET SIZE, BY APPLICATION, 2018-2030 (USD MILLION)
- TABLE 14. AMERICAS DIGITAL POWER METERS MARKET SIZE, BY COUNTRY, 2018-2030 (USD MILLION)
- TABLE 15. ARGENTINA DIGITAL POWER METERS MARKET SIZE, BY PHASE, 2018-2030 (USD MILLION)
- TABLE 16. ARGENTINA DIGITAL POWER METERS MARKET SIZE, BY APPLICATION, 2018-2030 (USD MILLION)
- TABLE 17. BRAZIL DIGITAL POWER METERS MARKET SIZE, BY PHASE, 2018-2030 (USD MILLION)
- TABLE 18. BRAZIL DIGITAL POWER METERS MARKET SIZE, BY APPLICATION, 2018-2030 (USD MILLION)
- TABLE 19. CANADA DIGITAL POWER METERS MARKET SIZE, BY PHASE, 2018-2030 (USD MILLION)
- TABLE 20. CANADA DIGITAL POWER METERS MARKET SIZE, BY APPLICATION, 2018-2030 (USD MILLION)
- TABLE 21. MEXICO DIGITAL POWER METERS MARKET SIZE, BY PHASE, 2018-2030 (USD MILLION)
- TABLE 22. MEXICO DIGITAL POWER METERS MARKET SIZE, BY APPLICATION, 2018-2030 (USD MILLION)
- TABLE 23. UNITED STATES DIGITAL POWER METERS MARKET SIZE, BY PHASE, 2018-2030 (USD MILLION)
- TABLE 24. UNITED STATES DIGITAL POWER METERS MARKET SIZE, BY APPLICATION, 2018-2030 (USD MILLION)
- TABLE 25. UNITED STATES DIGITAL POWER METERS MARKET SIZE, BY STATE, 2018-2030 (USD MILLION)
- TABLE 26. ASIA-PACIFIC DIGITAL POWER METERS MARKET SIZE, BY PHASE, 2018-2030 (USD MILLION)
- TABLE 27. ASIA-PACIFIC DIGITAL POWER METERS MARKET SIZE, BY APPLICATION, 2018-2030 (USD MILLION)
- TABLE 28. ASIA-PACIFIC DIGITAL POWER METERS MARKET SIZE, BY COUNTRY, 2018-2030 (USD MILLION)
- TABLE 29. AUSTRALIA DIGITAL POWER METERS MARKET SIZE, BY PHASE, 2018-2030 (USD MILLION)
- TABLE 30. AUSTRALIA DIGITAL POWER METERS MARKET SIZE, BY APPLICATION, 2018-2030 (USD MILLION)
- TABLE 31. CHINA DIGITAL POWER METERS MARKET SIZE, BY PHASE, 2018-2030 (USD MILLION)
- TABLE 32. CHINA DIGITAL POWER METERS MARKET SIZE, BY APPLICATION, 2018-2030 (USD MILLION)
- TABLE 33. INDIA DIGITAL POWER METERS MARKET SIZE, BY PHASE, 2018-2030 (USD MILLION)
- TABLE 34. INDIA DIGITAL POWER METERS MARKET SIZE, BY APPLICATION, 2018-2030 (USD MILLION)
- TABLE 35. INDONESIA DIGITAL POWER METERS MARKET SIZE, BY PHASE, 2018-2030 (USD MILLION)
- TABLE 36. INDONESIA DIGITAL POWER METERS MARKET SIZE, BY APPLICATION, 2018-2030 (USD MILLION)
- TABLE 37. JAPAN DIGITAL POWER METERS MARKET SIZE, BY PHASE, 2018-2030 (USD MILLION)
- TABLE 38. JAPAN DIGITAL POWER METERS MARKET SIZE, BY APPLICATION, 2018-2030 (USD MILLION)
- TABLE 39. MALAYSIA DIGITAL POWER METERS MARKET SIZE, BY PHASE, 2018-2030 (USD MILLION)
- TABLE 40. MALAYSIA DIGITAL POWER METERS MARKET SIZE, BY APPLICATION, 2018-2030 (USD MILLION)
- TABLE 41. PHILIPPINES DIGITAL POWER METERS MARKET SIZE, BY PHASE, 2018-2030 (USD MILLION)
- TABLE 42. PHILIPPINES DIGITAL POWER METERS MARKET SIZE, BY APPLICATION, 2018-2030 (USD MILLION)
- TABLE 43. SINGAPORE DIGITAL POWER METERS MARKET SIZE, BY PHASE, 2018-2030 (USD MILLION)
- TABLE 44. SINGAPORE DIGITAL POWER METERS MARKET SIZE, BY APPLICATION, 2018-2030 (USD MILLION)
- TABLE 45. SOUTH KOREA DIGITAL POWER METERS MARKET SIZE, BY PHASE, 2018-2030 (USD MILLION)
- TABLE 46. SOUTH KOREA DIGITAL POWER METERS MARKET SIZE, BY APPLICATION, 2018-2030 (USD MILLION)
- TABLE 47. TAIWAN DIGITAL POWER METERS MARKET SIZE, BY PHASE, 2018-2030 (USD MILLION)
- TABLE 48. TAIWAN DIGITAL POWER METERS MARKET SIZE, BY APPLICATION, 2018-2030 (USD MILLION)
- TABLE 49. THAILAND DIGITAL POWER METERS MARKET SIZE, BY PHASE, 2018-2030 (USD MILLION)
- TABLE 50. THAILAND DIGITAL POWER METERS MARKET SIZE, BY APPLICATION, 2018-2030 (USD MILLION)
- TABLE 51. VIETNAM DIGITAL POWER METERS MARKET SIZE, BY PHASE, 2018-2030 (USD MILLION)
- TABLE 52. VIETNAM DIGITAL POWER METERS MARKET SIZE, BY APPLICATION, 2018-2030 (USD MILLION)
- TABLE 53. EUROPE, MIDDLE EAST & AFRICA DIGITAL POWER METERS MARKET SIZE, BY PHASE, 2018-2030 (USD MILLION)
- TABLE 54. EUROPE, MIDDLE EAST & AFRICA DIGITAL POWER METERS MARKET SIZE, BY APPLICATION, 2018-2030 (USD MILLION)
- TABLE 55. EUROPE, MIDDLE EAST & AFRICA DIGITAL POWER METERS MARKET SIZE, BY COUNTRY, 2018-2030 (USD MILLION)
- TABLE 56. DENMARK DIGITAL POWER METERS MARKET SIZE, BY PHASE, 2018-2030 (USD MILLION)
- TABLE 57. DENMARK DIGITAL POWER METERS MARKET SIZE, BY APPLICATION, 2018-2030 (USD MILLION)
- TABLE 58. EGYPT DIGITAL POWER METERS MARKET SIZE, BY PHASE, 2018-2030 (USD MILLION)
- TABLE 59. EGYPT DIGITAL POWER METERS MARKET SIZE, BY APPLICATION, 2018-2030 (USD MILLION)
- TABLE 60. FINLAND DIGITAL POWER METERS MARKET SIZE, BY PHASE, 2018-2030 (USD MILLION)
- TABLE 61. FINLAND DIGITAL POWER METERS MARKET SIZE, BY APPLICATION, 2018-2030 (USD MILLION)
- TABLE 62. FRANCE DIGITAL POWER METERS MARKET SIZE, BY PHASE, 2018-2030 (USD MILLION)
- TABLE 63. FRANCE DIGITAL POWER METERS MARKET SIZE, BY APPLICATION, 2018-2030 (USD MILLION)
- TABLE 64. GERMANY DIGITAL POWER METERS MARKET SIZE, BY PHASE, 2018-2030 (USD MILLION)
- TABLE 65. GERMANY DIGITAL POWER METERS MARKET SIZE, BY APPLICATION, 2018-2030 (USD MILLION)
- TABLE 66. ISRAEL DIGITAL POWER METERS MARKET SIZE, BY PHASE, 2018-2030 (USD MILLION)
- TABLE 67. ISRAEL DIGITAL POWER METERS MARKET SIZE, BY APPLICATION, 2018-2030 (USD MILLION)
- TABLE 68. ITALY DIGITAL POWER METERS MARKET SIZE, BY PHASE, 2018-2030 (USD MILLION)
- TABLE 69. ITALY DIGITAL POWER METERS MARKET SIZE, BY APPLICATION, 2018-2030 (USD MILLION)
- TABLE 70. NETHERLANDS DIGITAL POWER METERS MARKET SIZE, BY PHASE, 2018-2030 (USD MILLION)
- TABLE 71. NETHERLANDS DIGITAL POWER METERS MARKET SIZE, BY APPLICATION, 2018-2030 (USD MILLION)
- TABLE 72. NIGERIA DIGITAL POWER METERS MARKET SIZE, BY PHASE, 2018-2030 (USD MILLION)
- TABLE 73. NIGERIA DIGITAL POWER METERS MARKET SIZE, BY APPLICATION, 2018-2030 (USD MILLION)
- TABLE 74. NORWAY DIGITAL POWER METERS MARKET SIZE, BY PHASE, 2018-2030 (USD MILLION)
- TABLE 75. NORWAY DIGITAL POWER METERS MARKET SIZE, BY APPLICATION, 2018-2030 (USD MILLION)
- TABLE 76. POLAND DIGITAL POWER METERS MARKET SIZE, BY PHASE, 2018-2030 (USD MILLION)
- TABLE 77. POLAND DIGITAL POWER METERS MARKET SIZE, BY APPLICATION, 2018-2030 (USD MILLION)
- TABLE 78. QATAR DIGITAL POWER METERS MARKET SIZE, BY PHASE, 2018-2030 (USD MILLION)
- TABLE 79. QATAR DIGITAL POWER METERS MARKET SIZE, BY APPLICATION, 2018-2030 (USD MILLION)
- TABLE 80. RUSSIA DIGITAL POWER METERS MARKET SIZE, BY PHASE, 2018-2030 (USD MILLION)
- TABLE 81. RUSSIA DIGITAL POWER METERS MARKET SIZE, BY APPLICATION, 2018-2030 (USD MILLION)
- TABLE 82. SAUDI ARABIA DIGITAL POWER METERS MARKET SIZE, BY PHASE, 2018-2030 (USD MILLION)
- TABLE 83. SAUDI ARABIA DIGITAL POWER METERS MARKET SIZE, BY APPLICATION, 2018-2030 (USD MILLION)
- TABLE 84. SOUTH AFRICA DIGITAL POWER METERS MARKET SIZE, BY PHASE, 2018-2030 (USD MILLION)
- TABLE 85. SOUTH AFRICA DIGITAL POWER METERS MARKET SIZE, BY APPLICATION, 2018-2030 (USD MILLION)
- TABLE 86. SPAIN DIGITAL POWER METERS MARKET SIZE, BY PHASE, 2018-2030 (USD MILLION)
- TABLE 87. SPAIN DIGITAL POWER METERS MARKET SIZE, BY APPLICATION, 2018-2030 (USD MILLION)
- TABLE 88. SWEDEN DIGITAL POWER METERS MARKET SIZE, BY PHASE, 2018-2030 (USD MILLION)
- TABLE 89. SWEDEN DIGITAL POWER METERS MARKET SIZE, BY APPLICATION, 2018-2030 (USD MILLION)
- TABLE 90. SWITZERLAND DIGITAL POWER METERS MARKET SIZE, BY PHASE, 2018-2030 (USD MILLION)
- TABLE 91. SWITZERLAND DIGITAL POWER METERS MARKET SIZE, BY APPLICATION, 2018-2030 (USD MILLION)
- TABLE 92. TURKEY DIGITAL POWER METERS MARKET SIZE, BY PHASE, 2018-2030 (USD MILLION)
- TABLE 93. TURKEY DIGITAL POWER METERS MARKET SIZE, BY APPLICATION, 2018-2030 (USD MILLION)
- TABLE 94. UNITED ARAB EMIRATES DIGITAL POWER METERS MARKET SIZE, BY PHASE, 2018-2030 (USD MILLION)
- TABLE 95. UNITED ARAB EMIRATES DIGITAL POWER METERS MARKET SIZE, BY APPLICATION, 2018-2030 (USD MILLION)
- TABLE 96. UNITED KINGDOM DIGITAL POWER METERS MARKET SIZE, BY PHASE, 2018-2030 (USD MILLION)
- TABLE 97. UNITED KINGDOM DIGITAL POWER METERS MARKET SIZE, BY APPLICATION, 2018-2030 (USD MILLION)
- TABLE 98. DIGITAL POWER METERS MARKET, FPNV POSITIONING MATRIX, 2023
- TABLE 99. DIGITAL POWER METERS MARKET SHARE, BY KEY PLAYER, 2023
- TABLE 100. DIGITAL POWER METERS MARKET LICENSE & PRICING
 全球電錶市場規模、佔有率、成長分析(按電錶類型、分階段)- 產業預測,2024-2031 年
 2024-2032 年預付費電錶市場報告(按類型、組件、階段、最終用戶和地區)
 單相電錶市場報告:2030 年趨勢、預測與競爭分析
 全球電力計量市場:按階段、按應用:機會分析和產業預測(2023-2032)
 數位功率計市場報告:2030 年趨勢、預測與競爭分析
 電錶市場:按技術(類比電錶、數位電錶、智慧電錶)、最終用戶(商業、工業、住宅)分類 - 全球預測 2023-2030 年
 功率計市場:全球產業分析,規模,佔有率,成長,趨勢,預測,2023年~2031年
 數位功率計的全球市場
 電力計量市場 - 增長、趨勢、COVID-19 影響和預測 (2023-2028)
 電力數量計的全球市場 2022-2026