


 |
市場調查報告書
商品編碼
1413872
皮帶張力計市場:按類型、應用、機械和汽車維修 - 全球預測,2024-2030 年Belt Tension Meter Market by Type (Flat Belt, Ribbed Belts, Round Belt), Application (Automotive Store (OEM)), Mechanical & Auto Repair) - Global Forecast 2024-2030 |
||||||
※ 本網頁內容可能與最新版本有所差異。詳細情況請與我們聯繫。
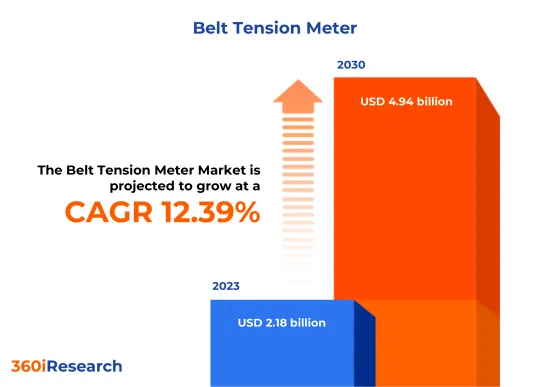
預計2023年皮帶張力計市場規模為21.8億美元,預計2024年將達24.4億美元,2030年將達到49.4億美元,複合年成長率為12.39%。
皮帶張力計的世界市場
| 主要市場統計 | |
|---|---|
| 基準年[2023] | 21.8億美元 |
| 預測年份 [2024] | 24.4億美元 |
| 預測年份 [2030] | 49.4億美元 |
| 複合年成長率(%) | 12.39% |
皮帶張力計是一種測量皮帶張力的設備,這對於確保皮帶驅動機械的最佳性能和使用壽命非常重要。該工具通常用於多種行業,包括汽車、製造和物料搬運。促使其使用不斷成長的因素包括對預防性保養的日益關注以及確保機械高效運行以提高生產率和降低成本的需要。精確的張力測量以及能夠避免張緊不足和過度張緊等優點正在推動採用,張緊不足和過度張緊可能導致皮帶磨損和設備損壞。然而,儘管皮帶張力計有這些優點,但它需要專業技術才能準確解釋結果,並且需要定期校準以保持精度,並且存在性別等缺點。透過對負責人進行充分培訓並嚴格遵守設備維護計劃,可以克服這些挑戰。此外,技術進步以及與數位工具的整合提供了未來的機會。感測器技術和連接性的改進可能會導致智慧張力計的發展,該張力計可以提供即時監控和回饋,從而提高這些儀器在預測性維護計劃中的易用性和有效性。
區域洞察
由於汽車和工業領域皮帶張力的精確測量對於機器維護和使用壽命至關重要,因此皮帶張力計的應用在美洲不斷擴大。該地區的電錶生產先進,注重技術創新,以確保準確性和耐用性。在該地區營運的知名公司將全球專業知識與本地客戶服務結合起來,以維持市場需求。亞太地區以中國和印度等經濟快速成長為特點,對皮帶張力計的需求量很大,這主要是由於汽車和製造業的擴張。亞太地區的生產具有成本效益的特點,在全球市場上具有競爭力。亞太地區的企業正在加大研發投入,以提高產品品質並拓展銷售管道。同時,歐洲、中東和非洲地區,尤其是歐洲,注重皮帶張力計生產的精密工程和高品質標準。該地區穩定的需求得到了有關設備維護和工業安全的嚴格法規的支持。在歐洲、中東和非洲營運的公司通常將技術專長與對合規性和以用戶為中心的設計的高度重視相結合,並為那些在營運中重視可靠性和合規性的客戶提供服務。
FPNV定位矩陣
FPNV 定位矩陣對於評估皮帶張力計市場至關重要。我們檢視與業務策略和產品滿意度相關的關鍵指標,以對供應商進行全面評估。這種深入的分析使用戶能夠根據自己的要求做出明智的決策。根據評估,供應商被分為四個成功程度不同的像限。最前線 (F)、探路者 (P)、利基 (N) 和重要 (V)。
市場佔有率分析
市場佔有率分析是一種綜合工具,可以對皮帶張力計市場供應商的現狀進行深入而詳細的研究。全面比較和分析供應商在整體收益、基本客群和其他關鍵指標方面的貢獻,以便更好地了解公司的績效及其在爭奪市場佔有率時面臨的挑戰。此外,該分析還提供了對該行業競爭特徵的寶貴考察,包括在研究基準年觀察到的累積、分散主導地位和合併特徵等因素。這種詳細程度的提高使供應商能夠做出更明智的決策並制定有效的策略,從而在市場上獲得競爭優勢。
該報告對以下幾個方面提供了寶貴的見解:
1-市場滲透率:提供有關主要企業所服務的市場的全面資訊。
2-市場開拓:我們深入研究利潤豐厚的新興市場並分析其在成熟細分市場的滲透率。
3- 市場多元化:提供有關新產品發布、開拓地區、最新發展和投資的詳細資訊。
4-競爭力評估與資訊:對主要企業的市場佔有率、策略、產品、認證、監管狀況、專利狀況、製造能力等進行全面評估。
5- 產品開發與創新:提供對未來技術、研發活動和突破性產品開發的見解。
本報告解決了以下關鍵問題:
1-皮帶張力計市場的市場規模與預測是多少?
2-在皮帶張力計市場預測期內,有哪些產品、細分市場、應用和領域需要考慮投資?
3-皮帶張力計市場的技術趨勢和法律規範是什麼?
4-皮帶張力計市場主要供應商的市場佔有率是多少?
5-進入皮帶張力計市場適合的型態和策略手段有哪些?
目錄
第1章 前言
第2章調查方法
第3章執行摘要
第4章市場概況
第5章市場洞察
- 市場動態
- 促進因素
- 確保工業生產精確操作和安全的需求日益增加
- 擴大建設計劃和活性化基礎設施開發活動
- 抑制因素
- 皮帶張力計的技術和性能限制
- 機會
- 新進展提高了皮帶張力計的性能和效率
- 使用汽車皮帶張力計測量和調整特定組件
- 任務
- 皮帶張力計在某些極端條件下不起作用
- 促進因素
- 市場區隔分析
- 類型:多楔帶張力計可用於更高負載
- 應用: OEM製造商對高精度皮帶張力測量工具的需求
- 市場趨勢分析
- 高通膨的累積效應
- 波特五力分析
- 價值鍊和關鍵路徑分析
- 法律規範
第6章皮帶張力計市場:按類型
- 介紹
- 平帶
- 羅紋腰帶
- 圓帶
- V帶
第7章皮帶張力計市場:依應用分類
- 介紹
- 汽車經銷商(OEM)
- 機械和汽車修理
第8章北美、南美皮帶張力計市場
- 介紹
- 阿根廷
- 巴西
- 加拿大
- 墨西哥
- 美國
第9章亞太皮帶張力計市場
- 介紹
- 澳洲
- 中國
- 印度
- 印尼
- 日本
- 馬來西亞
- 菲律賓
- 新加坡
- 韓國
- 台灣
- 泰國
- 越南
第10章歐洲、中東和非洲皮帶張力計市場
- 介紹
- 丹麥
- 埃及
- 芬蘭
- 法國
- 德國
- 以色列
- 義大利
- 荷蘭
- 奈及利亞
- 挪威
- 波蘭
- 卡達
- 俄羅斯
- 沙烏地阿拉伯
- 南非
- 西班牙
- 瑞典
- 瑞士
- 土耳其
- 阿拉伯聯合大公國
- 英國
第11章競爭形勢
- FPNV定位矩陣
- 市場佔有率分析:主要企業
- 主要企業競爭情境分析
- 新產品發布和功能增強
第12章競爭產品組合
- 主要公司簡介
- AB SKF
- Bando Chemical Industries, LTD.
- BAR-TEK Motorsport GmbH
- BRECOflex CO., LLC
- Checkline(ELECTROMATIC Equipment Co., Inc.)
- Continental AG
- Gates Corporation
- Hans Schmidt & Co GmbH
- Harley-Davidson, Inc.
- Hilger u. Kern GmbH
- Integrated Display System ltd.
- Mextech Technologies Pvt. Ltd
- norelem Normelemente GmbH & Co. KG
- One-Too Company
- PCE Instruments
- PIX Transmissions Ltd.
- Rainbow Precision Products
- SAMA Italia Srl
- Schaeffler AG
- SIT SpA
- SNA Europe
- Tensitron by KTC Instruments
- Timken Company
- Tsubakimoto Chain Co.
- TYMA CZ, sro
- VTSYIQI Lab Measuring Instruments
- West3D LLC
- 主要產品系列
第13章附錄
- 討論指南
- 關於許可證和定價
[180 Pages Report] The Belt Tension Meter Market size was estimated at USD 2.18 billion in 2023 and expected to reach USD 2.44 billion in 2024, at a CAGR 12.39% to reach USD 4.94 billion by 2030.
Global Belt Tension Meter Market
| KEY MARKET STATISTICS | |
|---|---|
| Base Year [2023] | USD 2.18 billion |
| Estimated Year [2024] | USD 2.44 billion |
| Forecast Year [2030] | USD 4.94 billion |
| CAGR (%) | 12.39% |
A belt tension meter is a device used to measure the amount of tension in belts, which is crucial for ensuring the optimal performance and longevity of belt-driven machinery. This tool is commonly utilized in a range of industries, including automotive, manufacturing, and material handling. Factors contributing to their expanding use include the increased focus on preventative maintenance and the need to ensure efficient operation of machinery for productivity and cost savings. Advantages such as precise tension measurements and the prevention of both under-tensioning and over-tensioning, which can lead to belt wear and equipment damage, fuel their adoption. However, despite their benefits, belt tension meters come with disadvantages, such as the requirement for technical expertise to interpret the results accurately and the potential need for regular calibration to maintain precision. These challenges can be overcome by providing adequate training to personnel and adhering to a strict maintenance schedule for the device. Moreover, technological advancements and integration with digital tools present future opportunities. Improvements in sensor technology and connectivity could lead to the development of smart tension meters that provide real-time monitoring and feedback, improving the ease of use and effectiveness of these instruments in predictive maintenance programs.
Regional Insights
In the Americas, the application of belt tension meters is widespread due to the region's robust automotive and industrial sectors, where precise belt tensioning is crucial for machinery maintenance and longevity. Production of these meters in this region is advanced, with an emphasis on technological innovation to ensure accuracy and durability. Notable companies operating in the region merge global expertise with local customer service to sustain market demands. The APAC region, marked by fast-growing economies such as China and India, exhibits a significant demand for belt tension meters, primarily driven by the expanding automotive and manufacturing industries. Production in APAC is often characterized by cost efficiency, which positions it competitively in the global market. Companies in the APAC region are increasingly investing in research and development to improve product quality and expand their reach. Meanwhile, the EMEA region, particularly Europe, maintains a focus on precision engineering and high-quality standards in the production of belt tension meters. Stringent regulations pertaining to equipment maintenance and industrial safety underpin the steady demand within this region. Companies operating in EMEA typically combine technological expertise with a strong focus on compliance and user-centric designs, making them a preferred choice for customers who value reliability and regulatory adherence in their operations.
FPNV Positioning Matrix
The FPNV Positioning Matrix is pivotal in evaluating the Belt Tension Meter Market. It offers a comprehensive assessment of vendors, examining key metrics related to Business Strategy and Product Satisfaction. This in-depth analysis empowers users to make well-informed decisions aligned with their requirements. Based on the evaluation, the vendors are then categorized into four distinct quadrants representing varying levels of success: Forefront (F), Pathfinder (P), Niche (N), or Vital (V).
Market Share Analysis
The Market Share Analysis is a comprehensive tool that provides an insightful and in-depth examination of the current state of vendors in the Belt Tension Meter Market. By meticulously comparing and analyzing vendor contributions in terms of overall revenue, customer base, and other key metrics, we can offer companies a greater understanding of their performance and the challenges they face when competing for market share. Additionally, this analysis provides valuable insights into the competitive nature of the sector, including factors such as accumulation, fragmentation dominance, and amalgamation traits observed over the base year period studied. With this expanded level of detail, vendors can make more informed decisions and devise effective strategies to gain a competitive edge in the market.
Key Company Profiles
The report delves into recent significant developments in the Belt Tension Meter Market, highlighting leading vendors and their innovative profiles. These include AB SKF, Bando Chemical Industries, LTD., BAR-TEK Motorsport GmbH, BRECOflex CO., L.L.C., Checkline (ELECTROMATIC Equipment Co., Inc.), Continental AG, Gates Corporation, Hans Schmidt & Co GmbH, Harley-Davidson, Inc., Hilger u. Kern GmbH, Integrated Display System ltd., Mextech Technologies Pvt. Ltd, norelem Normelemente GmbH & Co. KG, One-Too Company, PCE Instruments, PIX Transmissions Ltd., Rainbow Precision Products, S.A.M.A. Italia S.r.l., Schaeffler AG, SIT S.p.A., SNA Europe, Tensitron by KTC Instruments, Timken Company, Tsubakimoto Chain Co., TYMA CZ, s.r.o., VTSYIQI Lab Measuring Instruments, and West3D LLC.
Market Segmentation & Coverage
This research report categorizes the Belt Tension Meter Market to forecast the revenues and analyze trends in each of the following sub-markets:
- Type
- Flat Belt
- Ribbed Belts
- Round Belt
- V Belt
- Application
- Automotive Store (OEM))
- Mechanical & Auto Repair
- Region
- Americas
- Argentina
- Brazil
- Canada
- Mexico
- United States
- California
- Florida
- Illinois
- New York
- Ohio
- Pennsylvania
- Texas
- Asia-Pacific
- Australia
- China
- India
- Indonesia
- Japan
- Malaysia
- Philippines
- Singapore
- South Korea
- Taiwan
- Thailand
- Vietnam
- Europe, Middle East & Africa
- Denmark
- Egypt
- Finland
- France
- Germany
- Israel
- Italy
- Netherlands
- Nigeria
- Norway
- Poland
- Qatar
- Russia
- Saudi Arabia
- South Africa
- Spain
- Sweden
- Switzerland
- Turkey
- United Arab Emirates
- United Kingdom
- Americas
The report offers valuable insights on the following aspects:
1. Market Penetration: It presents comprehensive information on the market provided by key players.
2. Market Development: It delves deep into lucrative emerging markets and analyzes the penetration across mature market segments.
3. Market Diversification: It provides detailed information on new product launches, untapped geographic regions, recent developments, and investments.
4. Competitive Assessment & Intelligence: It conducts an exhaustive assessment of market shares, strategies, products, certifications, regulatory approvals, patent landscape, and manufacturing capabilities of the leading players.
5. Product Development & Innovation: It offers intelligent insights on future technologies, R&D activities, and breakthrough product developments.
The report addresses key questions such as:
1. What is the market size and forecast of the Belt Tension Meter Market?
2. Which products, segments, applications, and areas should one consider investing in over the forecast period in the Belt Tension Meter Market?
3. What are the technology trends and regulatory frameworks in the Belt Tension Meter Market?
4. What is the market share of the leading vendors in the Belt Tension Meter Market?
5. Which modes and strategic moves are suitable for entering the Belt Tension Meter Market?
Table of Contents
1. Preface
- 1.1. Objectives of the Study
- 1.2. Market Segmentation & Coverage
- 1.3. Years Considered for the Study
- 1.4. Currency & Pricing
- 1.5. Language
- 1.6. Limitations
- 1.7. Assumptions
- 1.8. Stakeholders
2. Research Methodology
- 2.1. Define: Research Objective
- 2.2. Determine: Research Design
- 2.3. Prepare: Research Instrument
- 2.4. Collect: Data Source
- 2.5. Analyze: Data Interpretation
- 2.6. Formulate: Data Verification
- 2.7. Publish: Research Report
- 2.8. Repeat: Report Update
3. Executive Summary
4. Market Overview
- 4.1. Introduction
- 4.2. Belt Tension Meter Market, by Region
5. Market Insights
- 5.1. Market Dynamics
- 5.1.1. Drivers
- 5.1.1.1. Growing need to ensure precise operations and safety in industrial production
- 5.1.1.2. Expansion of construction projects and rising infrastructure development activities
- 5.1.2. Restraints
- 5.1.2.1. Technical and performance limitations of belt tension meters
- 5.1.3. Opportunities
- 5.1.3.1. Novel advancements to improve the performance and efficiency of belt tension meters
- 5.1.3.2. Utilization of belt tension meters in automobiles to measure and adjust certain components
- 5.1.4. Challenges
- 5.1.4.1. Inability of belt tension meters to work in certain extreme conditions
- 5.1.1. Drivers
- 5.2. Market Segmentation Analysis
- 5.2.1. Type: Potential of ribbed belts tension meter to accommodate higher loads
- 5.2.2. Application: Need for highly precise belt tension measurement tools by original equipment manufacturers
- 5.3. Market Trend Analysis
- 5.4. Cumulative Impact of High Inflation
- 5.5. Porter's Five Forces Analysis
- 5.5.1. Threat of New Entrants
- 5.5.2. Threat of Substitutes
- 5.5.3. Bargaining Power of Customers
- 5.5.4. Bargaining Power of Suppliers
- 5.5.5. Industry Rivalry
- 5.6. Value Chain & Critical Path Analysis
- 5.7. Regulatory Framework
6. Belt Tension Meter Market, by Type
- 6.1. Introduction
- 6.2. Flat Belt
- 6.3. Ribbed Belts
- 6.4. Round Belt
- 6.5. V Belt
7. Belt Tension Meter Market, by Application
- 7.1. Introduction
- 7.2. Automotive Store (OEM))
- 7.3. Mechanical & Auto Repair
8. Americas Belt Tension Meter Market
- 8.1. Introduction
- 8.2. Argentina
- 8.3. Brazil
- 8.4. Canada
- 8.5. Mexico
- 8.6. United States
9. Asia-Pacific Belt Tension Meter Market
- 9.1. Introduction
- 9.2. Australia
- 9.3. China
- 9.4. India
- 9.5. Indonesia
- 9.6. Japan
- 9.7. Malaysia
- 9.8. Philippines
- 9.9. Singapore
- 9.10. South Korea
- 9.11. Taiwan
- 9.12. Thailand
- 9.13. Vietnam
10. Europe, Middle East & Africa Belt Tension Meter Market
- 10.1. Introduction
- 10.2. Denmark
- 10.3. Egypt
- 10.4. Finland
- 10.5. France
- 10.6. Germany
- 10.7. Israel
- 10.8. Italy
- 10.9. Netherlands
- 10.10. Nigeria
- 10.11. Norway
- 10.12. Poland
- 10.13. Qatar
- 10.14. Russia
- 10.15. Saudi Arabia
- 10.16. South Africa
- 10.17. Spain
- 10.18. Sweden
- 10.19. Switzerland
- 10.20. Turkey
- 10.21. United Arab Emirates
- 10.22. United Kingdom
11. Competitive Landscape
- 11.1. FPNV Positioning Matrix
- 11.2. Market Share Analysis, By Key Player
- 11.3. Competitive Scenario Analysis, By Key Player
- 11.3.1. New Product Launch & Enhancement
- 11.3.1.1. NTN Develops "Twin Arm Auto Tensioner for Accessory Drive Belt System"
- 11.3.1. New Product Launch & Enhancement
12. Competitive Portfolio
- 12.1. Key Company Profiles
- 12.1.1. AB SKF
- 12.1.2. Bando Chemical Industries, LTD.
- 12.1.3. BAR-TEK Motorsport GmbH
- 12.1.4. BRECOflex CO., L.L.C.
- 12.1.5. Checkline (ELECTROMATIC Equipment Co., Inc.)
- 12.1.6. Continental AG
- 12.1.7. Gates Corporation
- 12.1.8. Hans Schmidt & Co GmbH
- 12.1.9. Harley-Davidson, Inc.
- 12.1.10. Hilger u. Kern GmbH
- 12.1.11. Integrated Display System ltd.
- 12.1.12. Mextech Technologies Pvt. Ltd
- 12.1.13. norelem Normelemente GmbH & Co. KG
- 12.1.14. One-Too Company
- 12.1.15. PCE Instruments
- 12.1.16. PIX Transmissions Ltd.
- 12.1.17. Rainbow Precision Products
- 12.1.18. S.A.M.A. Italia S.r.l.
- 12.1.19. Schaeffler AG
- 12.1.20. SIT S.p.A.
- 12.1.21. SNA Europe
- 12.1.22. Tensitron by KTC Instruments
- 12.1.23. Timken Company
- 12.1.24. Tsubakimoto Chain Co.
- 12.1.25. TYMA CZ, s.r.o.
- 12.1.26. VTSYIQI Lab Measuring Instruments
- 12.1.27. West3D LLC
- 12.2. Key Product Portfolio
13. Appendix
- 13.1. Discussion Guide
- 13.2. License & Pricing
LIST OF FIGURES
- FIGURE 1. BELT TENSION METER MARKET RESEARCH PROCESS
- FIGURE 2. BELT TENSION METER MARKET SIZE, 2023 VS 2030
- FIGURE 3. BELT TENSION METER MARKET SIZE, 2018-2030 (USD MILLION)
- FIGURE 4. BELT TENSION METER MARKET SIZE, BY REGION, 2023 VS 2030 (%)
- FIGURE 5. BELT TENSION METER MARKET SIZE, BY REGION, 2023 VS 2024 VS 2030 (USD MILLION)
- FIGURE 6. BELT TENSION METER MARKET DYNAMICS
- FIGURE 7. BELT TENSION METER MARKET SIZE, BY TYPE, 2023 VS 2030 (%)
- FIGURE 8. BELT TENSION METER MARKET SIZE, BY TYPE, 2023 VS 2024 VS 2030 (USD MILLION)
- FIGURE 9. BELT TENSION METER MARKET SIZE, BY APPLICATION, 2023 VS 2030 (%)
- FIGURE 10. BELT TENSION METER MARKET SIZE, BY APPLICATION, 2023 VS 2024 VS 2030 (USD MILLION)
- FIGURE 11. AMERICAS BELT TENSION METER MARKET SIZE, BY COUNTRY, 2023 VS 2030 (%)
- FIGURE 12. AMERICAS BELT TENSION METER MARKET SIZE, BY COUNTRY, 2023 VS 2024 VS 2030 (USD MILLION)
- FIGURE 13. UNITED STATES BELT TENSION METER MARKET SIZE, BY STATE, 2023 VS 2030 (%)
- FIGURE 14. UNITED STATES BELT TENSION METER MARKET SIZE, BY STATE, 2023 VS 2024 VS 2030 (USD MILLION)
- FIGURE 15. ASIA-PACIFIC BELT TENSION METER MARKET SIZE, BY COUNTRY, 2023 VS 2030 (%)
- FIGURE 16. ASIA-PACIFIC BELT TENSION METER MARKET SIZE, BY COUNTRY, 2023 VS 2024 VS 2030 (USD MILLION)
- FIGURE 17. EUROPE, MIDDLE EAST & AFRICA BELT TENSION METER MARKET SIZE, BY COUNTRY, 2023 VS 2030 (%)
- FIGURE 18. EUROPE, MIDDLE EAST & AFRICA BELT TENSION METER MARKET SIZE, BY COUNTRY, 2023 VS 2024 VS 2030 (USD MILLION)
- FIGURE 19. BELT TENSION METER MARKET, FPNV POSITIONING MATRIX, 2023
- FIGURE 20. BELT TENSION METER MARKET SHARE, BY KEY PLAYER, 2023
LIST OF TABLES
- TABLE 1. BELT TENSION METER MARKET SEGMENTATION & COVERAGE
- TABLE 2. UNITED STATES DOLLAR EXCHANGE RATE, 2018-2023
- TABLE 3. BELT TENSION METER MARKET SIZE, 2018-2030 (USD MILLION)
- TABLE 4. GLOBAL BELT TENSION METER MARKET SIZE, BY REGION, 2018-2030 (USD MILLION)
- TABLE 5. BELT TENSION METER MARKET SIZE, BY TYPE, 2018-2030 (USD MILLION)
- TABLE 6. BELT TENSION METER MARKET SIZE, BY FLAT BELT, BY REGION, 2018-2030 (USD MILLION)
- TABLE 7. BELT TENSION METER MARKET SIZE, BY RIBBED BELTS, BY REGION, 2018-2030 (USD MILLION)
- TABLE 8. BELT TENSION METER MARKET SIZE, BY ROUND BELT, BY REGION, 2018-2030 (USD MILLION)
- TABLE 9. BELT TENSION METER MARKET SIZE, BY V BELT, BY REGION, 2018-2030 (USD MILLION)
- TABLE 10. BELT TENSION METER MARKET SIZE, BY APPLICATION, 2018-2030 (USD MILLION)
- TABLE 11. BELT TENSION METER MARKET SIZE, BY AUTOMOTIVE STORE (OEM)), BY REGION, 2018-2030 (USD MILLION)
- TABLE 12. BELT TENSION METER MARKET SIZE, BY MECHANICAL & AUTO REPAIR, BY REGION, 2018-2030 (USD MILLION)
- TABLE 13. AMERICAS BELT TENSION METER MARKET SIZE, BY TYPE, 2018-2030 (USD MILLION)
- TABLE 14. AMERICAS BELT TENSION METER MARKET SIZE, BY APPLICATION, 2018-2030 (USD MILLION)
- TABLE 15. AMERICAS BELT TENSION METER MARKET SIZE, BY COUNTRY, 2018-2030 (USD MILLION)
- TABLE 16. ARGENTINA BELT TENSION METER MARKET SIZE, BY TYPE, 2018-2030 (USD MILLION)
- TABLE 17. ARGENTINA BELT TENSION METER MARKET SIZE, BY APPLICATION, 2018-2030 (USD MILLION)
- TABLE 18. BRAZIL BELT TENSION METER MARKET SIZE, BY TYPE, 2018-2030 (USD MILLION)
- TABLE 19. BRAZIL BELT TENSION METER MARKET SIZE, BY APPLICATION, 2018-2030 (USD MILLION)
- TABLE 20. CANADA BELT TENSION METER MARKET SIZE, BY TYPE, 2018-2030 (USD MILLION)
- TABLE 21. CANADA BELT TENSION METER MARKET SIZE, BY APPLICATION, 2018-2030 (USD MILLION)
- TABLE 22. MEXICO BELT TENSION METER MARKET SIZE, BY TYPE, 2018-2030 (USD MILLION)
- TABLE 23. MEXICO BELT TENSION METER MARKET SIZE, BY APPLICATION, 2018-2030 (USD MILLION)
- TABLE 24. UNITED STATES BELT TENSION METER MARKET SIZE, BY TYPE, 2018-2030 (USD MILLION)
- TABLE 25. UNITED STATES BELT TENSION METER MARKET SIZE, BY APPLICATION, 2018-2030 (USD MILLION)
- TABLE 26. UNITED STATES BELT TENSION METER MARKET SIZE, BY STATE, 2018-2030 (USD MILLION)
- TABLE 27. ASIA-PACIFIC BELT TENSION METER MARKET SIZE, BY TYPE, 2018-2030 (USD MILLION)
- TABLE 28. ASIA-PACIFIC BELT TENSION METER MARKET SIZE, BY APPLICATION, 2018-2030 (USD MILLION)
- TABLE 29. ASIA-PACIFIC BELT TENSION METER MARKET SIZE, BY COUNTRY, 2018-2030 (USD MILLION)
- TABLE 30. AUSTRALIA BELT TENSION METER MARKET SIZE, BY TYPE, 2018-2030 (USD MILLION)
- TABLE 31. AUSTRALIA BELT TENSION METER MARKET SIZE, BY APPLICATION, 2018-2030 (USD MILLION)
- TABLE 32. CHINA BELT TENSION METER MARKET SIZE, BY TYPE, 2018-2030 (USD MILLION)
- TABLE 33. CHINA BELT TENSION METER MARKET SIZE, BY APPLICATION, 2018-2030 (USD MILLION)
- TABLE 34. INDIA BELT TENSION METER MARKET SIZE, BY TYPE, 2018-2030 (USD MILLION)
- TABLE 35. INDIA BELT TENSION METER MARKET SIZE, BY APPLICATION, 2018-2030 (USD MILLION)
- TABLE 36. INDONESIA BELT TENSION METER MARKET SIZE, BY TYPE, 2018-2030 (USD MILLION)
- TABLE 37. INDONESIA BELT TENSION METER MARKET SIZE, BY APPLICATION, 2018-2030 (USD MILLION)
- TABLE 38. JAPAN BELT TENSION METER MARKET SIZE, BY TYPE, 2018-2030 (USD MILLION)
- TABLE 39. JAPAN BELT TENSION METER MARKET SIZE, BY APPLICATION, 2018-2030 (USD MILLION)
- TABLE 40. MALAYSIA BELT TENSION METER MARKET SIZE, BY TYPE, 2018-2030 (USD MILLION)
- TABLE 41. MALAYSIA BELT TENSION METER MARKET SIZE, BY APPLICATION, 2018-2030 (USD MILLION)
- TABLE 42. PHILIPPINES BELT TENSION METER MARKET SIZE, BY TYPE, 2018-2030 (USD MILLION)
- TABLE 43. PHILIPPINES BELT TENSION METER MARKET SIZE, BY APPLICATION, 2018-2030 (USD MILLION)
- TABLE 44. SINGAPORE BELT TENSION METER MARKET SIZE, BY TYPE, 2018-2030 (USD MILLION)
- TABLE 45. SINGAPORE BELT TENSION METER MARKET SIZE, BY APPLICATION, 2018-2030 (USD MILLION)
- TABLE 46. SOUTH KOREA BELT TENSION METER MARKET SIZE, BY TYPE, 2018-2030 (USD MILLION)
- TABLE 47. SOUTH KOREA BELT TENSION METER MARKET SIZE, BY APPLICATION, 2018-2030 (USD MILLION)
- TABLE 48. TAIWAN BELT TENSION METER MARKET SIZE, BY TYPE, 2018-2030 (USD MILLION)
- TABLE 49. TAIWAN BELT TENSION METER MARKET SIZE, BY APPLICATION, 2018-2030 (USD MILLION)
- TABLE 50. THAILAND BELT TENSION METER MARKET SIZE, BY TYPE, 2018-2030 (USD MILLION)
- TABLE 51. THAILAND BELT TENSION METER MARKET SIZE, BY APPLICATION, 2018-2030 (USD MILLION)
- TABLE 52. VIETNAM BELT TENSION METER MARKET SIZE, BY TYPE, 2018-2030 (USD MILLION)
- TABLE 53. VIETNAM BELT TENSION METER MARKET SIZE, BY APPLICATION, 2018-2030 (USD MILLION)
- TABLE 54. EUROPE, MIDDLE EAST & AFRICA BELT TENSION METER MARKET SIZE, BY TYPE, 2018-2030 (USD MILLION)
- TABLE 55. EUROPE, MIDDLE EAST & AFRICA BELT TENSION METER MARKET SIZE, BY APPLICATION, 2018-2030 (USD MILLION)
- TABLE 56. EUROPE, MIDDLE EAST & AFRICA BELT TENSION METER MARKET SIZE, BY COUNTRY, 2018-2030 (USD MILLION)
- TABLE 57. DENMARK BELT TENSION METER MARKET SIZE, BY TYPE, 2018-2030 (USD MILLION)
- TABLE 58. DENMARK BELT TENSION METER MARKET SIZE, BY APPLICATION, 2018-2030 (USD MILLION)
- TABLE 59. EGYPT BELT TENSION METER MARKET SIZE, BY TYPE, 2018-2030 (USD MILLION)
- TABLE 60. EGYPT BELT TENSION METER MARKET SIZE, BY APPLICATION, 2018-2030 (USD MILLION)
- TABLE 61. FINLAND BELT TENSION METER MARKET SIZE, BY TYPE, 2018-2030 (USD MILLION)
- TABLE 62. FINLAND BELT TENSION METER MARKET SIZE, BY APPLICATION, 2018-2030 (USD MILLION)
- TABLE 63. FRANCE BELT TENSION METER MARKET SIZE, BY TYPE, 2018-2030 (USD MILLION)
- TABLE 64. FRANCE BELT TENSION METER MARKET SIZE, BY APPLICATION, 2018-2030 (USD MILLION)
- TABLE 65. GERMANY BELT TENSION METER MARKET SIZE, BY TYPE, 2018-2030 (USD MILLION)
- TABLE 66. GERMANY BELT TENSION METER MARKET SIZE, BY APPLICATION, 2018-2030 (USD MILLION)
- TABLE 67. ISRAEL BELT TENSION METER MARKET SIZE, BY TYPE, 2018-2030 (USD MILLION)
- TABLE 68. ISRAEL BELT TENSION METER MARKET SIZE, BY APPLICATION, 2018-2030 (USD MILLION)
- TABLE 69. ITALY BELT TENSION METER MARKET SIZE, BY TYPE, 2018-2030 (USD MILLION)
- TABLE 70. ITALY BELT TENSION METER MARKET SIZE, BY APPLICATION, 2018-2030 (USD MILLION)
- TABLE 71. NETHERLANDS BELT TENSION METER MARKET SIZE, BY TYPE, 2018-2030 (USD MILLION)
- TABLE 72. NETHERLANDS BELT TENSION METER MARKET SIZE, BY APPLICATION, 2018-2030 (USD MILLION)
- TABLE 73. NIGERIA BELT TENSION METER MARKET SIZE, BY TYPE, 2018-2030 (USD MILLION)
- TABLE 74. NIGERIA BELT TENSION METER MARKET SIZE, BY APPLICATION, 2018-2030 (USD MILLION)
- TABLE 75. NORWAY BELT TENSION METER MARKET SIZE, BY TYPE, 2018-2030 (USD MILLION)
- TABLE 76. NORWAY BELT TENSION METER MARKET SIZE, BY APPLICATION, 2018-2030 (USD MILLION)
- TABLE 77. POLAND BELT TENSION METER MARKET SIZE, BY TYPE, 2018-2030 (USD MILLION)
- TABLE 78. POLAND BELT TENSION METER MARKET SIZE, BY APPLICATION, 2018-2030 (USD MILLION)
- TABLE 79. QATAR BELT TENSION METER MARKET SIZE, BY TYPE, 2018-2030 (USD MILLION)
- TABLE 80. QATAR BELT TENSION METER MARKET SIZE, BY APPLICATION, 2018-2030 (USD MILLION)
- TABLE 81. RUSSIA BELT TENSION METER MARKET SIZE, BY TYPE, 2018-2030 (USD MILLION)
- TABLE 82. RUSSIA BELT TENSION METER MARKET SIZE, BY APPLICATION, 2018-2030 (USD MILLION)
- TABLE 83. SAUDI ARABIA BELT TENSION METER MARKET SIZE, BY TYPE, 2018-2030 (USD MILLION)
- TABLE 84. SAUDI ARABIA BELT TENSION METER MARKET SIZE, BY APPLICATION, 2018-2030 (USD MILLION)
- TABLE 85. SOUTH AFRICA BELT TENSION METER MARKET SIZE, BY TYPE, 2018-2030 (USD MILLION)
- TABLE 86. SOUTH AFRICA BELT TENSION METER MARKET SIZE, BY APPLICATION, 2018-2030 (USD MILLION)
- TABLE 87. SPAIN BELT TENSION METER MARKET SIZE, BY TYPE, 2018-2030 (USD MILLION)
- TABLE 88. SPAIN BELT TENSION METER MARKET SIZE, BY APPLICATION, 2018-2030 (USD MILLION)
- TABLE 89. SWEDEN BELT TENSION METER MARKET SIZE, BY TYPE, 2018-2030 (USD MILLION)
- TABLE 90. SWEDEN BELT TENSION METER MARKET SIZE, BY APPLICATION, 2018-2030 (USD MILLION)
- TABLE 91. SWITZERLAND BELT TENSION METER MARKET SIZE, BY TYPE, 2018-2030 (USD MILLION)
- TABLE 92. SWITZERLAND BELT TENSION METER MARKET SIZE, BY APPLICATION, 2018-2030 (USD MILLION)
- TABLE 93. TURKEY BELT TENSION METER MARKET SIZE, BY TYPE, 2018-2030 (USD MILLION)
- TABLE 94. TURKEY BELT TENSION METER MARKET SIZE, BY APPLICATION, 2018-2030 (USD MILLION)
- TABLE 95. UNITED ARAB EMIRATES BELT TENSION METER MARKET SIZE, BY TYPE, 2018-2030 (USD MILLION)
- TABLE 96. UNITED ARAB EMIRATES BELT TENSION METER MARKET SIZE, BY APPLICATION, 2018-2030 (USD MILLION)
- TABLE 97. UNITED KINGDOM BELT TENSION METER MARKET SIZE, BY TYPE, 2018-2030 (USD MILLION)
- TABLE 98. UNITED KINGDOM BELT TENSION METER MARKET SIZE, BY APPLICATION, 2018-2030 (USD MILLION)
- TABLE 99. BELT TENSION METER MARKET, FPNV POSITIONING MATRIX, 2023
- TABLE 100. BELT TENSION METER MARKET SHARE, BY KEY PLAYER, 2023
- TABLE 101. BELT TENSION METER MARKET LICENSE & PRICING

