


 |
市場調查報告書
商品編碼
1413861
汽車等速萬向節市場:依萬向節類型、推進力、車輛類型、通路分類-2024年至2030年全球預測Automotive Constant Velocity Joint Market by Joint Type (Ball Joints, Inboard / Outboard, Plunge Joints), Propulsion (Electric, HybrId, ICE), Vehicle Type, Distribution Channel - Global Forecast 2024-2030 |
||||||
※ 本網頁內容可能與最新版本有所差異。詳細情況請與我們聯繫。
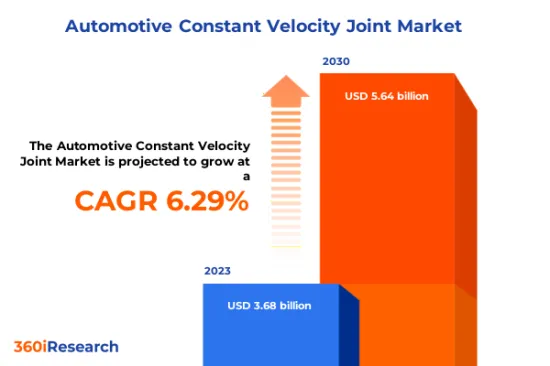
預計2023年汽車等速萬向節市場規模為36.8億美元,2024年達39億美元,2030年預計將達到56.4億美元,複合年成長率為6.29%。
全球汽車等速萬向節市場
| 主要市場統計 | |
|---|---|
| 基準年[2023] | 36.8億美元 |
| 預測年份 [2024] | 39億美元 |
| 預測年份 [2030] | 56.4億美元 |
| 複合年成長率(%) | 6.29% |
汽車等速萬向節(CV萬向節)是連接汽車變速箱和車輪的重要汽車零件。汽車等速萬向接頭是傳動軸的重要零件,主要應用於前輪驅動、後輪驅動和四輪驅動車輛。汽車的每個驅動輪都有兩個汽車CV萬向節:連接變速箱和車軸的內萬向節,以及連接車軸和車輪的外萬向節。汽車等速萬向接頭能夠隨著車輛懸吊向各個方向移動,同時保持驅動輪的速度恆定。近年來,隨著中等收入群體可支配收入的增加,汽車持有量迅速增加。因此,包括小客車和商用車在內的各類汽車的產量不斷擴大,對汽車等速萬向節產生了巨大的需求。此外,永續性議題是推動節能汽車等速萬向節需求的關鍵因素。然而,汽車等速萬向節很容易出現防護罩開裂和磨損的情況,因此這些零件需要經常維護和通訊協定。此外,技術和應用限制可能進一步阻礙該組件的普及。然而,主要參與企業正在尋求技術進步和整合輪驅動系統的開發,以提高車輛的操縱性和效率,並克服汽車等速萬向節的技術障礙。此外,電動車對汽車等速萬向節有不同的要求,以及人們對電動車日益成長的偏好,可以為該行業創造新的成長機會。
區域洞察
美洲,特別是美國和加拿大,擁有強大的汽車工業和技術架構,推動了汽車等速萬向節的需求和需求。汽車等速萬向節的持續技術進步和產品推出正在推動該領域的創新。歐洲的特點是存在與環境排放和永續性,這決定了汽車等速萬向節市場的需求。此區域板塊專注於生產先進的電動車等速萬向節,以滿足消費者對電動車的需求。亞太地區是重要的汽車零件製造地,中產階級人口不斷成長,為該行業提供了成長機會。中國、印度和韓國等經濟體中存在多家主要企業和供應商,為電動車、軍用車輛、特殊車輛和賽車等汽車等速萬向節創造了需求和成長環境。
FPNV定位矩陣
FPNV定位矩陣對於評估汽車等速萬向節市場至關重要。我們檢視與業務策略和產品滿意度相關的關鍵指標,以對供應商進行全面評估。這種深入的分析使用戶能夠根據自己的要求做出明智的決策。根據評估,供應商被分為四個成功程度不同的像限。最前線 (F)、探路者 (P)、利基 (N) 和重要 (V)。
市場佔有率分析
市場佔有率分析是一種綜合工具,可以對汽車等速萬向節市場供應商的現狀進行深入而深入的研究。全面比較和分析供應商在整體收益、基本客群和其他關鍵指標方面的貢獻,以便更好地了解公司的績效及其在爭奪市場佔有率時面臨的挑戰。此外,該分析還提供了對該行業競爭特徵的寶貴考察,包括在研究基準年觀察到的累積、分散主導地位和合併特徵等因素。這種詳細程度的提高使供應商能夠做出更明智的決策並制定有效的策略,從而在市場上獲得競爭優勢。
該報告對以下幾個方面提供了寶貴的見解:
1-市場滲透率:提供有關主要企業所服務的市場的全面資訊。
2-市場開拓:我們深入研究利潤豐厚的新興市場,並分析它們在成熟細分市場中的滲透率。
3- 市場多元化:提供有關新產品發布、開拓地區、最新發展和投資的詳細資訊。
4-競爭力評估與資訊:對主要企業的市場佔有率、策略、產品、認證、監管狀況、專利狀況、製造能力等進行全面評估。
5- 產品開發與創新:提供對未來技術、研發活動和突破性產品開發的見解。
本報告解決了以下關鍵問題:
1-汽車等速萬向節市場的市場規模與預測是多少?
2-在汽車等速萬向節市場預測期內,有哪些產品、細分市場、應用和領域需要考慮投資?
3-汽車等速萬向節市場的技術趨勢和法律規範是什麼?
4-汽車等速萬向節市場主要廠商的市場佔有率是多少?
5-進入汽車等速萬向節市場合適的型態和策略手段是什麼?
目錄
第1章 前言
第2章調查方法
第3章執行摘要
第4章市場概況
第5章市場洞察
- 市場動態
- 促進因素
- 世界各地的汽車持有率不斷上升,汽車產量不斷擴大。
- 車輛需要緊湊、節能的組件
- 抑制因素
- 汽車等速萬向接頭可能磨損和損壞
- 機會
- 進步提高了汽車等速萬向節的性能和效率
- 電動車 (EV) 等速萬向節的需求
- 任務
- 汽車等速萬向節的技術限制
- 促進因素
- 市場區隔分析
- 接頭類型:由於輕量化設計,更多採用插入式接頭
- 車輛類型:由於持有支配所得增加,小客車保有量不斷增加
- 推進:首選電力推進來解決永續性問題
- 分銷管道:由於成本效益和易於獲取,售後市場分銷管道成為趨勢
- 市場趨勢分析
- 高通膨的累積效應
- 波特五力分析
- 價值鍊和關鍵路徑分析
- 法律規範
第6章汽車等速萬向節市場:依萬向節型分類
- 介紹
- 球接頭
- 內側/外側
- 插接接頭
- 澤帕聯合
- 三腳架接頭
第7章 汽車等速萬向節市場:依推進力分類
- 介紹
- 電
- 混合
- ICE
第8章汽車等速萬向節市場:依車型分類
- 介紹
- 大型商用車
- 輕型商用車
- 小客車
第9章汽車等速萬向節市場:依通路分類
- 介紹
- 售後市場
- OEM
第10章 北美、南美汽車等速萬向節市場
- 介紹
- 阿根廷
- 巴西
- 加拿大
- 墨西哥
- 美國
第11章亞太汽車等速萬向節市場
- 介紹
- 澳洲
- 中國
- 印度
- 印尼
- 日本
- 馬來西亞
- 菲律賓
- 新加坡
- 韓國
- 台灣
- 泰國
- 越南
第12章歐洲、中東、非洲汽車等速萬向節市場
- 介紹
- 丹麥
- 埃及
- 芬蘭
- 法國
- 德國
- 以色列
- 義大利
- 荷蘭
- 奈及利亞
- 挪威
- 波蘭
- 卡達
- 俄羅斯
- 沙烏地阿拉伯
- 南非
- 西班牙
- 瑞典
- 瑞士
- 土耳其
- 阿拉伯聯合大公國
- 英國
第13章競爭形勢
- FPNV定位矩陣
- 市場佔有率分析:主要企業
- 主要企業競爭情境分析
- 新產品發布和功能增強
第14章競爭產品組合
- 主要公司簡介
- AIKOKU ALPHA
- American Axle & Manufacturing, Inc.
- Anand Auto Corporation
- Comer Industries Spa
- Dana Inc.
- EMAG GmbH & Co. KG
- FBAxles Pvt. Ltd.
- GKN Automotive Limited
- GSP Automotive Group Wenzhou Co. Ltd.
- Hartford Technologies, Inc.
- Hyundai WIA Corporation
- IFA Group
- IPD GmbH
- Kalyani Mobility Drivelines
- Nanyang Automobile & Cycle Group
- Nexteer Automotive Group Ltd.
- NKN LTD
- NTN Corporation
- Rockford Constant Velocity
- Seohan Group
- Shandong Carfree Auto Fittings CO., LTD
- SKF
- Taizhou Hongli Automobile Parts Co., Ltd.
- The Rowland Company
- Universal Engineers
- Walterscheid Powertrain Group
- Wanxiang Qianchao Co. Ltd.
- WONH Industries co, ltd.
- 主要產品系列
第15章附錄
- 討論指南
- 關於許可證和定價
[190 Pages Report] The Automotive Constant Velocity Joint Market size was estimated at USD 3.68 billion in 2023 and expected to reach USD 3.90 billion in 2024, at a CAGR 6.29% to reach USD 5.64 billion by 2030.
Global Automotive Constant Velocity Joint Market
| KEY MARKET STATISTICS | |
|---|---|
| Base Year [2023] | USD 3.68 billion |
| Estimated Year [2024] | USD 3.90 billion |
| Forecast Year [2030] | USD 5.64 billion |
| CAGR (%) | 6.29% |
Automotive constant velocity, or CV, joints are crucial automotive components that connect the vehicle's transmission to its wheels. Automotive CV joints are an important part of the driveshaft, used primarily in front-wheel drive vehicles, as well as rear- and four-wheel drive vehicles. Each drive wheel in a vehicle has two automotive CV joints, including the inner joint, which connects the transmission to the vehicle's axle, and the outer joint, which connects the axle to the wheel. The automotive CV joint is equipped with the ability to move along with the vehicle's suspension in any direction while maintaining the drive wheels at a constant velocity. Recent years have seen a rapid increase in ownership of vehicles due to growing disposable incomes among middle-class consumers. Consequently, the expanding production of various types of automobiles, such as passenger and commercial vehicles, has created a significant demand for automotive CV joints. Furthermore, sustainability concerns have become a pivotal factor driving the need for energy-efficient automotive CV joints. However, due to the possibility of protective boot cracks and wear and tear of automotive CV joints, the components need frequent maintenance and lubrication protocols. Additionally, technical and application constraints can further impede the widespread adoption of the components. However, key players are exploring technological advancements and the development of integrated wheel drive systems to improve the mobility and efficiency of automobiles and overcome technical hurdles of automotive CV joints. Additionally, electric vehicles, which have different requirements for automotive CV joints and the growing preference for EVs, can create new growth opportunities for the industry.
Regional Insights
The Americas region, particularly the US and Canada, is comprised of a robust automotive industry and technological architecture, which drives the need and demand for automotive CV joints. Constant technological advancements and product launches of automotive CV joints have facilitated innovations in the field. Europe is characterized by the presence of several stringent guidelines and regulations pertaining to environmental emissions and sustainability, which shapes the market demand for automotive CV Joints. Plates in this region are focusing on producing advanced automotive CV joints for electric vehicles to cater to consumer demand for EVs. APAC's position as a manufacturing hub for crucial automotive components and the presence of a growing middle-class population provide opportunities for the growth of the industry. The presence of several key players and suppliers in economies such as China, India, and South Korea creates an environment of growth and a need for automotive CV joints for EVs and military, specialty, and motorsports vehicles.
FPNV Positioning Matrix
The FPNV Positioning Matrix is pivotal in evaluating the Automotive Constant Velocity Joint Market. It offers a comprehensive assessment of vendors, examining key metrics related to Business Strategy and Product Satisfaction. This in-depth analysis empowers users to make well-informed decisions aligned with their requirements. Based on the evaluation, the vendors are then categorized into four distinct quadrants representing varying levels of success: Forefront (F), Pathfinder (P), Niche (N), or Vital (V).
Market Share Analysis
The Market Share Analysis is a comprehensive tool that provides an insightful and in-depth examination of the current state of vendors in the Automotive Constant Velocity Joint Market. By meticulously comparing and analyzing vendor contributions in terms of overall revenue, customer base, and other key metrics, we can offer companies a greater understanding of their performance and the challenges they face when competing for market share. Additionally, this analysis provides valuable insights into the competitive nature of the sector, including factors such as accumulation, fragmentation dominance, and amalgamation traits observed over the base year period studied. With this expanded level of detail, vendors can make more informed decisions and devise effective strategies to gain a competitive edge in the market.
Key Company Profiles
The report delves into recent significant developments in the Automotive Constant Velocity Joint Market, highlighting leading vendors and their innovative profiles. These include AIKOKU ALPHA, American Axle & Manufacturing, Inc., Anand Auto Corporation, Comer Industries Spa, Dana Inc., EMAG GmbH & Co. KG, F.B.Axles Pvt. Ltd., GKN Automotive Limited, GSP Automotive Group Wenzhou Co. Ltd., Hartford Technologies, Inc., Hyundai WIA Corporation, IFA Group, IPD GmbH, Kalyani Mobility Drivelines, Nanyang Automobile & Cycle Group, Nexteer Automotive Group Ltd., NKN LTD, NTN Corporation, Rockford Constant Velocity, Seohan Group, Shandong Carfree Auto Fittings CO., LTD, SKF, Taizhou Hongli Automobile Parts Co., Ltd., The Rowland Company, Universal Engineers, Walterscheid Powertrain Group, Wanxiang Qianchao Co. Ltd., and WONH Industries co, ltd..
Market Segmentation & Coverage
This research report categorizes the Automotive Constant Velocity Joint Market to forecast the revenues and analyze trends in each of the following sub-markets:
- Joint Type
- Ball Joints
- Inboard / Outboard
- Plunge Joints
- Rzeppa Joints
- Tripod Joints
- Propulsion
- Electric
- HybrId
- ICE
- Vehicle Type
- Heavy Commercial Vehicle
- Light Commercial Vehicle
- Passenger Car
- Distribution Channel
- Aftermarket
- OEM
- Region
- Americas
- Argentina
- Brazil
- Canada
- Mexico
- United States
- California
- Florida
- Illinois
- New York
- Ohio
- Pennsylvania
- Texas
- Asia-Pacific
- Australia
- China
- India
- Indonesia
- Japan
- Malaysia
- Philippines
- Singapore
- South Korea
- Taiwan
- Thailand
- Vietnam
- Europe, Middle East & Africa
- Denmark
- Egypt
- Finland
- France
- Germany
- Israel
- Italy
- Netherlands
- Nigeria
- Norway
- Poland
- Qatar
- Russia
- Saudi Arabia
- South Africa
- Spain
- Sweden
- Switzerland
- Turkey
- United Arab Emirates
- United Kingdom
- Americas
The report offers valuable insights on the following aspects:
1. Market Penetration: It presents comprehensive information on the market provided by key players.
2. Market Development: It delves deep into lucrative emerging markets and analyzes the penetration across mature market segments.
3. Market Diversification: It provides detailed information on new product launches, untapped geographic regions, recent developments, and investments.
4. Competitive Assessment & Intelligence: It conducts an exhaustive assessment of market shares, strategies, products, certifications, regulatory approvals, patent landscape, and manufacturing capabilities of the leading players.
5. Product Development & Innovation: It offers intelligent insights on future technologies, R&D activities, and breakthrough product developments.
The report addresses key questions such as:
1. What is the market size and forecast of the Automotive Constant Velocity Joint Market?
2. Which products, segments, applications, and areas should one consider investing in over the forecast period in the Automotive Constant Velocity Joint Market?
3. What are the technology trends and regulatory frameworks in the Automotive Constant Velocity Joint Market?
4. What is the market share of the leading vendors in the Automotive Constant Velocity Joint Market?
5. Which modes and strategic moves are suitable for entering the Automotive Constant Velocity Joint Market?
Table of Contents
1. Preface
- 1.1. Objectives of the Study
- 1.2. Market Segmentation & Coverage
- 1.3. Years Considered for the Study
- 1.4. Currency & Pricing
- 1.5. Language
- 1.6. Limitations
- 1.7. Assumptions
- 1.8. Stakeholders
2. Research Methodology
- 2.1. Define: Research Objective
- 2.2. Determine: Research Design
- 2.3. Prepare: Research Instrument
- 2.4. Collect: Data Source
- 2.5. Analyze: Data Interpretation
- 2.6. Formulate: Data Verification
- 2.7. Publish: Research Report
- 2.8. Repeat: Report Update
3. Executive Summary
4. Market Overview
- 4.1. Introduction
- 4.2. Automotive Constant Velocity Joint Market, by Region
5. Market Insights
- 5.1. Market Dynamics
- 5.1.1. Drivers
- 5.1.1.1. Rising vehicle ownership and expanding production of automobiles across the world
- 5.1.1.2. Need for compact and energy-efficient components in vehicles
- 5.1.2. Restraints
- 5.1.2.1. Possibility of wear and tear and damage to the automotive constant velocity joints
- 5.1.3. Opportunities
- 5.1.3.1. Advancements to improve the performance and efficiency of automotive constant velocity joints
- 5.1.3.2. Demand for automotive constant velocity joints for electric vehicles(EV)
- 5.1.4. Challenges
- 5.1.4.1. Technical constraints of automotive constant velocity joints
- 5.1.1. Drivers
- 5.2. Market Segmentation Analysis
- 5.2.1. Joint Type: Growing adoption of plunge joints due to their lightweight design
- 5.2.2. Vehicle Type: Growing ownership of passenger cars due to rising disposable incomes
- 5.2.3. Propulsion: Preference for electric propulsion to tackle sustainability concerns
- 5.2.4. Distribution Channel: Inclination towards aftermarket distribution channel due to its cost-effectiveness and easy availability
- 5.3. Market Trend Analysis
- 5.4. Cumulative Impact of High Inflation
- 5.5. Porter's Five Forces Analysis
- 5.5.1. Threat of New Entrants
- 5.5.2. Threat of Substitutes
- 5.5.3. Bargaining Power of Customers
- 5.5.4. Bargaining Power of Suppliers
- 5.5.5. Industry Rivalry
- 5.6. Value Chain & Critical Path Analysis
- 5.7. Regulatory Framework
6. Automotive Constant Velocity Joint Market, by Joint Type
- 6.1. Introduction
- 6.2. Ball Joints
- 6.3. Inboard / Outboard
- 6.4. Plunge Joints
- 6.5. Rzeppa Joints
- 6.6. Tripod Joints
7. Automotive Constant Velocity Joint Market, by Propulsion
- 7.1. Introduction
- 7.2. Electric
- 7.3. HybrId
- 7.4. ICE
8. Automotive Constant Velocity Joint Market, by Vehicle Type
- 8.1. Introduction
- 8.2. Heavy Commercial Vehicle
- 8.3. Light Commercial Vehicle
- 8.4. Passenger Car
9. Automotive Constant Velocity Joint Market, by Distribution Channel
- 9.1. Introduction
- 9.2. Aftermarket
- 9.3. OEM
10. Americas Automotive Constant Velocity Joint Market
- 10.1. Introduction
- 10.2. Argentina
- 10.3. Brazil
- 10.4. Canada
- 10.5. Mexico
- 10.6. United States
11. Asia-Pacific Automotive Constant Velocity Joint Market
- 11.1. Introduction
- 11.2. Australia
- 11.3. China
- 11.4. India
- 11.5. Indonesia
- 11.6. Japan
- 11.7. Malaysia
- 11.8. Philippines
- 11.9. Singapore
- 11.10. South Korea
- 11.11. Taiwan
- 11.12. Thailand
- 11.13. Vietnam
12. Europe, Middle East & Africa Automotive Constant Velocity Joint Market
- 12.1. Introduction
- 12.2. Denmark
- 12.3. Egypt
- 12.4. Finland
- 12.5. France
- 12.6. Germany
- 12.7. Israel
- 12.8. Italy
- 12.9. Netherlands
- 12.10. Nigeria
- 12.11. Norway
- 12.12. Poland
- 12.13. Qatar
- 12.14. Russia
- 12.15. Saudi Arabia
- 12.16. South Africa
- 12.17. Spain
- 12.18. Sweden
- 12.19. Switzerland
- 12.20. Turkey
- 12.21. United Arab Emirates
- 12.22. United Kingdom
13. Competitive Landscape
- 13.1. FPNV Positioning Matrix
- 13.2. Market Share Analysis, By Key Player
- 13.3. Competitive Scenario Analysis, By Key Player
- 13.3.1. New Product Launch & Enhancement
- 13.3.1.1. Mark Williams Ent. Expands Into EV Driveline Products
- 13.3.1.2. First Line launches CV joint and driveshaft ranges
- 13.3.1. New Product Launch & Enhancement
14. Competitive Portfolio
- 14.1. Key Company Profiles
- 14.1.1. AIKOKU ALPHA
- 14.1.2. American Axle & Manufacturing, Inc.
- 14.1.3. Anand Auto Corporation
- 14.1.4. Comer Industries Spa
- 14.1.5. Dana Inc.
- 14.1.6. EMAG GmbH & Co. KG
- 14.1.7. F.B.Axles Pvt. Ltd.
- 14.1.8. GKN Automotive Limited
- 14.1.9. GSP Automotive Group Wenzhou Co. Ltd.
- 14.1.10. Hartford Technologies, Inc.
- 14.1.11. Hyundai WIA Corporation
- 14.1.12. IFA Group
- 14.1.13. IPD GmbH
- 14.1.14. Kalyani Mobility Drivelines
- 14.1.15. Nanyang Automobile & Cycle Group
- 14.1.16. Nexteer Automotive Group Ltd.
- 14.1.17. NKN LTD
- 14.1.18. NTN Corporation
- 14.1.19. Rockford Constant Velocity
- 14.1.20. Seohan Group
- 14.1.21. Shandong Carfree Auto Fittings CO., LTD
- 14.1.22. SKF
- 14.1.23. Taizhou Hongli Automobile Parts Co., Ltd.
- 14.1.24. The Rowland Company
- 14.1.25. Universal Engineers
- 14.1.26. Walterscheid Powertrain Group
- 14.1.27. Wanxiang Qianchao Co. Ltd.
- 14.1.28. WONH Industries co, ltd.
- 14.2. Key Product Portfolio
15. Appendix
- 15.1. Discussion Guide
- 15.2. License & Pricing
LIST OF FIGURES
- FIGURE 1. AUTOMOTIVE CONSTANT VELOCITY JOINT MARKET RESEARCH PROCESS
- FIGURE 2. AUTOMOTIVE CONSTANT VELOCITY JOINT MARKET SIZE, 2023 VS 2030
- FIGURE 3. AUTOMOTIVE CONSTANT VELOCITY JOINT MARKET SIZE, 2018-2030 (USD MILLION)
- FIGURE 4. AUTOMOTIVE CONSTANT VELOCITY JOINT MARKET SIZE, BY REGION, 2023 VS 2030 (%)
- FIGURE 5. AUTOMOTIVE CONSTANT VELOCITY JOINT MARKET SIZE, BY REGION, 2023 VS 2024 VS 2030 (USD MILLION)
- FIGURE 6. AUTOMOTIVE CONSTANT VELOCITY JOINT MARKET DYNAMICS
- FIGURE 7. AUTOMOTIVE CONSTANT VELOCITY JOINT MARKET SIZE, BY JOINT TYPE, 2023 VS 2030 (%)
- FIGURE 8. AUTOMOTIVE CONSTANT VELOCITY JOINT MARKET SIZE, BY JOINT TYPE, 2023 VS 2024 VS 2030 (USD MILLION)
- FIGURE 9. AUTOMOTIVE CONSTANT VELOCITY JOINT MARKET SIZE, BY PROPULSION, 2023 VS 2030 (%)
- FIGURE 10. AUTOMOTIVE CONSTANT VELOCITY JOINT MARKET SIZE, BY PROPULSION, 2023 VS 2024 VS 2030 (USD MILLION)
- FIGURE 11. AUTOMOTIVE CONSTANT VELOCITY JOINT MARKET SIZE, BY VEHICLE TYPE, 2023 VS 2030 (%)
- FIGURE 12. AUTOMOTIVE CONSTANT VELOCITY JOINT MARKET SIZE, BY VEHICLE TYPE, 2023 VS 2024 VS 2030 (USD MILLION)
- FIGURE 13. AUTOMOTIVE CONSTANT VELOCITY JOINT MARKET SIZE, BY DISTRIBUTION CHANNEL, 2023 VS 2030 (%)
- FIGURE 14. AUTOMOTIVE CONSTANT VELOCITY JOINT MARKET SIZE, BY DISTRIBUTION CHANNEL, 2023 VS 2024 VS 2030 (USD MILLION)
- FIGURE 15. AMERICAS AUTOMOTIVE CONSTANT VELOCITY JOINT MARKET SIZE, BY COUNTRY, 2023 VS 2030 (%)
- FIGURE 16. AMERICAS AUTOMOTIVE CONSTANT VELOCITY JOINT MARKET SIZE, BY COUNTRY, 2023 VS 2024 VS 2030 (USD MILLION)
- FIGURE 17. UNITED STATES AUTOMOTIVE CONSTANT VELOCITY JOINT MARKET SIZE, BY STATE, 2023 VS 2030 (%)
- FIGURE 18. UNITED STATES AUTOMOTIVE CONSTANT VELOCITY JOINT MARKET SIZE, BY STATE, 2023 VS 2024 VS 2030 (USD MILLION)
- FIGURE 19. ASIA-PACIFIC AUTOMOTIVE CONSTANT VELOCITY JOINT MARKET SIZE, BY COUNTRY, 2023 VS 2030 (%)
- FIGURE 20. ASIA-PACIFIC AUTOMOTIVE CONSTANT VELOCITY JOINT MARKET SIZE, BY COUNTRY, 2023 VS 2024 VS 2030 (USD MILLION)
- FIGURE 21. EUROPE, MIDDLE EAST & AFRICA AUTOMOTIVE CONSTANT VELOCITY JOINT MARKET SIZE, BY COUNTRY, 2023 VS 2030 (%)
- FIGURE 22. EUROPE, MIDDLE EAST & AFRICA AUTOMOTIVE CONSTANT VELOCITY JOINT MARKET SIZE, BY COUNTRY, 2023 VS 2024 VS 2030 (USD MILLION)
- FIGURE 23. AUTOMOTIVE CONSTANT VELOCITY JOINT MARKET, FPNV POSITIONING MATRIX, 2023
- FIGURE 24. AUTOMOTIVE CONSTANT VELOCITY JOINT MARKET SHARE, BY KEY PLAYER, 2023
LIST OF TABLES
- TABLE 1. AUTOMOTIVE CONSTANT VELOCITY JOINT MARKET SEGMENTATION & COVERAGE
- TABLE 2. UNITED STATES DOLLAR EXCHANGE RATE, 2018-2023
- TABLE 3. AUTOMOTIVE CONSTANT VELOCITY JOINT MARKET SIZE, 2018-2030 (USD MILLION)
- TABLE 4. GLOBAL AUTOMOTIVE CONSTANT VELOCITY JOINT MARKET SIZE, BY REGION, 2018-2030 (USD MILLION)
- TABLE 5. AUTOMOTIVE CONSTANT VELOCITY JOINT MARKET SIZE, BY JOINT TYPE, 2018-2030 (USD MILLION)
- TABLE 6. AUTOMOTIVE CONSTANT VELOCITY JOINT MARKET SIZE, BY BALL JOINTS, BY REGION, 2018-2030 (USD MILLION)
- TABLE 7. AUTOMOTIVE CONSTANT VELOCITY JOINT MARKET SIZE, BY INBOARD / OUTBOARD, BY REGION, 2018-2030 (USD MILLION)
- TABLE 8. AUTOMOTIVE CONSTANT VELOCITY JOINT MARKET SIZE, BY PLUNGE JOINTS, BY REGION, 2018-2030 (USD MILLION)
- TABLE 9. AUTOMOTIVE CONSTANT VELOCITY JOINT MARKET SIZE, BY RZEPPA JOINTS, BY REGION, 2018-2030 (USD MILLION)
- TABLE 10. AUTOMOTIVE CONSTANT VELOCITY JOINT MARKET SIZE, BY TRIPOD JOINTS, BY REGION, 2018-2030 (USD MILLION)
- TABLE 11. AUTOMOTIVE CONSTANT VELOCITY JOINT MARKET SIZE, BY PROPULSION, 2018-2030 (USD MILLION)
- TABLE 12. AUTOMOTIVE CONSTANT VELOCITY JOINT MARKET SIZE, BY ELECTRIC, BY REGION, 2018-2030 (USD MILLION)
- TABLE 13. AUTOMOTIVE CONSTANT VELOCITY JOINT MARKET SIZE, BY HYBRID, BY REGION, 2018-2030 (USD MILLION)
- TABLE 14. AUTOMOTIVE CONSTANT VELOCITY JOINT MARKET SIZE, BY ICE, BY REGION, 2018-2030 (USD MILLION)
- TABLE 15. AUTOMOTIVE CONSTANT VELOCITY JOINT MARKET SIZE, BY VEHICLE TYPE, 2018-2030 (USD MILLION)
- TABLE 16. AUTOMOTIVE CONSTANT VELOCITY JOINT MARKET SIZE, BY HEAVY COMMERCIAL VEHICLE, BY REGION, 2018-2030 (USD MILLION)
- TABLE 17. AUTOMOTIVE CONSTANT VELOCITY JOINT MARKET SIZE, BY LIGHT COMMERCIAL VEHICLE, BY REGION, 2018-2030 (USD MILLION)
- TABLE 18. AUTOMOTIVE CONSTANT VELOCITY JOINT MARKET SIZE, BY PASSENGER CAR, BY REGION, 2018-2030 (USD MILLION)
- TABLE 19. AUTOMOTIVE CONSTANT VELOCITY JOINT MARKET SIZE, BY DISTRIBUTION CHANNEL, 2018-2030 (USD MILLION)
- TABLE 20. AUTOMOTIVE CONSTANT VELOCITY JOINT MARKET SIZE, BY AFTERMARKET, BY REGION, 2018-2030 (USD MILLION)
- TABLE 21. AUTOMOTIVE CONSTANT VELOCITY JOINT MARKET SIZE, BY OEM, BY REGION, 2018-2030 (USD MILLION)
- TABLE 22. AMERICAS AUTOMOTIVE CONSTANT VELOCITY JOINT MARKET SIZE, BY JOINT TYPE, 2018-2030 (USD MILLION)
- TABLE 23. AMERICAS AUTOMOTIVE CONSTANT VELOCITY JOINT MARKET SIZE, BY PROPULSION, 2018-2030 (USD MILLION)
- TABLE 24. AMERICAS AUTOMOTIVE CONSTANT VELOCITY JOINT MARKET SIZE, BY VEHICLE TYPE, 2018-2030 (USD MILLION)
- TABLE 25. AMERICAS AUTOMOTIVE CONSTANT VELOCITY JOINT MARKET SIZE, BY DISTRIBUTION CHANNEL, 2018-2030 (USD MILLION)
- TABLE 26. AMERICAS AUTOMOTIVE CONSTANT VELOCITY JOINT MARKET SIZE, BY COUNTRY, 2018-2030 (USD MILLION)
- TABLE 27. ARGENTINA AUTOMOTIVE CONSTANT VELOCITY JOINT MARKET SIZE, BY JOINT TYPE, 2018-2030 (USD MILLION)
- TABLE 28. ARGENTINA AUTOMOTIVE CONSTANT VELOCITY JOINT MARKET SIZE, BY PROPULSION, 2018-2030 (USD MILLION)
- TABLE 29. ARGENTINA AUTOMOTIVE CONSTANT VELOCITY JOINT MARKET SIZE, BY VEHICLE TYPE, 2018-2030 (USD MILLION)
- TABLE 30. ARGENTINA AUTOMOTIVE CONSTANT VELOCITY JOINT MARKET SIZE, BY DISTRIBUTION CHANNEL, 2018-2030 (USD MILLION)
- TABLE 31. BRAZIL AUTOMOTIVE CONSTANT VELOCITY JOINT MARKET SIZE, BY JOINT TYPE, 2018-2030 (USD MILLION)
- TABLE 32. BRAZIL AUTOMOTIVE CONSTANT VELOCITY JOINT MARKET SIZE, BY PROPULSION, 2018-2030 (USD MILLION)
- TABLE 33. BRAZIL AUTOMOTIVE CONSTANT VELOCITY JOINT MARKET SIZE, BY VEHICLE TYPE, 2018-2030 (USD MILLION)
- TABLE 34. BRAZIL AUTOMOTIVE CONSTANT VELOCITY JOINT MARKET SIZE, BY DISTRIBUTION CHANNEL, 2018-2030 (USD MILLION)
- TABLE 35. CANADA AUTOMOTIVE CONSTANT VELOCITY JOINT MARKET SIZE, BY JOINT TYPE, 2018-2030 (USD MILLION)
- TABLE 36. CANADA AUTOMOTIVE CONSTANT VELOCITY JOINT MARKET SIZE, BY PROPULSION, 2018-2030 (USD MILLION)
- TABLE 37. CANADA AUTOMOTIVE CONSTANT VELOCITY JOINT MARKET SIZE, BY VEHICLE TYPE, 2018-2030 (USD MILLION)
- TABLE 38. CANADA AUTOMOTIVE CONSTANT VELOCITY JOINT MARKET SIZE, BY DISTRIBUTION CHANNEL, 2018-2030 (USD MILLION)
- TABLE 39. MEXICO AUTOMOTIVE CONSTANT VELOCITY JOINT MARKET SIZE, BY JOINT TYPE, 2018-2030 (USD MILLION)
- TABLE 40. MEXICO AUTOMOTIVE CONSTANT VELOCITY JOINT MARKET SIZE, BY PROPULSION, 2018-2030 (USD MILLION)
- TABLE 41. MEXICO AUTOMOTIVE CONSTANT VELOCITY JOINT MARKET SIZE, BY VEHICLE TYPE, 2018-2030 (USD MILLION)
- TABLE 42. MEXICO AUTOMOTIVE CONSTANT VELOCITY JOINT MARKET SIZE, BY DISTRIBUTION CHANNEL, 2018-2030 (USD MILLION)
- TABLE 43. UNITED STATES AUTOMOTIVE CONSTANT VELOCITY JOINT MARKET SIZE, BY JOINT TYPE, 2018-2030 (USD MILLION)
- TABLE 44. UNITED STATES AUTOMOTIVE CONSTANT VELOCITY JOINT MARKET SIZE, BY PROPULSION, 2018-2030 (USD MILLION)
- TABLE 45. UNITED STATES AUTOMOTIVE CONSTANT VELOCITY JOINT MARKET SIZE, BY VEHICLE TYPE, 2018-2030 (USD MILLION)
- TABLE 46. UNITED STATES AUTOMOTIVE CONSTANT VELOCITY JOINT MARKET SIZE, BY DISTRIBUTION CHANNEL, 2018-2030 (USD MILLION)
- TABLE 47. UNITED STATES AUTOMOTIVE CONSTANT VELOCITY JOINT MARKET SIZE, BY STATE, 2018-2030 (USD MILLION)
- TABLE 48. ASIA-PACIFIC AUTOMOTIVE CONSTANT VELOCITY JOINT MARKET SIZE, BY JOINT TYPE, 2018-2030 (USD MILLION)
- TABLE 49. ASIA-PACIFIC AUTOMOTIVE CONSTANT VELOCITY JOINT MARKET SIZE, BY PROPULSION, 2018-2030 (USD MILLION)
- TABLE 50. ASIA-PACIFIC AUTOMOTIVE CONSTANT VELOCITY JOINT MARKET SIZE, BY VEHICLE TYPE, 2018-2030 (USD MILLION)
- TABLE 51. ASIA-PACIFIC AUTOMOTIVE CONSTANT VELOCITY JOINT MARKET SIZE, BY DISTRIBUTION CHANNEL, 2018-2030 (USD MILLION)
- TABLE 52. ASIA-PACIFIC AUTOMOTIVE CONSTANT VELOCITY JOINT MARKET SIZE, BY COUNTRY, 2018-2030 (USD MILLION)
- TABLE 53. AUSTRALIA AUTOMOTIVE CONSTANT VELOCITY JOINT MARKET SIZE, BY JOINT TYPE, 2018-2030 (USD MILLION)
- TABLE 54. AUSTRALIA AUTOMOTIVE CONSTANT VELOCITY JOINT MARKET SIZE, BY PROPULSION, 2018-2030 (USD MILLION)
- TABLE 55. AUSTRALIA AUTOMOTIVE CONSTANT VELOCITY JOINT MARKET SIZE, BY VEHICLE TYPE, 2018-2030 (USD MILLION)
- TABLE 56. AUSTRALIA AUTOMOTIVE CONSTANT VELOCITY JOINT MARKET SIZE, BY DISTRIBUTION CHANNEL, 2018-2030 (USD MILLION)
- TABLE 57. CHINA AUTOMOTIVE CONSTANT VELOCITY JOINT MARKET SIZE, BY JOINT TYPE, 2018-2030 (USD MILLION)
- TABLE 58. CHINA AUTOMOTIVE CONSTANT VELOCITY JOINT MARKET SIZE, BY PROPULSION, 2018-2030 (USD MILLION)
- TABLE 59. CHINA AUTOMOTIVE CONSTANT VELOCITY JOINT MARKET SIZE, BY VEHICLE TYPE, 2018-2030 (USD MILLION)
- TABLE 60. CHINA AUTOMOTIVE CONSTANT VELOCITY JOINT MARKET SIZE, BY DISTRIBUTION CHANNEL, 2018-2030 (USD MILLION)
- TABLE 61. INDIA AUTOMOTIVE CONSTANT VELOCITY JOINT MARKET SIZE, BY JOINT TYPE, 2018-2030 (USD MILLION)
- TABLE 62. INDIA AUTOMOTIVE CONSTANT VELOCITY JOINT MARKET SIZE, BY PROPULSION, 2018-2030 (USD MILLION)
- TABLE 63. INDIA AUTOMOTIVE CONSTANT VELOCITY JOINT MARKET SIZE, BY VEHICLE TYPE, 2018-2030 (USD MILLION)
- TABLE 64. INDIA AUTOMOTIVE CONSTANT VELOCITY JOINT MARKET SIZE, BY DISTRIBUTION CHANNEL, 2018-2030 (USD MILLION)
- TABLE 65. INDONESIA AUTOMOTIVE CONSTANT VELOCITY JOINT MARKET SIZE, BY JOINT TYPE, 2018-2030 (USD MILLION)
- TABLE 66. INDONESIA AUTOMOTIVE CONSTANT VELOCITY JOINT MARKET SIZE, BY PROPULSION, 2018-2030 (USD MILLION)
- TABLE 67. INDONESIA AUTOMOTIVE CONSTANT VELOCITY JOINT MARKET SIZE, BY VEHICLE TYPE, 2018-2030 (USD MILLION)
- TABLE 68. INDONESIA AUTOMOTIVE CONSTANT VELOCITY JOINT MARKET SIZE, BY DISTRIBUTION CHANNEL, 2018-2030 (USD MILLION)
- TABLE 69. JAPAN AUTOMOTIVE CONSTANT VELOCITY JOINT MARKET SIZE, BY JOINT TYPE, 2018-2030 (USD MILLION)
- TABLE 70. JAPAN AUTOMOTIVE CONSTANT VELOCITY JOINT MARKET SIZE, BY PROPULSION, 2018-2030 (USD MILLION)
- TABLE 71. JAPAN AUTOMOTIVE CONSTANT VELOCITY JOINT MARKET SIZE, BY VEHICLE TYPE, 2018-2030 (USD MILLION)
- TABLE 72. JAPAN AUTOMOTIVE CONSTANT VELOCITY JOINT MARKET SIZE, BY DISTRIBUTION CHANNEL, 2018-2030 (USD MILLION)
- TABLE 73. MALAYSIA AUTOMOTIVE CONSTANT VELOCITY JOINT MARKET SIZE, BY JOINT TYPE, 2018-2030 (USD MILLION)
- TABLE 74. MALAYSIA AUTOMOTIVE CONSTANT VELOCITY JOINT MARKET SIZE, BY PROPULSION, 2018-2030 (USD MILLION)
- TABLE 75. MALAYSIA AUTOMOTIVE CONSTANT VELOCITY JOINT MARKET SIZE, BY VEHICLE TYPE, 2018-2030 (USD MILLION)
- TABLE 76. MALAYSIA AUTOMOTIVE CONSTANT VELOCITY JOINT MARKET SIZE, BY DISTRIBUTION CHANNEL, 2018-2030 (USD MILLION)
- TABLE 77. PHILIPPINES AUTOMOTIVE CONSTANT VELOCITY JOINT MARKET SIZE, BY JOINT TYPE, 2018-2030 (USD MILLION)
- TABLE 78. PHILIPPINES AUTOMOTIVE CONSTANT VELOCITY JOINT MARKET SIZE, BY PROPULSION, 2018-2030 (USD MILLION)
- TABLE 79. PHILIPPINES AUTOMOTIVE CONSTANT VELOCITY JOINT MARKET SIZE, BY VEHICLE TYPE, 2018-2030 (USD MILLION)
- TABLE 80. PHILIPPINES AUTOMOTIVE CONSTANT VELOCITY JOINT MARKET SIZE, BY DISTRIBUTION CHANNEL, 2018-2030 (USD MILLION)
- TABLE 81. SINGAPORE AUTOMOTIVE CONSTANT VELOCITY JOINT MARKET SIZE, BY JOINT TYPE, 2018-2030 (USD MILLION)
- TABLE 82. SINGAPORE AUTOMOTIVE CONSTANT VELOCITY JOINT MARKET SIZE, BY PROPULSION, 2018-2030 (USD MILLION)
- TABLE 83. SINGAPORE AUTOMOTIVE CONSTANT VELOCITY JOINT MARKET SIZE, BY VEHICLE TYPE, 2018-2030 (USD MILLION)
- TABLE 84. SINGAPORE AUTOMOTIVE CONSTANT VELOCITY JOINT MARKET SIZE, BY DISTRIBUTION CHANNEL, 2018-2030 (USD MILLION)
- TABLE 85. SOUTH KOREA AUTOMOTIVE CONSTANT VELOCITY JOINT MARKET SIZE, BY JOINT TYPE, 2018-2030 (USD MILLION)
- TABLE 86. SOUTH KOREA AUTOMOTIVE CONSTANT VELOCITY JOINT MARKET SIZE, BY PROPULSION, 2018-2030 (USD MILLION)
- TABLE 87. SOUTH KOREA AUTOMOTIVE CONSTANT VELOCITY JOINT MARKET SIZE, BY VEHICLE TYPE, 2018-2030 (USD MILLION)
- TABLE 88. SOUTH KOREA AUTOMOTIVE CONSTANT VELOCITY JOINT MARKET SIZE, BY DISTRIBUTION CHANNEL, 2018-2030 (USD MILLION)
- TABLE 89. TAIWAN AUTOMOTIVE CONSTANT VELOCITY JOINT MARKET SIZE, BY JOINT TYPE, 2018-2030 (USD MILLION)
- TABLE 90. TAIWAN AUTOMOTIVE CONSTANT VELOCITY JOINT MARKET SIZE, BY PROPULSION, 2018-2030 (USD MILLION)
- TABLE 91. TAIWAN AUTOMOTIVE CONSTANT VELOCITY JOINT MARKET SIZE, BY VEHICLE TYPE, 2018-2030 (USD MILLION)
- TABLE 92. TAIWAN AUTOMOTIVE CONSTANT VELOCITY JOINT MARKET SIZE, BY DISTRIBUTION CHANNEL, 2018-2030 (USD MILLION)
- TABLE 93. THAILAND AUTOMOTIVE CONSTANT VELOCITY JOINT MARKET SIZE, BY JOINT TYPE, 2018-2030 (USD MILLION)
- TABLE 94. THAILAND AUTOMOTIVE CONSTANT VELOCITY JOINT MARKET SIZE, BY PROPULSION, 2018-2030 (USD MILLION)
- TABLE 95. THAILAND AUTOMOTIVE CONSTANT VELOCITY JOINT MARKET SIZE, BY VEHICLE TYPE, 2018-2030 (USD MILLION)
- TABLE 96. THAILAND AUTOMOTIVE CONSTANT VELOCITY JOINT MARKET SIZE, BY DISTRIBUTION CHANNEL, 2018-2030 (USD MILLION)
- TABLE 97. VIETNAM AUTOMOTIVE CONSTANT VELOCITY JOINT MARKET SIZE, BY JOINT TYPE, 2018-2030 (USD MILLION)
- TABLE 98. VIETNAM AUTOMOTIVE CONSTANT VELOCITY JOINT MARKET SIZE, BY PROPULSION, 2018-2030 (USD MILLION)
- TABLE 99. VIETNAM AUTOMOTIVE CONSTANT VELOCITY JOINT MARKET SIZE, BY VEHICLE TYPE, 2018-2030 (USD MILLION)
- TABLE 100. VIETNAM AUTOMOTIVE CONSTANT VELOCITY JOINT MARKET SIZE, BY DISTRIBUTION CHANNEL, 2018-2030 (USD MILLION)
- TABLE 101. EUROPE, MIDDLE EAST & AFRICA AUTOMOTIVE CONSTANT VELOCITY JOINT MARKET SIZE, BY JOINT TYPE, 2018-2030 (USD MILLION)
- TABLE 102. EUROPE, MIDDLE EAST & AFRICA AUTOMOTIVE CONSTANT VELOCITY JOINT MARKET SIZE, BY PROPULSION, 2018-2030 (USD MILLION)
- TABLE 103. EUROPE, MIDDLE EAST & AFRICA AUTOMOTIVE CONSTANT VELOCITY JOINT MARKET SIZE, BY VEHICLE TYPE, 2018-2030 (USD MILLION)
- TABLE 104. EUROPE, MIDDLE EAST & AFRICA AUTOMOTIVE CONSTANT VELOCITY JOINT MARKET SIZE, BY DISTRIBUTION CHANNEL, 2018-2030 (USD MILLION)
- TABLE 105. EUROPE, MIDDLE EAST & AFRICA AUTOMOTIVE CONSTANT VELOCITY JOINT MARKET SIZE, BY COUNTRY, 2018-2030 (USD MILLION)
- TABLE 106. DENMARK AUTOMOTIVE CONSTANT VELOCITY JOINT MARKET SIZE, BY JOINT TYPE, 2018-2030 (USD MILLION)
- TABLE 107. DENMARK AUTOMOTIVE CONSTANT VELOCITY JOINT MARKET SIZE, BY PROPULSION, 2018-2030 (USD MILLION)
- TABLE 108. DENMARK AUTOMOTIVE CONSTANT VELOCITY JOINT MARKET SIZE, BY VEHICLE TYPE, 2018-2030 (USD MILLION)
- TABLE 109. DENMARK AUTOMOTIVE CONSTANT VELOCITY JOINT MARKET SIZE, BY DISTRIBUTION CHANNEL, 2018-2030 (USD MILLION)
- TABLE 110. EGYPT AUTOMOTIVE CONSTANT VELOCITY JOINT MARKET SIZE, BY JOINT TYPE, 2018-2030 (USD MILLION)
- TABLE 111. EGYPT AUTOMOTIVE CONSTANT VELOCITY JOINT MARKET SIZE, BY PROPULSION, 2018-2030 (USD MILLION)
- TABLE 112. EGYPT AUTOMOTIVE CONSTANT VELOCITY JOINT MARKET SIZE, BY VEHICLE TYPE, 2018-2030 (USD MILLION)
- TABLE 113. EGYPT AUTOMOTIVE CONSTANT VELOCITY JOINT MARKET SIZE, BY DISTRIBUTION CHANNEL, 2018-2030 (USD MILLION)
- TABLE 114. FINLAND AUTOMOTIVE CONSTANT VELOCITY JOINT MARKET SIZE, BY JOINT TYPE, 2018-2030 (USD MILLION)
- TABLE 115. FINLAND AUTOMOTIVE CONSTANT VELOCITY JOINT MARKET SIZE, BY PROPULSION, 2018-2030 (USD MILLION)
- TABLE 116. FINLAND AUTOMOTIVE CONSTANT VELOCITY JOINT MARKET SIZE, BY VEHICLE TYPE, 2018-2030 (USD MILLION)
- TABLE 117. FINLAND AUTOMOTIVE CONSTANT VELOCITY JOINT MARKET SIZE, BY DISTRIBUTION CHANNEL, 2018-2030 (USD MILLION)
- TABLE 118. FRANCE AUTOMOTIVE CONSTANT VELOCITY JOINT MARKET SIZE, BY JOINT TYPE, 2018-2030 (USD MILLION)
- TABLE 119. FRANCE AUTOMOTIVE CONSTANT VELOCITY JOINT MARKET SIZE, BY PROPULSION, 2018-2030 (USD MILLION)
- TABLE 120. FRANCE AUTOMOTIVE CONSTANT VELOCITY JOINT MARKET SIZE, BY VEHICLE TYPE, 2018-2030 (USD MILLION)
- TABLE 121. FRANCE AUTOMOTIVE CONSTANT VELOCITY JOINT MARKET SIZE, BY DISTRIBUTION CHANNEL, 2018-2030 (USD MILLION)
- TABLE 122. GERMANY AUTOMOTIVE CONSTANT VELOCITY JOINT MARKET SIZE, BY JOINT TYPE, 2018-2030 (USD MILLION)
- TABLE 123. GERMANY AUTOMOTIVE CONSTANT VELOCITY JOINT MARKET SIZE, BY PROPULSION, 2018-2030 (USD MILLION)
- TABLE 124. GERMANY AUTOMOTIVE CONSTANT VELOCITY JOINT MARKET SIZE, BY VEHICLE TYPE, 2018-2030 (USD MILLION)
- TABLE 125. GERMANY AUTOMOTIVE CONSTANT VELOCITY JOINT MARKET SIZE, BY DISTRIBUTION CHANNEL, 2018-2030 (USD MILLION)
- TABLE 126. ISRAEL AUTOMOTIVE CONSTANT VELOCITY JOINT MARKET SIZE, BY JOINT TYPE, 2018-2030 (USD MILLION)
- TABLE 127. ISRAEL AUTOMOTIVE CONSTANT VELOCITY JOINT MARKET SIZE, BY PROPULSION, 2018-2030 (USD MILLION)
- TABLE 128. ISRAEL AUTOMOTIVE CONSTANT VELOCITY JOINT MARKET SIZE, BY VEHICLE TYPE, 2018-2030 (USD MILLION)
- TABLE 129. ISRAEL AUTOMOTIVE CONSTANT VELOCITY JOINT MARKET SIZE, BY DISTRIBUTION CHANNEL, 2018-2030 (USD MILLION)
- TABLE 130. ITALY AUTOMOTIVE CONSTANT VELOCITY JOINT MARKET SIZE, BY JOINT TYPE, 2018-2030 (USD MILLION)
- TABLE 131. ITALY AUTOMOTIVE CONSTANT VELOCITY JOINT MARKET SIZE, BY PROPULSION, 2018-2030 (USD MILLION)
- TABLE 132. ITALY AUTOMOTIVE CONSTANT VELOCITY JOINT MARKET SIZE, BY VEHICLE TYPE, 2018-2030 (USD MILLION)
- TABLE 133. ITALY AUTOMOTIVE CONSTANT VELOCITY JOINT MARKET SIZE, BY DISTRIBUTION CHANNEL, 2018-2030 (USD MILLION)
- TABLE 134. NETHERLANDS AUTOMOTIVE CONSTANT VELOCITY JOINT MARKET SIZE, BY JOINT TYPE, 2018-2030 (USD MILLION)
- TABLE 135. NETHERLANDS AUTOMOTIVE CONSTANT VELOCITY JOINT MARKET SIZE, BY PROPULSION, 2018-2030 (USD MILLION)
- TABLE 136. NETHERLANDS AUTOMOTIVE CONSTANT VELOCITY JOINT MARKET SIZE, BY VEHICLE TYPE, 2018-2030 (USD MILLION)
- TABLE 137. NETHERLANDS AUTOMOTIVE CONSTANT VELOCITY JOINT MARKET SIZE, BY DISTRIBUTION CHANNEL, 2018-2030 (USD MILLION)
- TABLE 138. NIGERIA AUTOMOTIVE CONSTANT VELOCITY JOINT MARKET SIZE, BY JOINT TYPE, 2018-2030 (USD MILLION)
- TABLE 139. NIGERIA AUTOMOTIVE CONSTANT VELOCITY JOINT MARKET SIZE, BY PROPULSION, 2018-2030 (USD MILLION)
- TABLE 140. NIGERIA AUTOMOTIVE CONSTANT VELOCITY JOINT MARKET SIZE, BY VEHICLE TYPE, 2018-2030 (USD MILLION)
- TABLE 141. NIGERIA AUTOMOTIVE CONSTANT VELOCITY JOINT MARKET SIZE, BY DISTRIBUTION CHANNEL, 2018-2030 (USD MILLION)
- TABLE 142. NORWAY AUTOMOTIVE CONSTANT VELOCITY JOINT MARKET SIZE, BY JOINT TYPE, 2018-2030 (USD MILLION)
- TABLE 143. NORWAY AUTOMOTIVE CONSTANT VELOCITY JOINT MARKET SIZE, BY PROPULSION, 2018-2030 (USD MILLION)
- TABLE 144. NORWAY AUTOMOTIVE CONSTANT VELOCITY JOINT MARKET SIZE, BY VEHICLE TYPE, 2018-2030 (USD MILLION)
- TABLE 145. NORWAY AUTOMOTIVE CONSTANT VELOCITY JOINT MARKET SIZE, BY DISTRIBUTION CHANNEL, 2018-2030 (USD MILLION)
- TABLE 146. POLAND AUTOMOTIVE CONSTANT VELOCITY JOINT MARKET SIZE, BY JOINT TYPE, 2018-2030 (USD MILLION)
- TABLE 147. POLAND AUTOMOTIVE CONSTANT VELOCITY JOINT MARKET SIZE, BY PROPULSION, 2018-2030 (USD MILLION)
- TABLE 148. POLAND AUTOMOTIVE CONSTANT VELOCITY JOINT MARKET SIZE, BY VEHICLE TYPE, 2018-2030 (USD MILLION)
- TABLE 149. POLAND AUTOMOTIVE CONSTANT VELOCITY JOINT MARKET SIZE, BY DISTRIBUTION CHANNEL, 2018-2030 (USD MILLION)
- TABLE 150. QATAR AUTOMOTIVE CONSTANT VELOCITY JOINT MARKET SIZE, BY JOINT TYPE, 2018-2030 (USD MILLION)
- TABLE 151. QATAR AUTOMOTIVE CONSTANT VELOCITY JOINT MARKET SIZE, BY PROPULSION, 2018-2030 (USD MILLION)
- TABLE 152. QATAR AUTOMOTIVE CONSTANT VELOCITY JOINT MARKET SIZE, BY VEHICLE TYPE, 2018-2030 (USD MILLION)
- TABLE 153. QATAR AUTOMOTIVE CONSTANT VELOCITY JOINT MARKET SIZE, BY DISTRIBUTION CHANNEL, 2018-2030 (USD MILLION)
- TABLE 154. RUSSIA AUTOMOTIVE CONSTANT VELOCITY JOINT MARKET SIZE, BY JOINT TYPE, 2018-2030 (USD MILLION)
- TABLE 155. RUSSIA AUTOMOTIVE CONSTANT VELOCITY JOINT MARKET SIZE, BY PROPULSION, 2018-2030 (USD MILLION)
- TABLE 156. RUSSIA AUTOMOTIVE CONSTANT VELOCITY JOINT MARKET SIZE, BY VEHICLE TYPE, 2018-2030 (USD MILLION)
- TABLE 157. RUSSIA AUTOMOTIVE CONSTANT VELOCITY JOINT MARKET SIZE, BY DISTRIBUTION CHANNEL, 2018-2030 (USD MILLION)
- TABLE 158. SAUDI ARABIA AUTOMOTIVE CONSTANT VELOCITY JOINT MARKET SIZE, BY JOINT TYPE, 2018-2030 (USD MILLION)
- TABLE 159. SAUDI ARABIA AUTOMOTIVE CONSTANT VELOCITY JOINT MARKET SIZE, BY PROPULSION, 2018-2030 (USD MILLION)
- TABLE 160. SAUDI ARABIA AUTOMOTIVE CONSTANT VELOCITY JOINT MARKET SIZE, BY VEHICLE TYPE, 2018-2030 (USD MILLION)
- TABLE 161. SAUDI ARABIA AUTOMOTIVE CONSTANT VELOCITY JOINT MARKET SIZE, BY DISTRIBUTION CHANNEL, 2018-2030 (USD MILLION)
- TABLE 162. SOUTH AFRICA AUTOMOTIVE CONSTANT VELOCITY JOINT MARKET SIZE, BY JOINT TYPE, 2018-2030 (USD MILLION)
- TABLE 163. SOUTH AFRICA AUTOMOTIVE CONSTANT VELOCITY JOINT MARKET SIZE, BY PROPULSION, 2018-2030 (USD MILLION)
- TABLE 164. SOUTH AFRICA AUTOMOTIVE CONSTANT VELOCITY JOINT MARKET SIZE, BY VEHICLE TYPE, 2018-2030 (USD MILLION)
- TABLE 165. SOUTH AFRICA AUTOMOTIVE CONSTANT VELOCITY JOINT MARKET SIZE, BY DISTRIBUTION CHANNEL, 2018-2030 (USD MILLION)
- TABLE 166. SPAIN AUTOMOTIVE CONSTANT VELOCITY JOINT MARKET SIZE, BY JOINT TYPE, 2018-2030 (USD MILLION)
- TABLE 167. SPAIN AUTOMOTIVE CONSTANT VELOCITY JOINT MARKET SIZE, BY PROPULSION, 2018-2030 (USD MILLION)
- TABLE 168. SPAIN AUTOMOTIVE CONSTANT VELOCITY JOINT MARKET SIZE, BY VEHICLE TYPE, 2018-2030 (USD MILLION)
- TABLE 169. SPAIN AUTOMOTIVE CONSTANT VELOCITY JOINT MARKET SIZE, BY DISTRIBUTION CHANNEL, 2018-2030 (USD MILLION)
- TABLE 170. SWEDEN AUTOMOTIVE CONSTANT VELOCITY JOINT MARKET SIZE, BY JOINT TYPE, 2018-2030 (USD MILLION)
- TABLE 171. SWEDEN AUTOMOTIVE CONSTANT VELOCITY JOINT MARKET SIZE, BY PROPULSION, 2018-2030 (USD MILLION)
- TABLE 172. SWEDEN AUTOMOTIVE CONSTANT VELOCITY JOINT MARKET SIZE, BY VEHICLE TYPE, 2018-2030 (USD MILLION)
- TABLE 173. SWEDEN AUTOMOTIVE CONSTANT VELOCITY JOINT MARKET SIZE, BY DISTRIBUTION CHANNEL, 2018-2030 (USD MILLION)
- TABLE 174. SWITZERLAND AUTOMOTIVE CONSTANT VELOCITY JOINT MARKET SIZE, BY JOINT TYPE, 2018-2030 (USD MILLION)
- TABLE 175. SWITZERLAND AUTOMOTIVE CONSTANT VELOCITY JOINT MARKET SIZE, BY PROPULSION, 2018-2030 (USD MILLION)
- TABLE 176. SWITZERLAND AUTOMOTIVE CONSTANT VELOCITY JOINT MARKET SIZE, BY VEHICLE TYPE, 2018-2030 (USD MILLION)
- TABLE 177. SWITZERLAND AUTOMOTIVE CONSTANT VELOCITY JOINT MARKET SIZE, BY DISTRIBUTION CHANNEL, 2018-2030 (USD MILLION)
- TABLE 178. TURKEY AUTOMOTIVE CONSTANT VELOCITY JOINT MARKET SIZE, BY JOINT TYPE, 2018-2030 (USD MILLION)
- TABLE 179. TURKEY AUTOMOTIVE CONSTANT VELOCITY JOINT MARKET SIZE, BY PROPULSION, 2018-2030 (USD MILLION)
- TABLE 180. TURKEY AUTOMOTIVE CONSTANT VELOCITY JOINT MARKET SIZE, BY VEHICLE TYPE, 2018-2030 (USD MILLION)
- TABLE 181. TURKEY AUTOMOTIVE CONSTANT VELOCITY JOINT MARKET SIZE, BY DISTRIBUTION CHANNEL, 2018-2030 (USD MILLION)
- TABLE 182. UNITED ARAB EMIRATES AUTOMOTIVE CONSTANT VELOCITY JOINT MARKET SIZE, BY JOINT TYPE, 2018-2030 (USD MILLION)
- TABLE 183. UNITED ARAB EMIRATES AUTOMOTIVE CONSTANT VELOCITY JOINT MARKET SIZE, BY PROPULSION, 2018-2030 (USD MILLION)
- TABLE 184. UNITED ARAB EMIRATES AUTOMOTIVE CONSTANT VELOCITY JOINT MARKET SIZE, BY VEHICLE TYPE, 2018-2030 (USD MILLION)
- TABLE 185. UNITED ARAB EMIRATES AUTOMOTIVE CONSTANT VELOCITY JOINT MARKET SIZE, BY DISTRIBUTION CHANNEL, 2018-2030 (USD MILLION)
- TABLE 186. UNITED KINGDOM AUTOMOTIVE CONSTANT VELOCITY JOINT MARKET SIZE, BY JOINT TYPE, 2018-2030 (USD MILLION)
- TABLE 187. UNITED KINGDOM AUTOMOTIVE CONSTANT VELOCITY JOINT MARKET SIZE, BY PROPULSION, 2018-2030 (USD MILLION)
- TABLE 188. UNITED KINGDOM AUTOMOTIVE CONSTANT VELOCITY JOINT MARKET SIZE, BY VEHICLE TYPE, 2018-2030 (USD MILLION)
- TABLE 189. UNITED KINGDOM AUTOMOTIVE CONSTANT VELOCITY JOINT MARKET SIZE, BY DISTRIBUTION CHANNEL, 2018-2030 (USD MILLION)
- TABLE 190. AUTOMOTIVE CONSTANT VELOCITY JOINT MARKET, FPNV POSITIONING MATRIX, 2023
- TABLE 191. AUTOMOTIVE CONSTANT VELOCITY JOINT MARKET SHARE, BY KEY PLAYER, 2023
- TABLE 192. AUTOMOTIVE CONSTANT VELOCITY JOINT MARKET LICENSE & PRICING
 汽車商品市場:按類型、車型、最終用戶分類 - 2024-2030 年全球預測
 2024年汽車壓板全球市場報告
 全球汽車煞車零件市場研究報告 - 2024 年至 2032 年產業分析、規模、佔有率、成長、趨勢和預測
 2024 年汽車電動傳動系統組件全球市場報告
 2024年汽車用紡織品全球市場報告
 2024年汽車等速萬向全球市場報告
 汽車煞車零件市場(煞車卡鉗:浮動卡鉗和固定卡鉗;煞車蹄片:領先和半拖曳)- 2023-2031 年全球產業分析、規模、佔有率、成長、趨勢和預測
 到 2030 年汽車橡膠成型零件市場預測:按產品類型、材料類型、車型、最終用戶和地區分類的全球分析
 至 2030 年卡車懸吊連桿市場預測:按類型、應用和地區分類的全球分析
 汽車煞車零件市場:按零件類型、分佈 - 2024-2030 年全球預測