


 |
市場調查報告書
商品編碼
1413088
奈米生物技術市場:按產品、按應用分類 - 2024-2030 年全球預測Nanobiotechnology Market by Product (Nano-Enabled Drugs, Nanodevices, Nanoparticles), Application (Agriculture, Cancer Treatment, Diagnostics) - Global Forecast 2024-2030 |
||||||
※ 本網頁內容可能與最新版本有所差異。詳細情況請與我們聯繫。
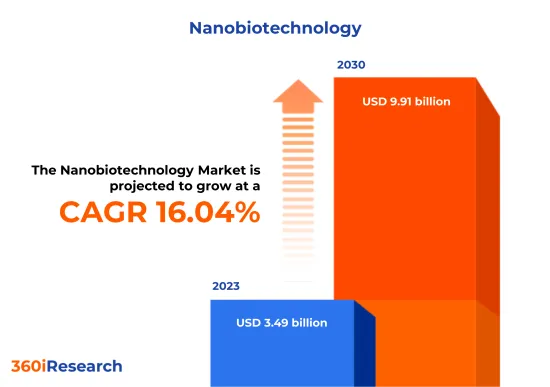
預計2023年奈米生物技術市場規模為34.9億美元,預計2024年將達41.1億美元,2030年將達到99.1億美元,複合年成長率為16.04%。
奈米生物技術的全球市場
| 主要市場統計 | |
|---|---|
| 基準年[2023] | 34.9億美元 |
| 預測年份 [2024] | 41.1億美元 |
| 預測年份 [2030] | 99.1億美元 |
| 複合年成長率(%) | 16.04% |
FPNV定位矩陣
FPNV定位矩陣對於評估奈米生物技術市場至關重要。我們檢視與業務策略和產品滿意度相關的關鍵指標,以對供應商進行全面評估。這種深入的分析使用戶能夠根據自己的要求做出資訊的決策。根據評估,供應商被分為四個成功程度不同的像限:前沿(F)、探路者(P)、利基(N)和重要(V)。
市場佔有率分析
市場佔有率分析是一種綜合工具,可以對奈米生物技術市場供應商的現狀進行深入而詳細的研究。全面比較和分析供應商在整體收益、基本客群和其他關鍵指標方面的貢獻,以便更好地了解公司的績效及其在爭奪市場佔有率時面臨的挑戰。此外,該分析還提供了對該行業競爭特徵的寶貴考察,包括在研究基準年觀察到的累積、分散主導地位和合併特徵等因素。這種詳細程度的提高使供應商能夠做出更資訊的決策並制定有效的策略,從而在市場上獲得競爭優勢。
該報告對以下幾個方面提供了寶貴的見解:
1-市場滲透率:提供有關主要企業所服務的市場的全面資訊。
2-市場開拓:我們深入研究利潤豐厚的新興市場,並分析它們在成熟細分市場中的滲透率。
3- 市場多元化:提供有關新產品發布、開拓地區、最新發展和投資的詳細資訊。
4-競爭力評估與資訊:對主要企業的市場佔有率、策略、產品、認證、監管狀況、專利狀況、製造能力等進行全面評估。
5- 產品開發與創新:提供對未來技術、研發活動和突破性產品開發的見解。
本報告解決了以下關鍵問題:
1-奈米生物技術市場的市場規模與預測是多少?
2-奈米生物技術市場預測期內需要考慮投資的產品、細分市場、應用和領域有哪些?
3-奈米生物技術市場的技術趨勢和法律規範是什麼?
4-奈米生物技術市場主要供應商的市場佔有率是多少?
5-進入奈米生物技術市場的合適型態和策略手段是什麼?
目錄
第1章 前言
第2章調查方法
第3章執行摘要
第4章市場概況
第5章市場洞察
- 市場動態
- 促進因素
- 增加奈米生物技術的使用以改善醫療保健實踐
- 改善藥物研發與開發流程
- 利用奈米技術開發永續生物材料
- 抑制因素
- 與奈米生物技術相關的倫理和環境問題
- 機會
- 基因組學和蛋白質組學研究的增加
- 奈米生物技術在農業中的新用途
- 任務
- 奈米科技產品管理法規
- 促進因素
- 市場區隔分析
- 市場趨勢分析
- 高通膨的累積效應
- 波特五力分析
- 價值鍊和關鍵路徑分析
- 法律規範
第6章奈米生物技術市場:依產品
- 可奈米化的藥物
- 奈米裝置
- 奈米粒子
- 奈米科技工具
第7章奈米生物技術市場:依應用分類
- 農業
- 癌症治療
- 診斷
- 藥物輸送
- 環境監測
- 再生醫學
- 療法
第8章美洲奈米生物技術市場
- 阿根廷
- 巴西
- 加拿大
- 墨西哥
- 美國
第9章亞太地區奈米生物技術市場
- 澳洲
- 中國
- 印度
- 印尼
- 日本
- 馬來西亞
- 菲律賓
- 新加坡
- 韓國
- 台灣
- 泰國
- 越南
第10章歐洲、中東和非洲奈米生物技術市場
- 丹麥
- 埃及
- 芬蘭
- 法國
- 德國
- 以色列
- 義大利
- 荷蘭
- 奈及利亞
- 挪威
- 波蘭
- 卡達
- 俄羅斯
- 沙烏地阿拉伯
- 南非
- 西班牙
- 瑞典
- 瑞士
- 土耳其
- 阿拉伯聯合大公國
- 英國
第11章競爭形勢
- FPNV定位矩陣
- 市場佔有率分析:按主要企業分類
- 主要企業競爭情境分析
第12章競爭產品組合
- 主要公司簡介
- 3M Company
- Agilent Technologies, Inc.
- Analog Devices, Inc.
- ANSELL LTD.
- Arkema SA
- Bruker Corporation
- DuPont de Nemours, Inc.
- Eurofins Scientific SE
- Evonik Industries AG
- Honeywell International Inc.
- Merck KGaA
- Nanoscience Instruments, Inc.
- Nanospan Inc.
- Sioen Industries NV
- Texas Instruments Incorporated
- Thermo Fisher Scientific Inc.
- 主要產品系列
第13章附錄
- 討論指南
- 關於許可證和定價
[183 Pages Report] The Nanobiotechnology Market size was estimated at USD 3.49 billion in 2023 and expected to reach USD 4.11 billion in 2024, at a CAGR 16.04% to reach USD 9.91 billion by 2030.
Global Nanobiotechnology Market
| KEY MARKET STATISTICS | |
|---|---|
| Base Year [2023] | USD 3.49 billion |
| Estimated Year [2024] | USD 4.11 billion |
| Forecast Year [2030] | USD 9.91 billion |
| CAGR (%) | 16.04% |
FPNV Positioning Matrix
The FPNV Positioning Matrix is pivotal in evaluating the Nanobiotechnology Market. It offers a comprehensive assessment of vendors, examining key metrics related to Business Strategy and Product Satisfaction. This in-depth analysis empowers users to make well-informed decisions aligned with their requirements. Based on the evaluation, the vendors are then categorized into four distinct quadrants representing varying levels of success: Forefront (F), Pathfinder (P), Niche (N), or Vital (V).
Market Share Analysis
The Market Share Analysis is a comprehensive tool that provides an insightful and in-depth examination of the current state of vendors in the Nanobiotechnology Market. By meticulously comparing and analyzing vendor contributions in terms of overall revenue, customer base, and other key metrics, we can offer companies a greater understanding of their performance and the challenges they face when competing for market share. Additionally, this analysis provides valuable insights into the competitive nature of the sector, including factors such as accumulation, fragmentation dominance, and amalgamation traits observed over the base year period studied. With this expanded level of detail, vendors can make more informed decisions and devise effective strategies to gain a competitive edge in the market.
Key Company Profiles
The report delves into recent significant developments in the Nanobiotechnology Market, highlighting leading vendors and their innovative profiles. These include 3M Company, Agilent Technologies, Inc., Analog Devices, Inc., ANSELL LTD., Arkema S.A., Bruker Corporation, DuPont de Nemours, Inc., Eurofins Scientific SE, Evonik Industries AG, Honeywell International Inc., Merck KGaA, Nanoscience Instruments, Inc., Nanospan Inc., Sioen Industries NV, Texas Instruments Incorporated, and Thermo Fisher Scientific Inc..
Market Segmentation & Coverage
This research report categorizes the Nanobiotechnology Market to forecast the revenues and analyze trends in each of the following sub-markets:
- Product
- Nano-Enabled Drugs
- Nanodevices
- Nanoparticles
- Nanotechnology Tools
- Application
- Agriculture
- Cancer Treatment
- Diagnostics
- Drug Delivery
- Environmental Monitoring
- Regenerative Medicines
- Therapeutics
- Region
- Americas
- Argentina
- Brazil
- Canada
- Mexico
- United States
- California
- Florida
- Illinois
- New York
- Ohio
- Pennsylvania
- Texas
- Asia-Pacific
- Australia
- China
- India
- Indonesia
- Japan
- Malaysia
- Philippines
- Singapore
- South Korea
- Taiwan
- Thailand
- Vietnam
- Europe, Middle East & Africa
- Denmark
- Egypt
- Finland
- France
- Germany
- Israel
- Italy
- Netherlands
- Nigeria
- Norway
- Poland
- Qatar
- Russia
- Saudi Arabia
- South Africa
- Spain
- Sweden
- Switzerland
- Turkey
- United Arab Emirates
- United Kingdom
- Americas
The report offers valuable insights on the following aspects:
1. Market Penetration: It presents comprehensive information on the market provided by key players.
2. Market Development: It delves deep into lucrative emerging markets and analyzes the penetration across mature market segments.
3. Market Diversification: It provides detailed information on new product launches, untapped geographic regions, recent developments, and investments.
4. Competitive Assessment & Intelligence: It conducts an exhaustive assessment of market shares, strategies, products, certifications, regulatory approvals, patent landscape, and manufacturing capabilities of the leading players.
5. Product Development & Innovation: It offers intelligent insights on future technologies, R&D activities, and breakthrough product developments.
The report addresses key questions such as:
1. What is the market size and forecast of the Nanobiotechnology Market?
2. Which products, segments, applications, and areas should one consider investing in over the forecast period in the Nanobiotechnology Market?
3. What are the technology trends and regulatory frameworks in the Nanobiotechnology Market?
4. What is the market share of the leading vendors in the Nanobiotechnology Market?
5. Which modes and strategic moves are suitable for entering the Nanobiotechnology Market?
Table of Contents
1. Preface
- 1.1. Objectives of the Study
- 1.2. Market Segmentation & Coverage
- 1.3. Years Considered for the Study
- 1.4. Currency & Pricing
- 1.5. Language
- 1.6. Limitations
- 1.7. Assumptions
- 1.8. Stakeholders
2. Research Methodology
- 2.1. Define: Research Objective
- 2.2. Determine: Research Design
- 2.3. Prepare: Research Instrument
- 2.4. Collect: Data Source
- 2.5. Analyze: Data Interpretation
- 2.6. Formulate: Data Verification
- 2.7. Publish: Research Report
- 2.8. Repeat: Report Update
3. Executive Summary
4. Market Overview
- 4.1. Introduction
- 4.2. Nanobiotechnology Market, by Region
5. Market Insights
- 5.1. Market Dynamics
- 5.1.1. Drivers
- 5.1.1.1. Increasing the use of nanobiotechnology for improving healthcare practices
- 5.1.1.2. Rising drug discovery and development processes
- 5.1.1.3. Utilization of nanotechnology for development of sustainable biomaterials
- 5.1.2. Restraints
- 5.1.2.1. Ethical and environmental issues associated with nanobiotechnology
- 5.1.3. Opportunities
- 5.1.3.1. Increasing research in genomics and proteomics
- 5.1.3.2. Emerging use of nanobiotechnology in agriculture
- 5.1.4. Challenges
- 5.1.4.1. Regulations governing nanotechnology products
- 5.1.1. Drivers
- 5.2. Market Segmentation Analysis
- 5.3. Market Trend Analysis
- 5.4. Cumulative Impact of High Inflation
- 5.5. Porter's Five Forces Analysis
- 5.5.1. Threat of New Entrants
- 5.5.2. Threat of Substitutes
- 5.5.3. Bargaining Power of Customers
- 5.5.4. Bargaining Power of Suppliers
- 5.5.5. Industry Rivalry
- 5.6. Value Chain & Critical Path Analysis
- 5.7. Regulatory Framework
6. Nanobiotechnology Market, by Product
- 6.1. Introduction
- 6.2. Nano-Enabled Drugs
- 6.3. Nanodevices
- 6.4. Nanoparticles
- 6.5. Nanotechnology Tools
7. Nanobiotechnology Market, by Application
- 7.1. Introduction
- 7.2. Agriculture
- 7.3. Cancer Treatment
- 7.4. Diagnostics
- 7.5. Drug Delivery
- 7.6. Environmental Monitoring
- 7.7. Regenerative Medicines
- 7.8. Therapeutics
8. Americas Nanobiotechnology Market
- 8.1. Introduction
- 8.2. Argentina
- 8.3. Brazil
- 8.4. Canada
- 8.5. Mexico
- 8.6. United States
9. Asia-Pacific Nanobiotechnology Market
- 9.1. Introduction
- 9.2. Australia
- 9.3. China
- 9.4. India
- 9.5. Indonesia
- 9.6. Japan
- 9.7. Malaysia
- 9.8. Philippines
- 9.9. Singapore
- 9.10. South Korea
- 9.11. Taiwan
- 9.12. Thailand
- 9.13. Vietnam
10. Europe, Middle East & Africa Nanobiotechnology Market
- 10.1. Introduction
- 10.2. Denmark
- 10.3. Egypt
- 10.4. Finland
- 10.5. France
- 10.6. Germany
- 10.7. Israel
- 10.8. Italy
- 10.9. Netherlands
- 10.10. Nigeria
- 10.11. Norway
- 10.12. Poland
- 10.13. Qatar
- 10.14. Russia
- 10.15. Saudi Arabia
- 10.16. South Africa
- 10.17. Spain
- 10.18. Sweden
- 10.19. Switzerland
- 10.20. Turkey
- 10.21. United Arab Emirates
- 10.22. United Kingdom
11. Competitive Landscape
- 11.1. FPNV Positioning Matrix
- 11.2. Market Share Analysis, By Key Player
- 11.3. Competitive Scenario Analysis, By Key Player
12. Competitive Portfolio
- 12.1. Key Company Profiles
- 12.1.1. 3M Company
- 12.1.2. Agilent Technologies, Inc.
- 12.1.3. Analog Devices, Inc.
- 12.1.4. ANSELL LTD.
- 12.1.5. Arkema S.A.
- 12.1.6. Bruker Corporation
- 12.1.7. DuPont de Nemours, Inc.
- 12.1.8. Eurofins Scientific SE
- 12.1.9. Evonik Industries AG
- 12.1.10. Honeywell International Inc.
- 12.1.11. Merck KGaA
- 12.1.12. Nanoscience Instruments, Inc.
- 12.1.13. Nanospan Inc.
- 12.1.14. Sioen Industries NV
- 12.1.15. Texas Instruments Incorporated
- 12.1.16. Thermo Fisher Scientific Inc.
- 12.2. Key Product Portfolio
13. Appendix
- 13.1. Discussion Guide
- 13.2. License & Pricing
LIST OF FIGURES
- FIGURE 1. NANOBIOTECHNOLOGY MARKET RESEARCH PROCESS
- FIGURE 2. NANOBIOTECHNOLOGY MARKET SIZE, 2023 VS 2030
- FIGURE 3. NANOBIOTECHNOLOGY MARKET SIZE, 2018-2030 (USD MILLION)
- FIGURE 4. NANOBIOTECHNOLOGY MARKET SIZE, BY REGION, 2023 VS 2030 (%)
- FIGURE 5. NANOBIOTECHNOLOGY MARKET SIZE, BY REGION, 2023 VS 2024 VS 2030 (USD MILLION)
- FIGURE 6. NANOBIOTECHNOLOGY MARKET DYNAMICS
- FIGURE 7. NANOBIOTECHNOLOGY MARKET SIZE, BY PRODUCT, 2023 VS 2030 (%)
- FIGURE 8. NANOBIOTECHNOLOGY MARKET SIZE, BY PRODUCT, 2023 VS 2024 VS 2030 (USD MILLION)
- FIGURE 9. NANOBIOTECHNOLOGY MARKET SIZE, BY APPLICATION, 2023 VS 2030 (%)
- FIGURE 10. NANOBIOTECHNOLOGY MARKET SIZE, BY APPLICATION, 2023 VS 2024 VS 2030 (USD MILLION)
- FIGURE 11. AMERICAS NANOBIOTECHNOLOGY MARKET SIZE, BY COUNTRY, 2023 VS 2030 (%)
- FIGURE 12. AMERICAS NANOBIOTECHNOLOGY MARKET SIZE, BY COUNTRY, 2023 VS 2024 VS 2030 (USD MILLION)
- FIGURE 13. UNITED STATES NANOBIOTECHNOLOGY MARKET SIZE, BY STATE, 2023 VS 2030 (%)
- FIGURE 14. UNITED STATES NANOBIOTECHNOLOGY MARKET SIZE, BY STATE, 2023 VS 2024 VS 2030 (USD MILLION)
- FIGURE 15. ASIA-PACIFIC NANOBIOTECHNOLOGY MARKET SIZE, BY COUNTRY, 2023 VS 2030 (%)
- FIGURE 16. ASIA-PACIFIC NANOBIOTECHNOLOGY MARKET SIZE, BY COUNTRY, 2023 VS 2024 VS 2030 (USD MILLION)
- FIGURE 17. EUROPE, MIDDLE EAST & AFRICA NANOBIOTECHNOLOGY MARKET SIZE, BY COUNTRY, 2023 VS 2030 (%)
- FIGURE 18. EUROPE, MIDDLE EAST & AFRICA NANOBIOTECHNOLOGY MARKET SIZE, BY COUNTRY, 2023 VS 2024 VS 2030 (USD MILLION)
- FIGURE 19. NANOBIOTECHNOLOGY MARKET, FPNV POSITIONING MATRIX, 2023
- FIGURE 20. NANOBIOTECHNOLOGY MARKET SHARE, BY KEY PLAYER, 2023
LIST OF TABLES
- TABLE 1. NANOBIOTECHNOLOGY MARKET SEGMENTATION & COVERAGE
- TABLE 2. UNITED STATES DOLLAR EXCHANGE RATE, 2018-2023
- TABLE 3. NANOBIOTECHNOLOGY MARKET SIZE, 2018-2030 (USD MILLION)
- TABLE 4. GLOBAL NANOBIOTECHNOLOGY MARKET SIZE, BY REGION, 2018-2030 (USD MILLION)
- TABLE 5. NANOBIOTECHNOLOGY MARKET SIZE, BY PRODUCT, 2018-2030 (USD MILLION)
- TABLE 6. NANOBIOTECHNOLOGY MARKET SIZE, BY NANO-ENABLED DRUGS, BY REGION, 2018-2030 (USD MILLION)
- TABLE 7. NANOBIOTECHNOLOGY MARKET SIZE, BY NANODEVICES, BY REGION, 2018-2030 (USD MILLION)
- TABLE 8. NANOBIOTECHNOLOGY MARKET SIZE, BY NANOPARTICLES, BY REGION, 2018-2030 (USD MILLION)
- TABLE 9. NANOBIOTECHNOLOGY MARKET SIZE, BY NANOTECHNOLOGY TOOLS, BY REGION, 2018-2030 (USD MILLION)
- TABLE 10. NANOBIOTECHNOLOGY MARKET SIZE, BY APPLICATION, 2018-2030 (USD MILLION)
- TABLE 11. NANOBIOTECHNOLOGY MARKET SIZE, BY AGRICULTURE, BY REGION, 2018-2030 (USD MILLION)
- TABLE 12. NANOBIOTECHNOLOGY MARKET SIZE, BY CANCER TREATMENT, BY REGION, 2018-2030 (USD MILLION)
- TABLE 13. NANOBIOTECHNOLOGY MARKET SIZE, BY DIAGNOSTICS, BY REGION, 2018-2030 (USD MILLION)
- TABLE 14. NANOBIOTECHNOLOGY MARKET SIZE, BY DRUG DELIVERY, BY REGION, 2018-2030 (USD MILLION)
- TABLE 15. NANOBIOTECHNOLOGY MARKET SIZE, BY ENVIRONMENTAL MONITORING, BY REGION, 2018-2030 (USD MILLION)
- TABLE 16. NANOBIOTECHNOLOGY MARKET SIZE, BY REGENERATIVE MEDICINES, BY REGION, 2018-2030 (USD MILLION)
- TABLE 17. NANOBIOTECHNOLOGY MARKET SIZE, BY THERAPEUTICS, BY REGION, 2018-2030 (USD MILLION)
- TABLE 18. AMERICAS NANOBIOTECHNOLOGY MARKET SIZE, BY PRODUCT, 2018-2030 (USD MILLION)
- TABLE 19. AMERICAS NANOBIOTECHNOLOGY MARKET SIZE, BY APPLICATION, 2018-2030 (USD MILLION)
- TABLE 20. AMERICAS NANOBIOTECHNOLOGY MARKET SIZE, BY COUNTRY, 2018-2030 (USD MILLION)
- TABLE 21. ARGENTINA NANOBIOTECHNOLOGY MARKET SIZE, BY PRODUCT, 2018-2030 (USD MILLION)
- TABLE 22. ARGENTINA NANOBIOTECHNOLOGY MARKET SIZE, BY APPLICATION, 2018-2030 (USD MILLION)
- TABLE 23. BRAZIL NANOBIOTECHNOLOGY MARKET SIZE, BY PRODUCT, 2018-2030 (USD MILLION)
- TABLE 24. BRAZIL NANOBIOTECHNOLOGY MARKET SIZE, BY APPLICATION, 2018-2030 (USD MILLION)
- TABLE 25. CANADA NANOBIOTECHNOLOGY MARKET SIZE, BY PRODUCT, 2018-2030 (USD MILLION)
- TABLE 26. CANADA NANOBIOTECHNOLOGY MARKET SIZE, BY APPLICATION, 2018-2030 (USD MILLION)
- TABLE 27. MEXICO NANOBIOTECHNOLOGY MARKET SIZE, BY PRODUCT, 2018-2030 (USD MILLION)
- TABLE 28. MEXICO NANOBIOTECHNOLOGY MARKET SIZE, BY APPLICATION, 2018-2030 (USD MILLION)
- TABLE 29. UNITED STATES NANOBIOTECHNOLOGY MARKET SIZE, BY PRODUCT, 2018-2030 (USD MILLION)
- TABLE 30. UNITED STATES NANOBIOTECHNOLOGY MARKET SIZE, BY APPLICATION, 2018-2030 (USD MILLION)
- TABLE 31. UNITED STATES NANOBIOTECHNOLOGY MARKET SIZE, BY STATE, 2018-2030 (USD MILLION)
- TABLE 32. ASIA-PACIFIC NANOBIOTECHNOLOGY MARKET SIZE, BY PRODUCT, 2018-2030 (USD MILLION)
- TABLE 33. ASIA-PACIFIC NANOBIOTECHNOLOGY MARKET SIZE, BY APPLICATION, 2018-2030 (USD MILLION)
- TABLE 34. ASIA-PACIFIC NANOBIOTECHNOLOGY MARKET SIZE, BY COUNTRY, 2018-2030 (USD MILLION)
- TABLE 35. AUSTRALIA NANOBIOTECHNOLOGY MARKET SIZE, BY PRODUCT, 2018-2030 (USD MILLION)
- TABLE 36. AUSTRALIA NANOBIOTECHNOLOGY MARKET SIZE, BY APPLICATION, 2018-2030 (USD MILLION)
- TABLE 37. CHINA NANOBIOTECHNOLOGY MARKET SIZE, BY PRODUCT, 2018-2030 (USD MILLION)
- TABLE 38. CHINA NANOBIOTECHNOLOGY MARKET SIZE, BY APPLICATION, 2018-2030 (USD MILLION)
- TABLE 39. INDIA NANOBIOTECHNOLOGY MARKET SIZE, BY PRODUCT, 2018-2030 (USD MILLION)
- TABLE 40. INDIA NANOBIOTECHNOLOGY MARKET SIZE, BY APPLICATION, 2018-2030 (USD MILLION)
- TABLE 41. INDONESIA NANOBIOTECHNOLOGY MARKET SIZE, BY PRODUCT, 2018-2030 (USD MILLION)
- TABLE 42. INDONESIA NANOBIOTECHNOLOGY MARKET SIZE, BY APPLICATION, 2018-2030 (USD MILLION)
- TABLE 43. JAPAN NANOBIOTECHNOLOGY MARKET SIZE, BY PRODUCT, 2018-2030 (USD MILLION)
- TABLE 44. JAPAN NANOBIOTECHNOLOGY MARKET SIZE, BY APPLICATION, 2018-2030 (USD MILLION)
- TABLE 45. MALAYSIA NANOBIOTECHNOLOGY MARKET SIZE, BY PRODUCT, 2018-2030 (USD MILLION)
- TABLE 46. MALAYSIA NANOBIOTECHNOLOGY MARKET SIZE, BY APPLICATION, 2018-2030 (USD MILLION)
- TABLE 47. PHILIPPINES NANOBIOTECHNOLOGY MARKET SIZE, BY PRODUCT, 2018-2030 (USD MILLION)
- TABLE 48. PHILIPPINES NANOBIOTECHNOLOGY MARKET SIZE, BY APPLICATION, 2018-2030 (USD MILLION)
- TABLE 49. SINGAPORE NANOBIOTECHNOLOGY MARKET SIZE, BY PRODUCT, 2018-2030 (USD MILLION)
- TABLE 50. SINGAPORE NANOBIOTECHNOLOGY MARKET SIZE, BY APPLICATION, 2018-2030 (USD MILLION)
- TABLE 51. SOUTH KOREA NANOBIOTECHNOLOGY MARKET SIZE, BY PRODUCT, 2018-2030 (USD MILLION)
- TABLE 52. SOUTH KOREA NANOBIOTECHNOLOGY MARKET SIZE, BY APPLICATION, 2018-2030 (USD MILLION)
- TABLE 53. TAIWAN NANOBIOTECHNOLOGY MARKET SIZE, BY PRODUCT, 2018-2030 (USD MILLION)
- TABLE 54. TAIWAN NANOBIOTECHNOLOGY MARKET SIZE, BY APPLICATION, 2018-2030 (USD MILLION)
- TABLE 55. THAILAND NANOBIOTECHNOLOGY MARKET SIZE, BY PRODUCT, 2018-2030 (USD MILLION)
- TABLE 56. THAILAND NANOBIOTECHNOLOGY MARKET SIZE, BY APPLICATION, 2018-2030 (USD MILLION)
- TABLE 57. VIETNAM NANOBIOTECHNOLOGY MARKET SIZE, BY PRODUCT, 2018-2030 (USD MILLION)
- TABLE 58. VIETNAM NANOBIOTECHNOLOGY MARKET SIZE, BY APPLICATION, 2018-2030 (USD MILLION)
- TABLE 59. EUROPE, MIDDLE EAST & AFRICA NANOBIOTECHNOLOGY MARKET SIZE, BY PRODUCT, 2018-2030 (USD MILLION)
- TABLE 60. EUROPE, MIDDLE EAST & AFRICA NANOBIOTECHNOLOGY MARKET SIZE, BY APPLICATION, 2018-2030 (USD MILLION)
- TABLE 61. EUROPE, MIDDLE EAST & AFRICA NANOBIOTECHNOLOGY MARKET SIZE, BY COUNTRY, 2018-2030 (USD MILLION)
- TABLE 62. DENMARK NANOBIOTECHNOLOGY MARKET SIZE, BY PRODUCT, 2018-2030 (USD MILLION)
- TABLE 63. DENMARK NANOBIOTECHNOLOGY MARKET SIZE, BY APPLICATION, 2018-2030 (USD MILLION)
- TABLE 64. EGYPT NANOBIOTECHNOLOGY MARKET SIZE, BY PRODUCT, 2018-2030 (USD MILLION)
- TABLE 65. EGYPT NANOBIOTECHNOLOGY MARKET SIZE, BY APPLICATION, 2018-2030 (USD MILLION)
- TABLE 66. FINLAND NANOBIOTECHNOLOGY MARKET SIZE, BY PRODUCT, 2018-2030 (USD MILLION)
- TABLE 67. FINLAND NANOBIOTECHNOLOGY MARKET SIZE, BY APPLICATION, 2018-2030 (USD MILLION)
- TABLE 68. FRANCE NANOBIOTECHNOLOGY MARKET SIZE, BY PRODUCT, 2018-2030 (USD MILLION)
- TABLE 69. FRANCE NANOBIOTECHNOLOGY MARKET SIZE, BY APPLICATION, 2018-2030 (USD MILLION)
- TABLE 70. GERMANY NANOBIOTECHNOLOGY MARKET SIZE, BY PRODUCT, 2018-2030 (USD MILLION)
- TABLE 71. GERMANY NANOBIOTECHNOLOGY MARKET SIZE, BY APPLICATION, 2018-2030 (USD MILLION)
- TABLE 72. ISRAEL NANOBIOTECHNOLOGY MARKET SIZE, BY PRODUCT, 2018-2030 (USD MILLION)
- TABLE 73. ISRAEL NANOBIOTECHNOLOGY MARKET SIZE, BY APPLICATION, 2018-2030 (USD MILLION)
- TABLE 74. ITALY NANOBIOTECHNOLOGY MARKET SIZE, BY PRODUCT, 2018-2030 (USD MILLION)
- TABLE 75. ITALY NANOBIOTECHNOLOGY MARKET SIZE, BY APPLICATION, 2018-2030 (USD MILLION)
- TABLE 76. NETHERLANDS NANOBIOTECHNOLOGY MARKET SIZE, BY PRODUCT, 2018-2030 (USD MILLION)
- TABLE 77. NETHERLANDS NANOBIOTECHNOLOGY MARKET SIZE, BY APPLICATION, 2018-2030 (USD MILLION)
- TABLE 78. NIGERIA NANOBIOTECHNOLOGY MARKET SIZE, BY PRODUCT, 2018-2030 (USD MILLION)
- TABLE 79. NIGERIA NANOBIOTECHNOLOGY MARKET SIZE, BY APPLICATION, 2018-2030 (USD MILLION)
- TABLE 80. NORWAY NANOBIOTECHNOLOGY MARKET SIZE, BY PRODUCT, 2018-2030 (USD MILLION)
- TABLE 81. NORWAY NANOBIOTECHNOLOGY MARKET SIZE, BY APPLICATION, 2018-2030 (USD MILLION)
- TABLE 82. POLAND NANOBIOTECHNOLOGY MARKET SIZE, BY PRODUCT, 2018-2030 (USD MILLION)
- TABLE 83. POLAND NANOBIOTECHNOLOGY MARKET SIZE, BY APPLICATION, 2018-2030 (USD MILLION)
- TABLE 84. QATAR NANOBIOTECHNOLOGY MARKET SIZE, BY PRODUCT, 2018-2030 (USD MILLION)
- TABLE 85. QATAR NANOBIOTECHNOLOGY MARKET SIZE, BY APPLICATION, 2018-2030 (USD MILLION)
- TABLE 86. RUSSIA NANOBIOTECHNOLOGY MARKET SIZE, BY PRODUCT, 2018-2030 (USD MILLION)
- TABLE 87. RUSSIA NANOBIOTECHNOLOGY MARKET SIZE, BY APPLICATION, 2018-2030 (USD MILLION)
- TABLE 88. SAUDI ARABIA NANOBIOTECHNOLOGY MARKET SIZE, BY PRODUCT, 2018-2030 (USD MILLION)
- TABLE 89. SAUDI ARABIA NANOBIOTECHNOLOGY MARKET SIZE, BY APPLICATION, 2018-2030 (USD MILLION)
- TABLE 90. SOUTH AFRICA NANOBIOTECHNOLOGY MARKET SIZE, BY PRODUCT, 2018-2030 (USD MILLION)
- TABLE 91. SOUTH AFRICA NANOBIOTECHNOLOGY MARKET SIZE, BY APPLICATION, 2018-2030 (USD MILLION)
- TABLE 92. SPAIN NANOBIOTECHNOLOGY MARKET SIZE, BY PRODUCT, 2018-2030 (USD MILLION)
- TABLE 93. SPAIN NANOBIOTECHNOLOGY MARKET SIZE, BY APPLICATION, 2018-2030 (USD MILLION)
- TABLE 94. SWEDEN NANOBIOTECHNOLOGY MARKET SIZE, BY PRODUCT, 2018-2030 (USD MILLION)
- TABLE 95. SWEDEN NANOBIOTECHNOLOGY MARKET SIZE, BY APPLICATION, 2018-2030 (USD MILLION)
- TABLE 96. SWITZERLAND NANOBIOTECHNOLOGY MARKET SIZE, BY PRODUCT, 2018-2030 (USD MILLION)
- TABLE 97. SWITZERLAND NANOBIOTECHNOLOGY MARKET SIZE, BY APPLICATION, 2018-2030 (USD MILLION)
- TABLE 98. TURKEY NANOBIOTECHNOLOGY MARKET SIZE, BY PRODUCT, 2018-2030 (USD MILLION)
- TABLE 99. TURKEY NANOBIOTECHNOLOGY MARKET SIZE, BY APPLICATION, 2018-2030 (USD MILLION)
- TABLE 100. UNITED ARAB EMIRATES NANOBIOTECHNOLOGY MARKET SIZE, BY PRODUCT, 2018-2030 (USD MILLION)
- TABLE 101. UNITED ARAB EMIRATES NANOBIOTECHNOLOGY MARKET SIZE, BY APPLICATION, 2018-2030 (USD MILLION)
- TABLE 102. UNITED KINGDOM NANOBIOTECHNOLOGY MARKET SIZE, BY PRODUCT, 2018-2030 (USD MILLION)
- TABLE 103. UNITED KINGDOM NANOBIOTECHNOLOGY MARKET SIZE, BY APPLICATION, 2018-2030 (USD MILLION)
- TABLE 104. NANOBIOTECHNOLOGY MARKET, FPNV POSITIONING MATRIX, 2023
- TABLE 105. NANOBIOTECHNOLOGY MARKET SHARE, BY KEY PLAYER, 2023
- TABLE 106. NANOBIOTECHNOLOGY MARKET LICENSE & PRICING
 全球奈米技術市場規模研究與預測,按類型(奈米設備、奈米感測器)、產業(電子、醫療保健、製造、能源與電力、汽車、航太與國防、食品與飲料、其他)和區域分析,2023 -2030 年
 全球奈米技術市場規模、佔有率、成長分析,按類型、產業、地區分類 - 產業預測,2024-2031 年
 2024 年奈米技術醫療設備全球市場報告
 2024 年衛星奈米技術應用全球市場報告
 全球奈米生物技術市場:按類型、療法、技術、應用、最終用戶、地區、機會、預測,2017-2031
 航太奈米技術市場報告:2030 年趨勢、預測與競爭分析
 2024-2028 年全球圖形化市場
 2024 年航太奈米技術全球市場報告
 航太奈米技術市場:按奈米材料材料類型、應用分類 - 2024-2030 年全球預測
 2024 年奈米技術服務全球市場報告