


 |
市場調查報告書
商品編碼
1412639
工業被覆劑市場:按樹脂類型、技術和最終用戶分類 - 2024-2030 年全球預測Industrial Coatings Market by Resin Type (Acrylic, Alkyd, Amino), Technology (High Solids, Powder, Solvent-Based), End-Users - Global Forecast 2024-2030 |
||||||
※ 本網頁內容可能與最新版本有所差異。詳細情況請與我們聯繫。
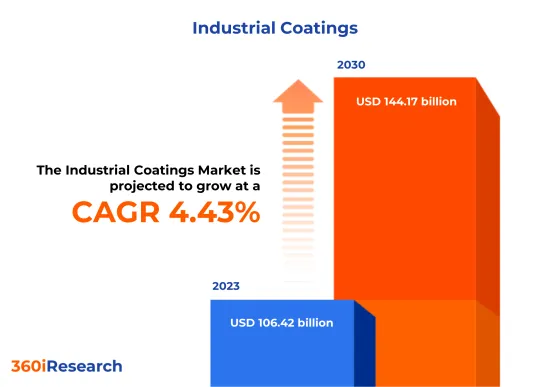
預計2023年工業被覆劑市場規模為1,064.2億美元,2024年將達到1,105.9億美元,2030年預計將達1,441.7億美元,複合年成長率為4.43%。
全球工業被覆劑市場
| 主要市場統計 | |
|---|---|
| 基準年[2023] | 1064.2億美元 |
| 預測年份 [2024] | 1105.9億美元 |
| 預測年份 [2030] | 1441.7億美元 |
| 複合年成長率(%) | 4.43% |
工業被覆劑市場包括特種油漆和用於保護和裝飾工業結構和設備表面的被覆劑的銷售。這些塗料旨在承受腐蝕和磨損等環境因素,延長物體的使用壽命並提高其耐用性。汽車產量的不斷增加以及對美觀、耐用和抵禦惡劣條件的高性能塗料的需求不斷增加,對工業被覆劑的需求顯著增加。此外,世界各地政府改善基礎設施的努力增加了對塗料的需求,以保護和延長結構的壽命。然而,原料價格的波動和對溶劑型塗料使用的嚴格規定已成為主要挑戰。此外,由於原料短缺、運輸問題和地緣政治緊張局勢等因素造成的供應鏈潛在中斷可能會阻礙市場成長。此外,自癒性能、抗菌性能和智慧塗料等技術進步具有巨大的市場拓展潛力。新興經濟體工業化和都市化的不斷發展可能為擴大工業被覆劑的使用帶來巨大的成長機會。
區域洞察
由於中國、日本和印度工業和製造業的蓬勃發展,亞太地區對工業被覆劑的需求正在迅速擴大。亞太地區客戶對環保塗料有著強烈的偏好,促使製造商投資綠色技術和水性塗料。汽車和船舶工業對高性能防腐塗料的需求特別大,人們越來越關注尋找耐用和永續的塗料。在美洲,美國對高品質、創新的塗料產品有著穩定的需求,而加拿大由於石油和天然氣行業的擴張而擁有不斷成長的市場,需要專門的管道塗料。在美洲,嚴格的環境法規和消費者意識導致了環保塗料的明顯趨勢。美洲的購買很大程度上受到節能塗料的長期成本節約和先進塗料技術提供的終身價值的影響。 EMEA(歐洲、中東和非洲)地區是一個受到嚴格監管的市場,歐盟國家在減少 VOC 和在塗料中使用無毒材料方面製定了特別嚴格的標準。儘管中東沒有那麼嚴格,但它正在迅速採用與歐洲類似的標準,部分原因是與歐盟國家的牢固貿易關係。在非洲,市場更加多元化,有些地區專注於具有成本效益的基礎塗料,而有些地區則逐漸轉向更專業的產品。
FPNV定位矩陣
FPNV定位矩陣對於評估工業被覆劑市場至關重要。我們檢視與業務策略和產品滿意度相關的關鍵指標,以對供應商進行全面評估。這種深入的分析使用戶能夠根據自己的要求做出資訊的決策。根據評估,供應商被分為四個成功程度不同的像限:前沿(F)、探路者(P)、利基(N)和重要(V)。
市場佔有率分析
市場佔有率分析是一種綜合工具,可以對工業被覆劑市場供應商的現狀進行深入而深入的研究。全面比較和分析供應商在整體收益、基本客群和其他關鍵指標方面的貢獻,以便更好地了解公司的績效及其在爭奪市場佔有率時面臨的挑戰。此外,該分析還提供了對該行業競爭特徵的寶貴考察,包括在研究基準年觀察到的累積、分散主導地位和合併特徵等因素。這種詳細程度的提高使供應商能夠做出更資訊的決策並制定有效的策略,從而在市場上獲得競爭優勢。
該報告對以下幾個方面提供了寶貴的見解:
1-市場滲透率:提供有關主要企業所服務的市場的全面資訊。
2-市場開拓:我們深入研究利潤豐厚的新興市場,並分析它們在成熟細分市場中的滲透率。
3- 市場多元化:提供有關新產品發布、開拓地區、最新發展和投資的詳細資訊。
4-競爭力評估與資訊:對主要企業的市場佔有率、策略、產品、認證、監管狀況、專利狀況、製造能力等進行全面評估。
5- 產品開發與創新:提供對未來技術、研發活動和突破性產品開發的見解。
本報告解決了以下關鍵問題:
1-工業被覆劑市場的市場規模和預測是多少?
2-工業被覆劑市場預測期間需要考慮投資的產品、細分市場、應用和領域有哪些?
3-工業被覆劑市場的技術趨勢和法律規範是什麼?
4-工業被覆劑市場主要供應商的市場佔有率是多少?
5-進入工業被覆劑市場合適的型態和策略手段是什麼?
目錄
第1章 前言
第2章調查方法
第3章執行摘要
第4章市場概況
第5章市場洞察
- 市場動態
- 促進因素
- 對高效製程和具有更好美觀性的耐用塗層的需求不斷增加
- 船舶和汽車產業對塗料的需求不斷成長
- 對環保工業被覆劑的需求不斷成長
- 抑制因素
- 水性塗料需要較長的乾燥時間
- 機會
- 粉末塗料在造船和管道領域呈現出誘人的前景
- 開發新技術以延長產品壽命並減少維護
- 任務
- 與工業被覆劑相關的環境問題
- 促進因素
- 市場區隔分析
- 樹脂類型:工業廠房和海洋環境中對環氧塗料的需求不斷增加
- 技術:由於卓越的耐用性和耐磨性,更多採用高固體分塗料
- 最終用戶:工業塗料在航太和汽車產業的重要用途
- 市場趨勢分析
- 高通膨的累積效應
- 波特五力分析
- 價值鍊和關鍵路徑分析
- 法律規範
第6章工業被覆劑市場:依樹脂類型
- 丙烯酸纖維
- 醇酸
- 胺基
- 環氧樹脂
- 氟樹脂
- 硝化纖維
第7章工業被覆劑市場:依技術分類
- 高固
- 粉末
- 溶劑型
- UV和EB固化技術
- 水性的
第8章工業被覆劑市場:依最終用戶分類
- 航太
- 車
- 一般工業用途
- 海洋
- 包裝
- 軌
第9章美洲工業被覆劑市場
- 阿根廷
- 巴西
- 加拿大
- 墨西哥
- 美國
第10章亞太工業被覆劑市場
- 澳洲
- 中國
- 印度
- 印尼
- 日本
- 馬來西亞
- 菲律賓
- 新加坡
- 韓國
- 台灣
- 泰國
- 越南
第11章歐洲、中東和非洲工業被覆劑市場
- 丹麥
- 埃及
- 芬蘭
- 法國
- 德國
- 以色列
- 義大利
- 荷蘭
- 奈及利亞
- 挪威
- 波蘭
- 卡達
- 俄羅斯
- 沙烏地阿拉伯
- 南非
- 西班牙
- 瑞典
- 瑞士
- 土耳其
- 阿拉伯聯合大公國
- 英國
第12章競爭形勢
- FPNV定位矩陣
- 市場佔有率分析:主要企業
- 主要企業競爭情境分析
- 併購
- 新產品發布和功能增強
第13章競爭產品組合
- 主要公司簡介
- Akzo Nobel NV
- Arkema SA
- Axalta Coating Systems, Ltd.
- BASF SE
- Chugoku Marine Paints, Ltd.
- Covestro AG
- DIC Corporation
- Hempel A/S
- Hexion Inc.
- Huntsman International LLC
- Kansai Paint Co., Ltd.
- KCC Corporation
- Kraton Corporation
- Kukdo Chemical Co Ltd
- Mitsui Chemicals, Inc
- Nippon Paint Holdings Co., Ltd.
- PPG Industries, Inc.
- RPM International Inc.
- SC Brenntag SRL
- Sika AG
- The Chemours Company FC, LLC
- The Sherwin-Williams Company
- Wacker Chemie AG
- 主要產品系列
第14章附錄
- 討論指南
- 關於許可證和定價
[199 Pages Report] The Industrial Coatings Market size was estimated at USD 106.42 billion in 2023 and expected to reach USD 110.59 billion in 2024, at a CAGR 4.43% to reach USD 144.17 billion by 2030.
Global Industrial Coatings Market
| KEY MARKET STATISTICS | |
|---|---|
| Base Year [2023] | USD 106.42 billion |
| Estimated Year [2024] | USD 110.59 billion |
| Forecast Year [2030] | USD 144.17 billion |
| CAGR (%) | 4.43% |
The industrial coatings market comprises sales of specialized paints and coatings used to protect and adorn the surfaces of industrial structures and equipment. These coatings are designed to resist corrosion, abrasion, and other environmental factors, extending life and improving the durability of the objects they cover. The increasing automobile production and demand for high-performance coatings for aesthetics, durability, and protection against harsh conditions has significantly increased the demand for industrial coatings. Moreover, global government initiatives for infrastructure development have increased the demand for coatings to protect and enhance the longevity of structures. However, volatile raw material prices and stringent regulations regarding the usage of solvent-borne coatings pose significant challenges. Moreover, potential disruptions in the supply chain due to factors such as raw material shortages, transportation issues, or geopolitical tensions can hamper the market's growth. Furthermore, technological advancements such as self-healing, anti-microbial, and smart coatings present significant potential for market expansion. Growing industrialization and urbanization in developing economies can create significant growth opportunities for the increased use of industrial coatings.
Regional Insights
The APAC region is rapidly expanding in terms of industrial coatings demand, largely due to the booming industrial and manufacturing sectors in China, Japan, and India. Customers in APAC have shown a strong preference for environmentally friendly coatings, driving manufacturers to invest in green technologies and water-based coatings. High-performance anti-corrosion coatings for the automotive and marine industries are particularly in demand, translating to an increased focus on research into durable and sustainable coatings. In the Americas, the United States is experiencing a steady demand for high-quality, innovative coatings products, and Canada's market is experiencing growth aligned with its expanding oil and gas sector that demands specialized pipeline coatings. There is a significant trend towards eco-friendly coatings in the Americas, driven by stringent environmental regulations and consumer awareness. Purchases in the Americas region are largely influenced by long-term cost savings through energy-efficient coatings and the lifetime value that advanced coatings technologies offer. In the EMEA region, the EU countries exhibit a well-regulated market with stringent standards, particularly concerning reducing VOCs and using non-toxic materials in coatings. The Middle East, while less stringent, is rapidly adopting similar European norms, partly due to its strong trade ties with EU countries. In Africa, the market is more diversified, with certain regions focusing on cost-effective and basic coatings while others are slowly moving towards more specialized products.
FPNV Positioning Matrix
The FPNV Positioning Matrix is pivotal in evaluating the Industrial Coatings Market. It offers a comprehensive assessment of vendors, examining key metrics related to Business Strategy and Product Satisfaction. This in-depth analysis empowers users to make well-informed decisions aligned with their requirements. Based on the evaluation, the vendors are then categorized into four distinct quadrants representing varying levels of success: Forefront (F), Pathfinder (P), Niche (N), or Vital (V).
Market Share Analysis
The Market Share Analysis is a comprehensive tool that provides an insightful and in-depth examination of the current state of vendors in the Industrial Coatings Market. By meticulously comparing and analyzing vendor contributions in terms of overall revenue, customer base, and other key metrics, we can offer companies a greater understanding of their performance and the challenges they face when competing for market share. Additionally, this analysis provides valuable insights into the competitive nature of the sector, including factors such as accumulation, fragmentation dominance, and amalgamation traits observed over the base year period studied. With this expanded level of detail, vendors can make more informed decisions and devise effective strategies to gain a competitive edge in the market.
Key Company Profiles
The report delves into recent significant developments in the Industrial Coatings Market, highlighting leading vendors and their innovative profiles. These include Akzo Nobel N.V., Arkema S.A., Axalta Coating Systems, Ltd., BASF SE, Chugoku Marine Paints, Ltd., Covestro AG, DIC Corporation, Hempel A/S, Hexion Inc., Huntsman International LLC, Kansai Paint Co., Ltd., KCC Corporation, Kraton Corporation, Kukdo Chemical Co Ltd, Mitsui Chemicals, Inc, Nippon Paint Holdings Co., Ltd., PPG Industries, Inc., RPM International Inc., S.C. Brenntag S.R.L., Sika AG, The Chemours Company FC, LLC, The Sherwin-Williams Company, and Wacker Chemie AG.
Market Segmentation & Coverage
This research report categorizes the Industrial Coatings Market to forecast the revenues and analyze trends in each of the following sub-markets:
- Resin Type
- Acrylic
- Alkyd
- Amino
- Epoxy
- Fluoropolymer
- Nitrocellulose
- Technology
- High Solids
- Powder
- Solvent-Based
- UV- & EB-Cured Technology
- Water-Based
- End-Users
- Aerospace
- Automotive
- General Industrial
- Marine
- Packaging
- Rail
- Region
- Americas
- Argentina
- Brazil
- Canada
- Mexico
- United States
- California
- Florida
- Illinois
- New York
- Ohio
- Pennsylvania
- Texas
- Asia-Pacific
- Australia
- China
- India
- Indonesia
- Japan
- Malaysia
- Philippines
- Singapore
- South Korea
- Taiwan
- Thailand
- Vietnam
- Europe, Middle East & Africa
- Denmark
- Egypt
- Finland
- France
- Germany
- Israel
- Italy
- Netherlands
- Nigeria
- Norway
- Poland
- Qatar
- Russia
- Saudi Arabia
- South Africa
- Spain
- Sweden
- Switzerland
- Turkey
- United Arab Emirates
- United Kingdom
- Americas
The report offers valuable insights on the following aspects:
1. Market Penetration: It presents comprehensive information on the market provided by key players.
2. Market Development: It delves deep into lucrative emerging markets and analyzes the penetration across mature market segments.
3. Market Diversification: It provides detailed information on new product launches, untapped geographic regions, recent developments, and investments.
4. Competitive Assessment & Intelligence: It conducts an exhaustive assessment of market shares, strategies, products, certifications, regulatory approvals, patent landscape, and manufacturing capabilities of the leading players.
5. Product Development & Innovation: It offers intelligent insights on future technologies, R&D activities, and breakthrough product developments.
The report addresses key questions such as:
1. What is the market size and forecast of the Industrial Coatings Market?
2. Which products, segments, applications, and areas should one consider investing in over the forecast period in the Industrial Coatings Market?
3. What are the technology trends and regulatory frameworks in the Industrial Coatings Market?
4. What is the market share of the leading vendors in the Industrial Coatings Market?
5. Which modes and strategic moves are suitable for entering the Industrial Coatings Market?
Table of Contents
1. Preface
- 1.1. Objectives of the Study
- 1.2. Market Segmentation & Coverage
- 1.3. Years Considered for the Study
- 1.4. Currency & Pricing
- 1.5. Language
- 1.6. Limitations
- 1.7. Assumptions
- 1.8. Stakeholders
2. Research Methodology
- 2.1. Define: Research Objective
- 2.2. Determine: Research Design
- 2.3. Prepare: Research Instrument
- 2.4. Collect: Data Source
- 2.5. Analyze: Data Interpretation
- 2.6. Formulate: Data Verification
- 2.7. Publish: Research Report
- 2.8. Repeat: Report Update
3. Executive Summary
4. Market Overview
- 4.1. Introduction
- 4.2. Industrial Coatings Market, by Region
5. Market Insights
- 5.1. Market Dynamics
- 5.1.1. Drivers
- 5.1.1.1. Growing need for efficient process and durable coatings with better aesthetics
- 5.1.1.2. Rising demand in the coatings for the marine and automotive industries
- 5.1.1.3. Increasing demand for environmentally-friendly industrial coatings
- 5.1.2. Restraints
- 5.1.2.1. Requirement of more drying time for water-based coatings
- 5.1.3. Opportunities
- 5.1.3.1. Emergence of attractive prospects for powder coatings in shipbuilding and pipeline sectors
- 5.1.3.2. Development of new technologies for increased product lifetime and reduced maintenance
- 5.1.4. Challenges
- 5.1.4.1. Environmental concerns associated with industrial coatings
- 5.1.1. Drivers
- 5.2. Market Segmentation Analysis
- 5.2.1. Resin Type: Growing demand for epoxy coatings in industrial plants and marine settings
- 5.2.2. Technology: Increasing adoption of high solids coatings due to their outstanding durability and resistance to abrasion
- 5.2.3. End-Users: Significant use of industrial coating in the aerospace and automotive industry
- 5.3. Market Trend Analysis
- 5.4. Cumulative Impact of High Inflation
- 5.5. Porter's Five Forces Analysis
- 5.5.1. Threat of New Entrants
- 5.5.2. Threat of Substitutes
- 5.5.3. Bargaining Power of Customers
- 5.5.4. Bargaining Power of Suppliers
- 5.5.5. Industry Rivalry
- 5.6. Value Chain & Critical Path Analysis
- 5.7. Regulatory Framework
6. Industrial Coatings Market, by Resin Type
- 6.1. Introduction
- 6.2. Acrylic
- 6.3. Alkyd
- 6.4. Amino
- 6.5. Epoxy
- 6.6. Fluoropolymer
- 6.7. Nitrocellulose
7. Industrial Coatings Market, by Technology
- 7.1. Introduction
- 7.2. High Solids
- 7.3. Powder
- 7.4. Solvent-Based
- 7.5. UV- & EB-Cured Technology
- 7.6. Water-Based
8. Industrial Coatings Market, by End-Users
- 8.1. Introduction
- 8.2. Aerospace
- 8.3. Automotive
- 8.4. General Industrial
- 8.5. Marine
- 8.6. Packaging
- 8.7. Rail
9. Americas Industrial Coatings Market
- 9.1. Introduction
- 9.2. Argentina
- 9.3. Brazil
- 9.4. Canada
- 9.5. Mexico
- 9.6. United States
10. Asia-Pacific Industrial Coatings Market
- 10.1. Introduction
- 10.2. Australia
- 10.3. China
- 10.4. India
- 10.5. Indonesia
- 10.6. Japan
- 10.7. Malaysia
- 10.8. Philippines
- 10.9. Singapore
- 10.10. South Korea
- 10.11. Taiwan
- 10.12. Thailand
- 10.13. Vietnam
11. Europe, Middle East & Africa Industrial Coatings Market
- 11.1. Introduction
- 11.2. Denmark
- 11.3. Egypt
- 11.4. Finland
- 11.5. France
- 11.6. Germany
- 11.7. Israel
- 11.8. Italy
- 11.9. Netherlands
- 11.10. Nigeria
- 11.11. Norway
- 11.12. Poland
- 11.13. Qatar
- 11.14. Russia
- 11.15. Saudi Arabia
- 11.16. South Africa
- 11.17. Spain
- 11.18. Sweden
- 11.19. Switzerland
- 11.20. Turkey
- 11.21. United Arab Emirates
- 11.22. United Kingdom
12. Competitive Landscape
- 12.1. FPNV Positioning Matrix
- 12.2. Market Share Analysis, By Key Player
- 12.3. Competitive Scenario Analysis, By Key Player
- 12.3.1. Merger & Acquisition
- 12.3.1.1. Nippon Paint India Acquires Vibgyor Paints and Chemicals
- 12.3.2. New Product Launch & Enhancement
- 12.3.2.1. Advancion Launches Multi-Functional Etheramine for Waterborne Industrial Coatings
- 12.3.2.2. Clariant To Showcase New Portfolio Of Industrial Coatings and PTFE-Free Additives at Chinacoat 2023
- 12.3.1. Merger & Acquisition
13. Competitive Portfolio
- 13.1. Key Company Profiles
- 13.1.1. Akzo Nobel N.V.
- 13.1.2. Arkema S.A.
- 13.1.3. Axalta Coating Systems, Ltd.
- 13.1.4. BASF SE
- 13.1.5. Chugoku Marine Paints, Ltd.
- 13.1.6. Covestro AG
- 13.1.7. DIC Corporation
- 13.1.8. Hempel A/S
- 13.1.9. Hexion Inc.
- 13.1.10. Huntsman International LLC
- 13.1.11. Kansai Paint Co., Ltd.
- 13.1.12. KCC Corporation
- 13.1.13. Kraton Corporation
- 13.1.14. Kukdo Chemical Co Ltd
- 13.1.15. Mitsui Chemicals, Inc
- 13.1.16. Nippon Paint Holdings Co., Ltd.
- 13.1.17. PPG Industries, Inc.
- 13.1.18. RPM International Inc.
- 13.1.19. S.C. Brenntag S.R.L.
- 13.1.20. Sika AG
- 13.1.21. The Chemours Company FC, LLC
- 13.1.22. The Sherwin-Williams Company
- 13.1.23. Wacker Chemie AG
- 13.2. Key Product Portfolio
14. Appendix
- 14.1. Discussion Guide
- 14.2. License & Pricing
LIST OF FIGURES
- FIGURE 1. INDUSTRIAL COATINGS MARKET RESEARCH PROCESS
- FIGURE 2. INDUSTRIAL COATINGS MARKET SIZE, 2023 VS 2030
- FIGURE 3. INDUSTRIAL COATINGS MARKET SIZE, 2018-2030 (USD MILLION)
- FIGURE 4. INDUSTRIAL COATINGS MARKET SIZE, BY REGION, 2023 VS 2030 (%)
- FIGURE 5. INDUSTRIAL COATINGS MARKET SIZE, BY REGION, 2023 VS 2024 VS 2030 (USD MILLION)
- FIGURE 6. INDUSTRIAL COATINGS MARKET DYNAMICS
- FIGURE 7. INDUSTRIAL COATINGS MARKET SIZE, BY RESIN TYPE, 2023 VS 2030 (%)
- FIGURE 8. INDUSTRIAL COATINGS MARKET SIZE, BY RESIN TYPE, 2023 VS 2024 VS 2030 (USD MILLION)
- FIGURE 9. INDUSTRIAL COATINGS MARKET SIZE, BY TECHNOLOGY, 2023 VS 2030 (%)
- FIGURE 10. INDUSTRIAL COATINGS MARKET SIZE, BY TECHNOLOGY, 2023 VS 2024 VS 2030 (USD MILLION)
- FIGURE 11. INDUSTRIAL COATINGS MARKET SIZE, BY END-USERS, 2023 VS 2030 (%)
- FIGURE 12. INDUSTRIAL COATINGS MARKET SIZE, BY END-USERS, 2023 VS 2024 VS 2030 (USD MILLION)
- FIGURE 13. AMERICAS INDUSTRIAL COATINGS MARKET SIZE, BY COUNTRY, 2023 VS 2030 (%)
- FIGURE 14. AMERICAS INDUSTRIAL COATINGS MARKET SIZE, BY COUNTRY, 2023 VS 2024 VS 2030 (USD MILLION)
- FIGURE 15. UNITED STATES INDUSTRIAL COATINGS MARKET SIZE, BY STATE, 2023 VS 2030 (%)
- FIGURE 16. UNITED STATES INDUSTRIAL COATINGS MARKET SIZE, BY STATE, 2023 VS 2024 VS 2030 (USD MILLION)
- FIGURE 17. ASIA-PACIFIC INDUSTRIAL COATINGS MARKET SIZE, BY COUNTRY, 2023 VS 2030 (%)
- FIGURE 18. ASIA-PACIFIC INDUSTRIAL COATINGS MARKET SIZE, BY COUNTRY, 2023 VS 2024 VS 2030 (USD MILLION)
- FIGURE 19. EUROPE, MIDDLE EAST & AFRICA INDUSTRIAL COATINGS MARKET SIZE, BY COUNTRY, 2023 VS 2030 (%)
- FIGURE 20. EUROPE, MIDDLE EAST & AFRICA INDUSTRIAL COATINGS MARKET SIZE, BY COUNTRY, 2023 VS 2024 VS 2030 (USD MILLION)
- FIGURE 21. INDUSTRIAL COATINGS MARKET, FPNV POSITIONING MATRIX, 2023
- FIGURE 22. INDUSTRIAL COATINGS MARKET SHARE, BY KEY PLAYER, 2023
LIST OF TABLES
- TABLE 1. INDUSTRIAL COATINGS MARKET SEGMENTATION & COVERAGE
- TABLE 2. UNITED STATES DOLLAR EXCHANGE RATE, 2018-2023
- TABLE 3. INDUSTRIAL COATINGS MARKET SIZE, 2018-2030 (USD MILLION)
- TABLE 4. GLOBAL INDUSTRIAL COATINGS MARKET SIZE, BY REGION, 2018-2030 (USD MILLION)
- TABLE 5. INDUSTRIAL COATINGS MARKET SIZE, BY RESIN TYPE, 2018-2030 (USD MILLION)
- TABLE 6. INDUSTRIAL COATINGS MARKET SIZE, BY ACRYLIC, BY REGION, 2018-2030 (USD MILLION)
- TABLE 7. INDUSTRIAL COATINGS MARKET SIZE, BY ALKYD, BY REGION, 2018-2030 (USD MILLION)
- TABLE 8. INDUSTRIAL COATINGS MARKET SIZE, BY AMINO, BY REGION, 2018-2030 (USD MILLION)
- TABLE 9. INDUSTRIAL COATINGS MARKET SIZE, BY EPOXY, BY REGION, 2018-2030 (USD MILLION)
- TABLE 10. INDUSTRIAL COATINGS MARKET SIZE, BY FLUOROPOLYMER, BY REGION, 2018-2030 (USD MILLION)
- TABLE 11. INDUSTRIAL COATINGS MARKET SIZE, BY NITROCELLULOSE, BY REGION, 2018-2030 (USD MILLION)
- TABLE 12. INDUSTRIAL COATINGS MARKET SIZE, BY TECHNOLOGY, 2018-2030 (USD MILLION)
- TABLE 13. INDUSTRIAL COATINGS MARKET SIZE, BY HIGH SOLIDS, BY REGION, 2018-2030 (USD MILLION)
- TABLE 14. INDUSTRIAL COATINGS MARKET SIZE, BY POWDER, BY REGION, 2018-2030 (USD MILLION)
- TABLE 15. INDUSTRIAL COATINGS MARKET SIZE, BY SOLVENT-BASED, BY REGION, 2018-2030 (USD MILLION)
- TABLE 16. INDUSTRIAL COATINGS MARKET SIZE, BY UV- & EB-CURED TECHNOLOGY, BY REGION, 2018-2030 (USD MILLION)
- TABLE 17. INDUSTRIAL COATINGS MARKET SIZE, BY WATER-BASED, BY REGION, 2018-2030 (USD MILLION)
- TABLE 18. INDUSTRIAL COATINGS MARKET SIZE, BY END-USERS, 2018-2030 (USD MILLION)
- TABLE 19. INDUSTRIAL COATINGS MARKET SIZE, BY AEROSPACE, BY REGION, 2018-2030 (USD MILLION)
- TABLE 20. INDUSTRIAL COATINGS MARKET SIZE, BY AUTOMOTIVE, BY REGION, 2018-2030 (USD MILLION)
- TABLE 21. INDUSTRIAL COATINGS MARKET SIZE, BY GENERAL INDUSTRIAL, BY REGION, 2018-2030 (USD MILLION)
- TABLE 22. INDUSTRIAL COATINGS MARKET SIZE, BY MARINE, BY REGION, 2018-2030 (USD MILLION)
- TABLE 23. INDUSTRIAL COATINGS MARKET SIZE, BY PACKAGING, BY REGION, 2018-2030 (USD MILLION)
- TABLE 24. INDUSTRIAL COATINGS MARKET SIZE, BY RAIL, BY REGION, 2018-2030 (USD MILLION)
- TABLE 25. AMERICAS INDUSTRIAL COATINGS MARKET SIZE, BY RESIN TYPE, 2018-2030 (USD MILLION)
- TABLE 26. AMERICAS INDUSTRIAL COATINGS MARKET SIZE, BY TECHNOLOGY, 2018-2030 (USD MILLION)
- TABLE 27. AMERICAS INDUSTRIAL COATINGS MARKET SIZE, BY END-USERS, 2018-2030 (USD MILLION)
- TABLE 28. AMERICAS INDUSTRIAL COATINGS MARKET SIZE, BY COUNTRY, 2018-2030 (USD MILLION)
- TABLE 29. ARGENTINA INDUSTRIAL COATINGS MARKET SIZE, BY RESIN TYPE, 2018-2030 (USD MILLION)
- TABLE 30. ARGENTINA INDUSTRIAL COATINGS MARKET SIZE, BY TECHNOLOGY, 2018-2030 (USD MILLION)
- TABLE 31. ARGENTINA INDUSTRIAL COATINGS MARKET SIZE, BY END-USERS, 2018-2030 (USD MILLION)
- TABLE 32. BRAZIL INDUSTRIAL COATINGS MARKET SIZE, BY RESIN TYPE, 2018-2030 (USD MILLION)
- TABLE 33. BRAZIL INDUSTRIAL COATINGS MARKET SIZE, BY TECHNOLOGY, 2018-2030 (USD MILLION)
- TABLE 34. BRAZIL INDUSTRIAL COATINGS MARKET SIZE, BY END-USERS, 2018-2030 (USD MILLION)
- TABLE 35. CANADA INDUSTRIAL COATINGS MARKET SIZE, BY RESIN TYPE, 2018-2030 (USD MILLION)
- TABLE 36. CANADA INDUSTRIAL COATINGS MARKET SIZE, BY TECHNOLOGY, 2018-2030 (USD MILLION)
- TABLE 37. CANADA INDUSTRIAL COATINGS MARKET SIZE, BY END-USERS, 2018-2030 (USD MILLION)
- TABLE 38. MEXICO INDUSTRIAL COATINGS MARKET SIZE, BY RESIN TYPE, 2018-2030 (USD MILLION)
- TABLE 39. MEXICO INDUSTRIAL COATINGS MARKET SIZE, BY TECHNOLOGY, 2018-2030 (USD MILLION)
- TABLE 40. MEXICO INDUSTRIAL COATINGS MARKET SIZE, BY END-USERS, 2018-2030 (USD MILLION)
- TABLE 41. UNITED STATES INDUSTRIAL COATINGS MARKET SIZE, BY RESIN TYPE, 2018-2030 (USD MILLION)
- TABLE 42. UNITED STATES INDUSTRIAL COATINGS MARKET SIZE, BY TECHNOLOGY, 2018-2030 (USD MILLION)
- TABLE 43. UNITED STATES INDUSTRIAL COATINGS MARKET SIZE, BY END-USERS, 2018-2030 (USD MILLION)
- TABLE 44. UNITED STATES INDUSTRIAL COATINGS MARKET SIZE, BY STATE, 2018-2030 (USD MILLION)
- TABLE 45. ASIA-PACIFIC INDUSTRIAL COATINGS MARKET SIZE, BY RESIN TYPE, 2018-2030 (USD MILLION)
- TABLE 46. ASIA-PACIFIC INDUSTRIAL COATINGS MARKET SIZE, BY TECHNOLOGY, 2018-2030 (USD MILLION)
- TABLE 47. ASIA-PACIFIC INDUSTRIAL COATINGS MARKET SIZE, BY END-USERS, 2018-2030 (USD MILLION)
- TABLE 48. ASIA-PACIFIC INDUSTRIAL COATINGS MARKET SIZE, BY COUNTRY, 2018-2030 (USD MILLION)
- TABLE 49. AUSTRALIA INDUSTRIAL COATINGS MARKET SIZE, BY RESIN TYPE, 2018-2030 (USD MILLION)
- TABLE 50. AUSTRALIA INDUSTRIAL COATINGS MARKET SIZE, BY TECHNOLOGY, 2018-2030 (USD MILLION)
- TABLE 51. AUSTRALIA INDUSTRIAL COATINGS MARKET SIZE, BY END-USERS, 2018-2030 (USD MILLION)
- TABLE 52. CHINA INDUSTRIAL COATINGS MARKET SIZE, BY RESIN TYPE, 2018-2030 (USD MILLION)
- TABLE 53. CHINA INDUSTRIAL COATINGS MARKET SIZE, BY TECHNOLOGY, 2018-2030 (USD MILLION)
- TABLE 54. CHINA INDUSTRIAL COATINGS MARKET SIZE, BY END-USERS, 2018-2030 (USD MILLION)
- TABLE 55. INDIA INDUSTRIAL COATINGS MARKET SIZE, BY RESIN TYPE, 2018-2030 (USD MILLION)
- TABLE 56. INDIA INDUSTRIAL COATINGS MARKET SIZE, BY TECHNOLOGY, 2018-2030 (USD MILLION)
- TABLE 57. INDIA INDUSTRIAL COATINGS MARKET SIZE, BY END-USERS, 2018-2030 (USD MILLION)
- TABLE 58. INDONESIA INDUSTRIAL COATINGS MARKET SIZE, BY RESIN TYPE, 2018-2030 (USD MILLION)
- TABLE 59. INDONESIA INDUSTRIAL COATINGS MARKET SIZE, BY TECHNOLOGY, 2018-2030 (USD MILLION)
- TABLE 60. INDONESIA INDUSTRIAL COATINGS MARKET SIZE, BY END-USERS, 2018-2030 (USD MILLION)
- TABLE 61. JAPAN INDUSTRIAL COATINGS MARKET SIZE, BY RESIN TYPE, 2018-2030 (USD MILLION)
- TABLE 62. JAPAN INDUSTRIAL COATINGS MARKET SIZE, BY TECHNOLOGY, 2018-2030 (USD MILLION)
- TABLE 63. JAPAN INDUSTRIAL COATINGS MARKET SIZE, BY END-USERS, 2018-2030 (USD MILLION)
- TABLE 64. MALAYSIA INDUSTRIAL COATINGS MARKET SIZE, BY RESIN TYPE, 2018-2030 (USD MILLION)
- TABLE 65. MALAYSIA INDUSTRIAL COATINGS MARKET SIZE, BY TECHNOLOGY, 2018-2030 (USD MILLION)
- TABLE 66. MALAYSIA INDUSTRIAL COATINGS MARKET SIZE, BY END-USERS, 2018-2030 (USD MILLION)
- TABLE 67. PHILIPPINES INDUSTRIAL COATINGS MARKET SIZE, BY RESIN TYPE, 2018-2030 (USD MILLION)
- TABLE 68. PHILIPPINES INDUSTRIAL COATINGS MARKET SIZE, BY TECHNOLOGY, 2018-2030 (USD MILLION)
- TABLE 69. PHILIPPINES INDUSTRIAL COATINGS MARKET SIZE, BY END-USERS, 2018-2030 (USD MILLION)
- TABLE 70. SINGAPORE INDUSTRIAL COATINGS MARKET SIZE, BY RESIN TYPE, 2018-2030 (USD MILLION)
- TABLE 71. SINGAPORE INDUSTRIAL COATINGS MARKET SIZE, BY TECHNOLOGY, 2018-2030 (USD MILLION)
- TABLE 72. SINGAPORE INDUSTRIAL COATINGS MARKET SIZE, BY END-USERS, 2018-2030 (USD MILLION)
- TABLE 73. SOUTH KOREA INDUSTRIAL COATINGS MARKET SIZE, BY RESIN TYPE, 2018-2030 (USD MILLION)
- TABLE 74. SOUTH KOREA INDUSTRIAL COATINGS MARKET SIZE, BY TECHNOLOGY, 2018-2030 (USD MILLION)
- TABLE 75. SOUTH KOREA INDUSTRIAL COATINGS MARKET SIZE, BY END-USERS, 2018-2030 (USD MILLION)
- TABLE 76. TAIWAN INDUSTRIAL COATINGS MARKET SIZE, BY RESIN TYPE, 2018-2030 (USD MILLION)
- TABLE 77. TAIWAN INDUSTRIAL COATINGS MARKET SIZE, BY TECHNOLOGY, 2018-2030 (USD MILLION)
- TABLE 78. TAIWAN INDUSTRIAL COATINGS MARKET SIZE, BY END-USERS, 2018-2030 (USD MILLION)
- TABLE 79. THAILAND INDUSTRIAL COATINGS MARKET SIZE, BY RESIN TYPE, 2018-2030 (USD MILLION)
- TABLE 80. THAILAND INDUSTRIAL COATINGS MARKET SIZE, BY TECHNOLOGY, 2018-2030 (USD MILLION)
- TABLE 81. THAILAND INDUSTRIAL COATINGS MARKET SIZE, BY END-USERS, 2018-2030 (USD MILLION)
- TABLE 82. VIETNAM INDUSTRIAL COATINGS MARKET SIZE, BY RESIN TYPE, 2018-2030 (USD MILLION)
- TABLE 83. VIETNAM INDUSTRIAL COATINGS MARKET SIZE, BY TECHNOLOGY, 2018-2030 (USD MILLION)
- TABLE 84. VIETNAM INDUSTRIAL COATINGS MARKET SIZE, BY END-USERS, 2018-2030 (USD MILLION)
- TABLE 85. EUROPE, MIDDLE EAST & AFRICA INDUSTRIAL COATINGS MARKET SIZE, BY RESIN TYPE, 2018-2030 (USD MILLION)
- TABLE 86. EUROPE, MIDDLE EAST & AFRICA INDUSTRIAL COATINGS MARKET SIZE, BY TECHNOLOGY, 2018-2030 (USD MILLION)
- TABLE 87. EUROPE, MIDDLE EAST & AFRICA INDUSTRIAL COATINGS MARKET SIZE, BY END-USERS, 2018-2030 (USD MILLION)
- TABLE 88. EUROPE, MIDDLE EAST & AFRICA INDUSTRIAL COATINGS MARKET SIZE, BY COUNTRY, 2018-2030 (USD MILLION)
- TABLE 89. DENMARK INDUSTRIAL COATINGS MARKET SIZE, BY RESIN TYPE, 2018-2030 (USD MILLION)
- TABLE 90. DENMARK INDUSTRIAL COATINGS MARKET SIZE, BY TECHNOLOGY, 2018-2030 (USD MILLION)
- TABLE 91. DENMARK INDUSTRIAL COATINGS MARKET SIZE, BY END-USERS, 2018-2030 (USD MILLION)
- TABLE 92. EGYPT INDUSTRIAL COATINGS MARKET SIZE, BY RESIN TYPE, 2018-2030 (USD MILLION)
- TABLE 93. EGYPT INDUSTRIAL COATINGS MARKET SIZE, BY TECHNOLOGY, 2018-2030 (USD MILLION)
- TABLE 94. EGYPT INDUSTRIAL COATINGS MARKET SIZE, BY END-USERS, 2018-2030 (USD MILLION)
- TABLE 95. FINLAND INDUSTRIAL COATINGS MARKET SIZE, BY RESIN TYPE, 2018-2030 (USD MILLION)
- TABLE 96. FINLAND INDUSTRIAL COATINGS MARKET SIZE, BY TECHNOLOGY, 2018-2030 (USD MILLION)
- TABLE 97. FINLAND INDUSTRIAL COATINGS MARKET SIZE, BY END-USERS, 2018-2030 (USD MILLION)
- TABLE 98. FRANCE INDUSTRIAL COATINGS MARKET SIZE, BY RESIN TYPE, 2018-2030 (USD MILLION)
- TABLE 99. FRANCE INDUSTRIAL COATINGS MARKET SIZE, BY TECHNOLOGY, 2018-2030 (USD MILLION)
- TABLE 100. FRANCE INDUSTRIAL COATINGS MARKET SIZE, BY END-USERS, 2018-2030 (USD MILLION)
- TABLE 101. GERMANY INDUSTRIAL COATINGS MARKET SIZE, BY RESIN TYPE, 2018-2030 (USD MILLION)
- TABLE 102. GERMANY INDUSTRIAL COATINGS MARKET SIZE, BY TECHNOLOGY, 2018-2030 (USD MILLION)
- TABLE 103. GERMANY INDUSTRIAL COATINGS MARKET SIZE, BY END-USERS, 2018-2030 (USD MILLION)
- TABLE 104. ISRAEL INDUSTRIAL COATINGS MARKET SIZE, BY RESIN TYPE, 2018-2030 (USD MILLION)
- TABLE 105. ISRAEL INDUSTRIAL COATINGS MARKET SIZE, BY TECHNOLOGY, 2018-2030 (USD MILLION)
- TABLE 106. ISRAEL INDUSTRIAL COATINGS MARKET SIZE, BY END-USERS, 2018-2030 (USD MILLION)
- TABLE 107. ITALY INDUSTRIAL COATINGS MARKET SIZE, BY RESIN TYPE, 2018-2030 (USD MILLION)
- TABLE 108. ITALY INDUSTRIAL COATINGS MARKET SIZE, BY TECHNOLOGY, 2018-2030 (USD MILLION)
- TABLE 109. ITALY INDUSTRIAL COATINGS MARKET SIZE, BY END-USERS, 2018-2030 (USD MILLION)
- TABLE 110. NETHERLANDS INDUSTRIAL COATINGS MARKET SIZE, BY RESIN TYPE, 2018-2030 (USD MILLION)
- TABLE 111. NETHERLANDS INDUSTRIAL COATINGS MARKET SIZE, BY TECHNOLOGY, 2018-2030 (USD MILLION)
- TABLE 112. NETHERLANDS INDUSTRIAL COATINGS MARKET SIZE, BY END-USERS, 2018-2030 (USD MILLION)
- TABLE 113. NIGERIA INDUSTRIAL COATINGS MARKET SIZE, BY RESIN TYPE, 2018-2030 (USD MILLION)
- TABLE 114. NIGERIA INDUSTRIAL COATINGS MARKET SIZE, BY TECHNOLOGY, 2018-2030 (USD MILLION)
- TABLE 115. NIGERIA INDUSTRIAL COATINGS MARKET SIZE, BY END-USERS, 2018-2030 (USD MILLION)
- TABLE 116. NORWAY INDUSTRIAL COATINGS MARKET SIZE, BY RESIN TYPE, 2018-2030 (USD MILLION)
- TABLE 117. NORWAY INDUSTRIAL COATINGS MARKET SIZE, BY TECHNOLOGY, 2018-2030 (USD MILLION)
- TABLE 118. NORWAY INDUSTRIAL COATINGS MARKET SIZE, BY END-USERS, 2018-2030 (USD MILLION)
- TABLE 119. POLAND INDUSTRIAL COATINGS MARKET SIZE, BY RESIN TYPE, 2018-2030 (USD MILLION)
- TABLE 120. POLAND INDUSTRIAL COATINGS MARKET SIZE, BY TECHNOLOGY, 2018-2030 (USD MILLION)
- TABLE 121. POLAND INDUSTRIAL COATINGS MARKET SIZE, BY END-USERS, 2018-2030 (USD MILLION)
- TABLE 122. QATAR INDUSTRIAL COATINGS MARKET SIZE, BY RESIN TYPE, 2018-2030 (USD MILLION)
- TABLE 123. QATAR INDUSTRIAL COATINGS MARKET SIZE, BY TECHNOLOGY, 2018-2030 (USD MILLION)
- TABLE 124. QATAR INDUSTRIAL COATINGS MARKET SIZE, BY END-USERS, 2018-2030 (USD MILLION)
- TABLE 125. RUSSIA INDUSTRIAL COATINGS MARKET SIZE, BY RESIN TYPE, 2018-2030 (USD MILLION)
- TABLE 126. RUSSIA INDUSTRIAL COATINGS MARKET SIZE, BY TECHNOLOGY, 2018-2030 (USD MILLION)
- TABLE 127. RUSSIA INDUSTRIAL COATINGS MARKET SIZE, BY END-USERS, 2018-2030 (USD MILLION)
- TABLE 128. SAUDI ARABIA INDUSTRIAL COATINGS MARKET SIZE, BY RESIN TYPE, 2018-2030 (USD MILLION)
- TABLE 129. SAUDI ARABIA INDUSTRIAL COATINGS MARKET SIZE, BY TECHNOLOGY, 2018-2030 (USD MILLION)
- TABLE 130. SAUDI ARABIA INDUSTRIAL COATINGS MARKET SIZE, BY END-USERS, 2018-2030 (USD MILLION)
- TABLE 131. SOUTH AFRICA INDUSTRIAL COATINGS MARKET SIZE, BY RESIN TYPE, 2018-2030 (USD MILLION)
- TABLE 132. SOUTH AFRICA INDUSTRIAL COATINGS MARKET SIZE, BY TECHNOLOGY, 2018-2030 (USD MILLION)
- TABLE 133. SOUTH AFRICA INDUSTRIAL COATINGS MARKET SIZE, BY END-USERS, 2018-2030 (USD MILLION)
- TABLE 134. SPAIN INDUSTRIAL COATINGS MARKET SIZE, BY RESIN TYPE, 2018-2030 (USD MILLION)
- TABLE 135. SPAIN INDUSTRIAL COATINGS MARKET SIZE, BY TECHNOLOGY, 2018-2030 (USD MILLION)
- TABLE 136. SPAIN INDUSTRIAL COATINGS MARKET SIZE, BY END-USERS, 2018-2030 (USD MILLION)
- TABLE 137. SWEDEN INDUSTRIAL COATINGS MARKET SIZE, BY RESIN TYPE, 2018-2030 (USD MILLION)
- TABLE 138. SWEDEN INDUSTRIAL COATINGS MARKET SIZE, BY TECHNOLOGY, 2018-2030 (USD MILLION)
- TABLE 139. SWEDEN INDUSTRIAL COATINGS MARKET SIZE, BY END-USERS, 2018-2030 (USD MILLION)
- TABLE 140. SWITZERLAND INDUSTRIAL COATINGS MARKET SIZE, BY RESIN TYPE, 2018-2030 (USD MILLION)
- TABLE 141. SWITZERLAND INDUSTRIAL COATINGS MARKET SIZE, BY TECHNOLOGY, 2018-2030 (USD MILLION)
- TABLE 142. SWITZERLAND INDUSTRIAL COATINGS MARKET SIZE, BY END-USERS, 2018-2030 (USD MILLION)
- TABLE 143. TURKEY INDUSTRIAL COATINGS MARKET SIZE, BY RESIN TYPE, 2018-2030 (USD MILLION)
- TABLE 144. TURKEY INDUSTRIAL COATINGS MARKET SIZE, BY TECHNOLOGY, 2018-2030 (USD MILLION)
- TABLE 145. TURKEY INDUSTRIAL COATINGS MARKET SIZE, BY END-USERS, 2018-2030 (USD MILLION)
- TABLE 146. UNITED ARAB EMIRATES INDUSTRIAL COATINGS MARKET SIZE, BY RESIN TYPE, 2018-2030 (USD MILLION)
- TABLE 147. UNITED ARAB EMIRATES INDUSTRIAL COATINGS MARKET SIZE, BY TECHNOLOGY, 2018-2030 (USD MILLION)
- TABLE 148. UNITED ARAB EMIRATES INDUSTRIAL COATINGS MARKET SIZE, BY END-USERS, 2018-2030 (USD MILLION)
- TABLE 149. UNITED KINGDOM INDUSTRIAL COATINGS MARKET SIZE, BY RESIN TYPE, 2018-2030 (USD MILLION)
- TABLE 150. UNITED KINGDOM INDUSTRIAL COATINGS MARKET SIZE, BY TECHNOLOGY, 2018-2030 (USD MILLION)
- TABLE 151. UNITED KINGDOM INDUSTRIAL COATINGS MARKET SIZE, BY END-USERS, 2018-2030 (USD MILLION)
- TABLE 152. INDUSTRIAL COATINGS MARKET, FPNV POSITIONING MATRIX, 2023
- TABLE 153. INDUSTRIAL COATINGS MARKET SHARE, BY KEY PLAYER, 2023
- TABLE 154. INDUSTRIAL COATINGS MARKET LICENSE & PRICING
 2024-2032 年工業塗料市場(按產品、技術、最終用戶和地區分類)
 2030年PVD真空沉澱鍍膜設備市場預測:按技術、材料、應用和地區分類的全球分析
 風電塗料市場報告:2030 年趨勢、預測與競爭分析
 風電塗料市場報告:2030 年趨勢、預測與競爭分析
 全球工業塗料市場:依樹脂類型(丙烯酸樹脂、醇酸樹脂、聚酯、聚氨酯、環氧樹脂、含氟聚合物)、依技術(溶劑型被覆劑、水性被覆劑、粉末被覆劑)、以最終用途進行產業(一般工業),按地區 - 預測到 2028 年
 全球工業塗料市場(2023-2032):依最終用戶、樹脂類型、技術、地區/國家進行分析和預測
 2024 年塗裝設備全球市場報告
 全球塗裝設備市場規模、佔有率、成長分析(按類型、按應用) - 產業預測,2023-2030年
 工業塗料市場 - 2018-2028 年全球產業規模、佔有率、趨勢、機會與預測(按產品、技術、最終用途、地區、競爭細分)
 工業維護塗料市場:按樹脂類型、銷售管道、技術和最終用戶分類 - 2023-2030 年全球預測