


 |
市場調查報告書
商品編碼
1334606
2023-2030 年全球可解釋人工智慧市場規模研究與預測(按組件、部署、按應用、最終用途和區域分析)Global Explainable AI Market Size Study & Forecast, by Component, By Deployment, By Application, By End-use, and Regional Analysis, 2023-2030 |
||||||
2022 年全球可解釋人工智慧市場價值約為 54.9 億美元,預計在 2023-2030 年預測期內將以超過 18.0% 的健康成長率成長。可解釋的人工智慧是指人工智慧(AI)系統的開發,為其決策過程提供可理解和透明的解釋。可解釋的人工智慧(XAI)是一個專注於開發解釋人工智慧模型決策的方法的研究領域。 XAI 很重要,因為它可以幫助用戶了解人工智慧模型的工作原理以及他們做出決策的原因。這有助於用戶信任人工智慧模型並更有效地使用它們。數位化趨勢的不斷上升、客戶期望和用戶體驗的不斷提高,再加上越來越多的政府優惠舉措,是推動全球市場需求的最突出因素。
此外,在估計期間,整個醫療保健領域可解釋人工智慧應用的增加也起到了催化因素的作用。可解釋的人工智慧用於醫療診斷和治療建議,幫助醫生和其他醫療保健專業人員理解和相信人工智慧算法做出的判斷。可解釋的模型可以解釋診斷,提供可行的療法,並突出相關的醫療問題,使醫療保健專業人員能夠做出更好的選擇。據Statista分析,2021年全球醫療保健人工智慧市場規模預計約為110.6億美元。此外,預計該市場還將成長,到2025年將達到386.6億美元,到2030年將達到187.95美元。因此,上述因素可能會推動全球市場擴張。此外,新興技術進步和人工智慧的發展,以及主要市場參與者不斷增加的戰略舉措,在預測幾年內帶來了各種利潤豐厚的機會。然而,可解釋的人工智慧解決方案的高成本和熟練專業人員的缺乏正在阻礙整個 2023-2030 年預測期內的市場成長。
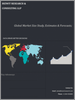
全球可解釋人工智慧市場研究涵蓋的關鍵區域包括亞太地區、北美、歐洲、拉丁美洲以及中東和非洲。由於擁有強大的 IT 基礎設施以及對人工智慧驅動的解決方案的需求激增,北美在 2022 年佔據了市場主導地位。而亞太地區預計在預測年份將以最高的年複合成長率成長。對法規遵從性的日益成長的需求、XAI 研發投資的增加以及硬體和並行處理的不斷進步正在顯著推動整個地區的市場需求。
該研究的目的是確定近年來不同細分市場和國家的市場規模,並預測未來幾年的價值。該報告旨在涵蓋參與研究的國家內該行業的定性和定量方面。
該報告還提供了有關促進因素和挑戰等關鍵方面的詳細資訊,這些因素將決定市場的未來成長。此外,它還涵蓋了利益相關者投資的微觀市場的潛在機會,以及對主要參與者的競爭格局和產品供應的詳細分析。 。
目錄
第 1 章:執行摘要
- 市場概況
- 2020-2030 年全球和細分市場估計與預測
- 可解釋的人工智慧市場(按地區),2020-2030 年
- 可解釋的人工智慧市場(按組成部分),2020-2030 年
- 可解釋的人工智慧市場,按部署分類,2020-2030 年
- 可解釋的人工智慧市場,按應用分類,2020-2030 年
- 可解釋的人工智慧市場,按最終用途,2020-2030 年
- 主要趨勢
- 估算方法
- 研究假設
第 2 章:全球可解釋人工智慧市場定義和範圍
- 研究目的
- 市場定義和範圍
- 行業演變
- 研究範圍
- 研究涵蓋的年份
- 貨幣兌換率
第 3 章:全球可解釋的人工智慧市場動態
- 可解釋的人工智慧市場影響分析(2020-2030)
- 市場促進因素
- 越來越多的有利政府舉措
- 可解釋人工智慧在醫療保健領域的應用增加
- 市場挑戰
- 可解釋的人工智慧解決方案成本高昂
- 缺乏熟練的專業人員
- 市場機會
- 新興技術進步和人工智慧的發展
- 主要市場參與者的戰略舉措數量不斷增加
- 市場促進因素
第 4 章:全球可解釋人工智慧市場行業分析
- 波特的五力模型
- 供應商的議價能力
- 買家的議價能力
- 新進入者的威脅
- 替代品的威脅
- 競爭競爭
- 波特的五力影響分析
- PEST分析
- 政治的
- 經濟
- 社會的
- 技術性
- 環境的
- 合法的
- 頂級投資機會
- 最佳制勝策略
- COVID-19 影響分析
- 顛覆性趨勢
- 行業專家視角
- 分析師推薦與結論
第 5 章:全球可解釋人工智慧市場(按組成部分)
- 市場概況
- 全球可解釋人工智慧市場(按組件、性能)-潛力分析
- 2020-2030 年全球可解釋人工智慧市場按組成部分的估計和預測
- 可解釋的人工智慧市場,細分市場分析
- 解決方案
- 服務
第 6 章:全球可解釋人工智慧市場(按部署)
- 市場概況
- 按部署、性能分類的全球可解釋人工智慧市場 - 潛力分析
- 2020-2030 年全球可解釋人工智慧市場部署預測
- 可解釋的人工智慧市場,細分市場分析
- 雲
- 本地部署
第 7 章:全球可解釋人工智慧市場(按應用)
- 市場概況
- 全球可解釋人工智慧市場(按應用、性能)-潛力分析
- 2020-2030 年按應用分類的全球可解釋人工智慧市場估計和預測
- 可解釋的人工智慧市場,細分市場分析
- 欺詐和異常檢測
- 藥物發現與診斷
- 預測性維護
- 供應鏈管理
- 身份和訪問管理
第 8 章:全球可解釋人工智慧市場(按最終用途)
- 市場概況
- 按最終用途、性能分類的全球可解釋人工智慧市場 - 潛力分析
- 2020-2030 年按最終用途分類的全球可解釋人工智慧市場估計和預測
- 可解釋的人工智慧市場,細分市場分析
- 衛生保健
- BFSI
- 航太與國防
- 零售和電子商務
- 資訊技術與電信
- 其他
第 9 章:全球可解釋人工智慧市場,區域分析
- 領先國家
- 頂級新興國家
- 可解釋的人工智慧市場,區域市場概況
- 北美
- 美國
- 2020-2030 年組件細分估計和預測
- 2020-2030 年部署細分估計和預測
- 2020-2030 年應用細分估計和預測
- 2020-2030 年最終用途細分估計和預測
- 加拿大
- 美國
- 歐洲可解釋的人工智慧市場概況
- 英國
- 德國
- 法國
- 西班牙
- 義大利
- 歐洲其他地區
- 亞太地區可解釋的人工智慧市場概況
- 中國
- 印度
- 日本
- 澳大利亞
- 韓國
- 亞太地區其他地區
- 拉丁美洲可解釋的人工智慧市場概況
- 巴西
- 墨西哥
- 中東和非洲
- 沙烏地阿拉伯
- 南非
- 中東和非洲其他地區
第 10 章:競爭情報
- 重點企業SWOT分析
- 公司1
- 公司2
- 公司3
- 頂級市場策略
- 公司簡介
- Amelia US LLC
- 關鍵資訊
- 概述
- 財務(視數據可用性而定)
- 產品概要
- 最近的發展
- BuildGroup
- DataRobot, Inc.
- Ditto.ai
- DarwinAI
- Factmata
- Google LLC
- IBM Corporation
- Kyndi
- Microsoft Corporation
第 11 章:研究過程
- 研究過程
- 數據挖掘
- 分析
- 市場預測
- 驗證
- 出版
- 研究屬性
- 研究假設
Global Explainable AI Market is valued at approximately USD 5.49 billion in 2022 and is anticipated to grow with a healthy growth rate of more than 18.0% over the forecast period 2023-2030. Explainable AI refers to the development of artificial intelligence (AI) systems that provide understandable and transparent explanations for their decision-making processes. Explainable AI (XAI) is a field of study that focuses on developing methods for explaining the decisions made by AI models. XAI is important because it helps users to understand how AI models work and why they make the decisions they do. This helps users to trust AI models and to use them more effectively. The rising trend of digitalization, growing customer expectations and user experience, coupled with the increasing number of favorable government initiatives are the most prominent factors that are propelling the market demand across the globe.
In addition, the increase in applications of explainable AI across the healthcare sector is acting as a catalyzing factor during the estimated period. Explainable AI is utilized for medical diagnosis and treatment recommendations and helps doctors and other healthcare professionals to comprehend and believe the judgments made by AI algorithms. Explainable models give explanations for diagnosis, offer viable therapies, and highlight pertinent medical issues, empowering healthcare professionals to make better-educated choices. According to the Statista analysis, in 2021, the global market for Artificial intelligence (AI) in healthcare was estimated to be worth around USD 11.06 billion. In addition, it is projected that the market grows and reached USD 38.66 billion by 2025 and USD 187.95 by 2030. Thereby, these aforementioned factors are likely to boost the market expansion globally. Moreover, the emerging technological advancements and the development of AI, as well as the rising number of strategic initiatives by the key market players present various lucrative opportunities over the forecasting years. However, the high cost of explainable AI solutions and the lack of skilled professionals are hindering the market growth throughout the forecast period of 2023-2030.
The key regions considered for the Global Explainable AI Market study include Asia Pacific, North America, Europe, Latin America, and Middle East & Africa. North America dominated the market in 2022 owing to the presence of a strong IT infrastructure, as well as surging demand for AI-powered solutions. Whereas, Asia Pacific is expected to grow at the highest CAGR over the forecasting years. The growing need for compliance with regulations, rising investment in XAI research and development, and increasing advancements in hardware and parallel processing are significantly propelling the market demand across the region.
Major market players included in this report are:
- Amelia US LLC
- BuildGroup
- DataRobot, Inc.
- Ditto.ai
- DarwinAI
- Factmata
- Google LLC
- IBM Corporation
- Kyndi
- Microsoft Corporation
Recent Developments in the Market:
- In March 2023, Monroe Capital and BuildGroup teamed with AI company Amelia to supply financial funding and managerial expertise. The strategic partnership accelerates the commercialization of Amelia's AI solutions. The strategic partnership hastens the commercialization of Amelia's AI solutions. BuildGroup and Monroe Capital are leading the USD 175 million transactions with this round of funding. Amelia has the required resources to maintain its market-leading position and increase its dedication to offering its customers cutting-edge, comprehensible AI technologies.
Global Explainable AI Market Report Scope:
- Historical Data: 2020 - 2021
- Base Year for Estimation: 2022
- Forecast period: 2023-2030
- Report Coverage: Revenue forecast, Company Ranking, Competitive Landscape, Growth factors, and Trends
- Segments Covered: Component, Deployment, Application, End-use, Region
- Regional Scope: North America; Europe; Asia Pacific; Latin America; Middle East & Africa
- Customization Scope: Free report customization (equivalent up to 8 analyst's working hours) with purchase. Addition or alteration to country, regional & segment scope*
The objective of the study is to define market sizes of different segments & countries in recent years and to forecast the values to the coming years. The report is designed to incorporate both qualitative and quantitative aspects of the industry within countries involved in the study.
The report also caters detailed information about the crucial aspects such as driving factors & challenges which will define the future growth of the market. Additionally, it also incorporates potential opportunities in micro markets for stakeholders to invest along with the detailed analysis of competitive landscape and product offerings of key players. The detailed segments and sub-segment of the market are explained below.
By Component:
- Solution
- Services
By Deployment:
- Cloud
- On-Premises
By Application:
- Fraud and anomaly detection
- Drug discovery & diagnostics
- Predictive maintenance
- Supply chain management
- Identity and access management
By End-use:
- Healthcare
- BFSI
- Aerospace & defense
- Retail and e-commerce
- IT & telecommunication
- Others
By Region:
- North America
- U.S.
- Canada
- Europe
- UK
- Germany
- France
- Spain
- Italy
- ROE
- Asia Pacific
- China
- India
- Japan
- Australia
- South Korea
- RoAPAC
- Latin America
- Brazil
- Mexico
- Middle East & Africa
- Saudi Arabia
- South Africa
- Rest of Middle East & Africa
Table of Contents
Chapter 1. Executive Summary
- 1.1. Market Snapshot
- 1.2. Global & Segmental Market Estimates & Forecasts, 2020-2030 (USD Billion)
- 1.2.1. Explainable AI Market, by Region, 2020-2030 (USD Billion)
- 1.2.2. Explainable AI Market, by Component, 2020-2030 (USD Billion)
- 1.2.3. Explainable AI Market, by Deployment, 2020-2030 (USD Billion)
- 1.2.4. Explainable AI Market, by Application, 2020-2030 (USD Billion)
- 1.2.5. Explainable AI Market, by End-use, 2020-2030 (USD Billion)
- 1.3. Key Trends
- 1.4. Estimation Methodology
- 1.5. Research Assumption
Chapter 2. Global Explainable AI Market Definition and Scope
- 2.1. Objective of the Study
- 2.2. Market Definition & Scope
- 2.2.1. Industry Evolution
- 2.2.2. Scope of the Study
- 2.3. Years Considered for the Study
- 2.4. Currency Conversion Rates
Chapter 3. Global Explainable AI Market Dynamics
- 3.1. Explainable AI Market Impact Analysis (2020-2030)
- 3.1.1. Market Drivers
- 3.1.1.1. Increasing number of favorable government initiatives
- 3.1.1.2. Increase in applications of explainable AI across the healthcare sector
- 3.1.2. Market Challenges
- 3.1.2.1. High cost of Explainable AI Solutions
- 3.1.2.2. Lack of skilled professionals
- 3.1.3. Market Opportunities
- 3.1.3.1. Emerging technological advancements and the development of AI
- 3.1.3.2. Rising number of strategic initiatives by the key market players
- 3.1.1. Market Drivers
Chapter 4. Global Explainable AI Market Industry Analysis
- 4.1. Porter's 5 Force Model
- 4.1.1. Bargaining Power of Suppliers
- 4.1.2. Bargaining Power of Buyers
- 4.1.3. Threat of New Entrants
- 4.1.4. Threat of Substitutes
- 4.1.5. Competitive Rivalry
- 4.2. Porter's 5 Force Impact Analysis
- 4.3. PEST Analysis
- 4.3.1. Political
- 4.3.2. Economical
- 4.3.3. Social
- 4.3.4. Technological
- 4.3.5. Environmental
- 4.3.6. Legal
- 4.4. Top investment opportunity
- 4.5. Top winning strategies
- 4.6. COVID-19 Impact Analysis
- 4.7. Disruptive Trends
- 4.8. Industry Expert Perspective
- 4.9. Analyst Recommendation & Conclusion
Chapter 5. Global Explainable AI Market, by Component
- 5.1. Market Snapshot
- 5.2. Global Explainable AI Market by Component, Performance - Potential Analysis
- 5.3. Global Explainable AI Market Estimates & Forecasts by Component 2020-2030 (USD Billion)
- 5.4. Explainable AI Market, Sub Segment Analysis
- 5.4.1. Solution
- 5.4.2. Services
Chapter 6. Global Explainable AI Market, by Deployment
- 6.1. Market Snapshot
- 6.2. Global Explainable AI Market by Deployment, Performance - Potential Analysis
- 6.3. Global Explainable AI Market Estimates & Forecasts by Deployment 2020-2030 (USD Billion)
- 6.4. Explainable AI Market, Sub Segment Analysis
- 6.4.1. Cloud
- 6.4.2. On-Premises
Chapter 7. Global Explainable AI Market, by Application
- 7.1. Market Snapshot
- 7.2. Global Explainable AI Market by Application, Performance - Potential Analysis
- 7.3. Global Explainable AI Market Estimates & Forecasts by Application 2020-2030 (USD Billion)
- 7.4. Explainable AI Market, Sub Segment Analysis
- 7.4.1. Fraud and anomaly detection
- 7.4.2. Drug discovery & diagnostics
- 7.4.3. Predictive maintenance
- 7.4.4. Supply chain management
- 7.4.5. Identity and access management
Chapter 8. Global Explainable AI Market, by End-use
- 8.1. Market Snapshot
- 8.2. Global Explainable AI Market by End-use, Performance - Potential Analysis
- 8.3. Global Explainable AI Market Estimates & Forecasts by End-use 2020-2030 (USD Billion)
- 8.4. Explainable AI Market, Sub Segment Analysis
- 8.4.1. Healthcare
- 8.4.2. BFSI
- 8.4.3. Aerospace & defense
- 8.4.4. Retail and e-commerce
- 8.4.5. IT & telecommunication
- 8.4.6. Others
Chapter 9. Global Explainable AI Market, Regional Analysis
- 9.1. Top Leading Countries
- 9.2. Top Emerging Countries
- 9.3. Explainable AI Market, Regional Market Snapshot
- 9.4. North America Explainable AI Market
- 9.4.1. U.S. Explainable AI Market
- 9.4.1.1. Component breakdown estimates & forecasts, 2020-2030
- 9.4.1.2. Deployment breakdown estimates & forecasts, 2020-2030
- 9.4.1.3. Application breakdown estimates & forecasts, 2020-2030
- 9.4.1.4. End-use breakdown estimates & forecasts, 2020-2030
- 9.4.2. Canada Explainable AI Market
- 9.4.1. U.S. Explainable AI Market
- 9.5. Europe Explainable AI Market Snapshot
- 9.5.1. U.K. Explainable AI Market
- 9.5.2. Germany Explainable AI Market
- 9.5.3. France Explainable AI Market
- 9.5.4. Spain Explainable AI Market
- 9.5.5. Italy Explainable AI Market
- 9.5.6. Rest of Europe Explainable AI Market
- 9.6. Asia-Pacific Explainable AI Market Snapshot
- 9.6.1. China Explainable AI Market
- 9.6.2. India Explainable AI Market
- 9.6.3. Japan Explainable AI Market
- 9.6.4. Australia Explainable AI Market
- 9.6.5. South Korea Explainable AI Market
- 9.6.6. Rest of Asia Pacific Explainable AI Market
- 9.7. Latin America Explainable AI Market Snapshot
- 9.7.1. Brazil Explainable AI Market
- 9.7.2. Mexico Explainable AI Market
- 9.8. Middle East & Africa Explainable AI Market
- 9.8.1. Saudi Arabia Explainable AI Market
- 9.8.2. South Africa Explainable AI Market
- 9.8.3. Rest of Middle East & Africa Explainable AI Market
Chapter 10. Competitive Intelligence
- 10.1. Key Company SWOT Analysis
- 10.1.1. Company 1
- 10.1.2. Company 2
- 10.1.3. Company 3
- 10.2. Top Market Strategies
- 10.3. Company Profiles
- 10.3.1. Amelia US LLC
- 10.3.1.1. Key Information
- 10.3.1.2. Overview
- 10.3.1.3. Financial (Subject to Data Availability)
- 10.3.1.4. Product Summary
- 10.3.1.5. Recent Developments
- 10.3.2. BuildGroup
- 10.3.3. DataRobot, Inc.
- 10.3.4. Ditto.ai
- 10.3.5. DarwinAI
- 10.3.6. Factmata
- 10.3.7. Google LLC
- 10.3.8. IBM Corporation
- 10.3.9. Kyndi
- 10.3.10. Microsoft Corporation
- 10.3.1. Amelia US LLC
Chapter 11. Research Process
- 11.1. Research Process
- 11.1.1. Data Mining
- 11.1.2. Analysis
- 11.1.3. Market Estimation
- 11.1.4. Validation
- 11.1.5. Publishing
- 11.2. Research Attributes
- 11.3. Research Assumption
LIST OF TABLES
- TABLE 1. Global Explainable AI Market, report scope
- TABLE 2. Global Explainable AI Market estimates & forecasts by Region 2020-2030 (USD Billion)
- TABLE 3. Global Explainable AI Market estimates & forecasts by Component 2020-2030 (USD Billion)
- TABLE 4. Global Explainable AI Market estimates & forecasts by Deployment 2020-2030 (USD Billion)
- TABLE 5. Global Explainable AI Market estimates & forecasts by Application 2020-2030 (USD Billion)
- TABLE 6. Global Explainable AI Market estimates & forecasts by End-use 2020-2030 (USD Billion)
- TABLE 7. Global Explainable AI Market by segment, estimates & forecasts, 2020-2030 (USD Billion)
- TABLE 8. Global Explainable AI Market by region, estimates & forecasts, 2020-2030 (USD Billion)
- TABLE 9. Global Explainable AI Market by segment, estimates & forecasts, 2020-2030 (USD Billion)
- TABLE 10. Global Explainable AI Market by region, estimates & forecasts, 2020-2030 (USD Billion)
- TABLE 11. Global Explainable AI Market by segment, estimates & forecasts, 2020-2030 (USD Billion)
- TABLE 12. Global Explainable AI Market by region, estimates & forecasts, 2020-2030 (USD Billion)
- TABLE 13. Global Explainable AI Market by segment, estimates & forecasts, 2020-2030 (USD Billion)
- TABLE 14. Global Explainable AI Market by region, estimates & forecasts, 2020-2030 (USD Billion)
- TABLE 15. Global Explainable AI Market by segment, estimates & forecasts, 2020-2030 (USD Billion)
- TABLE 16. Global Explainable AI Market by region, estimates & forecasts, 2020-2030 (USD Billion)
- TABLE 17. U.S. Explainable AI Market estimates & forecasts, 2020-2030 (USD Billion)
- TABLE 18. U.S. Explainable AI Market estimates & forecasts by segment 2020-2030 (USD Billion)
- TABLE 19. U.S. Explainable AI Market estimates & forecasts by segment 2020-2030 (USD Billion)
- TABLE 20. Canada Explainable AI Market estimates & forecasts, 2020-2030 (USD Billion)
- TABLE 21. Canada Explainable AI Market estimates & forecasts by segment 2020-2030 (USD Billion)
- TABLE 22. Canada Explainable AI Market estimates & forecasts by segment 2020-2030 (USD Billion)
- TABLE 23. UK Explainable AI Market estimates & forecasts, 2020-2030 (USD Billion)
- TABLE 24. UK Explainable AI Market estimates & forecasts by segment 2020-2030 (USD Billion)
- TABLE 25. UK Explainable AI Market estimates & forecasts by segment 2020-2030 (USD Billion)
- TABLE 26. Germany Explainable AI Market estimates & forecasts, 2020-2030 (USD Billion)
- TABLE 27. Germany Explainable AI Market estimates & forecasts by segment 2020-2030 (USD Billion)
- TABLE 28. Germany Explainable AI Market estimates & forecasts by segment 2020-2030 (USD Billion)
- TABLE 29. France Explainable AI Market estimates & forecasts, 2020-2030 (USD Billion)
- TABLE 30. France Explainable AI Market estimates & forecasts by segment 2020-2030 (USD Billion)
- TABLE 31. France Explainable AI Market estimates & forecasts by segment 2020-2030 (USD Billion)
- TABLE 32. Italy Explainable AI Market estimates & forecasts, 2020-2030 (USD Billion)
- TABLE 33. Italy Explainable AI Market estimates & forecasts by segment 2020-2030 (USD Billion)
- TABLE 34. Italy Explainable AI Market estimates & forecasts by segment 2020-2030 (USD Billion)
- TABLE 35. Spain Explainable AI Market estimates & forecasts, 2020-2030 (USD Billion)
- TABLE 36. Spain Explainable AI Market estimates & forecasts by segment 2020-2030 (USD Billion)
- TABLE 37. Spain Explainable AI Market estimates & forecasts by segment 2020-2030 (USD Billion)
- TABLE 38. RoE Explainable AI Market estimates & forecasts, 2020-2030 (USD Billion)
- TABLE 39. RoE Explainable AI Market estimates & forecasts by segment 2020-2030 (USD Billion)
- TABLE 40. RoE Explainable AI Market estimates & forecasts by segment 2020-2030 (USD Billion)
- TABLE 41. China Explainable AI Market estimates & forecasts, 2020-2030 (USD Billion)
- TABLE 42. China Explainable AI Market estimates & forecasts by segment 2020-2030 (USD Billion)
- TABLE 43. China Explainable AI Market estimates & forecasts by segment 2020-2030 (USD Billion)
- TABLE 44. India Explainable AI Market estimates & forecasts, 2020-2030 (USD Billion)
- TABLE 45. India Explainable AI Market estimates & forecasts by segment 2020-2030 (USD Billion)
- TABLE 46. India Explainable AI Market estimates & forecasts by segment 2020-2030 (USD Billion)
- TABLE 47. Japan Explainable AI Market estimates & forecasts, 2020-2030 (USD Billion)
- TABLE 48. Japan Explainable AI Market estimates & forecasts by segment 2020-2030 (USD Billion)
- TABLE 49. Japan Explainable AI Market estimates & forecasts by segment 2020-2030 (USD Billion)
- TABLE 50. South Korea Explainable AI Market estimates & forecasts, 2020-2030 (USD Billion)
- TABLE 51. South Korea Explainable AI Market estimates & forecasts by segment 2020-2030 (USD Billion)
- TABLE 52. South Korea Explainable AI Market estimates & forecasts by segment 2020-2030 (USD Billion)
- TABLE 53. Australia Explainable AI Market estimates & forecasts, 2020-2030 (USD Billion)
- TABLE 54. Australia Explainable AI Market estimates & forecasts by segment 2020-2030 (USD Billion)
- TABLE 55. Australia Explainable AI Market estimates & forecasts by segment 2020-2030 (USD Billion)
- TABLE 56. RoAPAC Explainable AI Market estimates & forecasts, 2020-2030 (USD Billion)
- TABLE 57. RoAPAC Explainable AI Market estimates & forecasts by segment 2020-2030 (USD Billion)
- TABLE 58. RoAPAC Explainable AI Market estimates & forecasts by segment 2020-2030 (USD Billion)
- TABLE 59. Brazil Explainable AI Market estimates & forecasts, 2020-2030 (USD Billion)
- TABLE 60. Brazil Explainable AI Market estimates & forecasts by segment 2020-2030 (USD Billion)
- TABLE 61. Brazil Explainable AI Market estimates & forecasts by segment 2020-2030 (USD Billion)
- TABLE 62. Mexico Explainable AI Market estimates & forecasts, 2020-2030 (USD Billion)
- TABLE 63. Mexico Explainable AI Market estimates & forecasts by segment 2020-2030 (USD Billion)
- TABLE 64. Mexico Explainable AI Market estimates & forecasts by segment 2020-2030 (USD Billion)
- TABLE 65. RoLA Explainable AI Market estimates & forecasts, 2020-2030 (USD Billion)
- TABLE 66. RoLA Explainable AI Market estimates & forecasts by segment 2020-2030 (USD Billion)
- TABLE 67. RoLA Explainable AI Market estimates & forecasts by segment 2020-2030 (USD Billion)
- TABLE 68. Saudi Arabia Explainable AI Market estimates & forecasts, 2020-2030 (USD Billion)
- TABLE 69. South Africa Explainable AI Market estimates & forecasts by segment 2020-2030 (USD Billion)
- TABLE 70. RoMEA Explainable AI Market estimates & forecasts by segment 2020-2030 (USD Billion)
- TABLE 71. List of secondary sources, used in the study of global Explainable AI Market
- TABLE 72. List of primary sources, used in the study of global Explainable AI Market
- TABLE 73. Years considered for the study
- TABLE 74. Exchange rates considered
List of tables and figures and dummy in nature, final lists may vary in the final deliverable
LIST OF FIGURES
- FIG 1. Global Explainable AI Market, research methodology
- FIG 2. Global Explainable AI Market, Market estimation techniques
- FIG 3. Global Market size estimates & forecast methods
- FIG 4. Global Explainable AI Market, key trends 2022
- FIG 5. Global Explainable AI Market, growth prospects 2023-2030
- FIG 6. Global Explainable AI Market, porters 5 force model
- FIG 7. Global Explainable AI Market, pest analysis
- FIG 8. Global Explainable AI Market, value chain analysis
- FIG 9. Global Explainable AI Market by segment, 2020 & 2030 (USD Billion)
- FIG 10. Global Explainable AI Market by segment, 2020 & 2030 (USD Billion)
- FIG 11. Global Explainable AI Market by segment, 2020 & 2030 (USD Billion)
- FIG 12. Global Explainable AI Market by segment, 2020 & 2030 (USD Billion)
- FIG 13. Global Explainable AI Market by segment, 2020 & 2030 (USD Billion)
- FIG 14. Global Explainable AI Market, regional snapshot 2020 & 2030
- FIG 15. North America Explainable AI Market 2020 & 2030 (USD Billion)
- FIG 16. Europe Explainable AI Market 2020 & 2030 (USD Billion)
- FIG 17. Asia Pacific Explainable AI Market 2020 & 2030 (USD Billion)
- FIG 18. Latin America Explainable AI Market 2020 & 2030 (USD Billion)
- FIG 19. Middle East & Africa Explainable AI Market 2020 & 2030 (USD Billion)
List of tables and figures and dummy in nature, final lists may vary in the final deliverable


