


 |
市場調查報告書
商品編碼
1119096
綠色建築全球市場規模調查,按材料(木材、再生金屬、玻璃纖維、礦棉、其他)、應用(住宅、商業、工業)、區域預測 2022-2028Global Green Building Market Size study, by Material (Lumber, Recycled Metal, Fiberglass, Mineral Wool, Others) by Application (Residential, Commercial, Industrial) and Regional Forecasts 2022-2028 |
||||||
到 2021 年,全球綠色建築市場價值約為 203.5 億美元,預計在 2022-2028 年的預測期內將以超過 1.5% 的健康增長率增長。
綠色建築,也稱為可持續建築,是在整個週期內對生態負責且節能的結構。綠色建築方法旨在減少建築對環境的影響。大多數綠色建築材料,如木材、再生金屬、玻璃纖維和礦棉,都是可再生且無毒的。綠色建築利用生物質能、太陽能、水力和風能在當地產生可再生能源。日益增長的環境問題和嚴格的政府要求預計將推動全球綠色建築市場的穩步擴張。由於運營和維護成本低,綠色建築有望在工業領域普及。預計對節能技術不斷增長的需求將推動市場對綠色建築的需求。在預測期內,住宅和商業領域對綠色建築的需求不斷增長,預計將推動市場擴張。預計 LEED 和 ICC 700 國家綠色建築標準等綠色建築認證計劃將推動未來對綠色建築項目的需求。美國獲得 LEED 認證的項目數量從 2006 年的 296 個增加到 2018 年的 67,200 多個。市場增長是由持續高速採用綠色技術和可持續發展解決方案推動的。例如,Advanced Green Technologies (AGT) 於 2021 年 4 月宣布,其位於南佛羅裡達州 Doral 的 Kostex Tractor Parts (CTP) 總部將產生整個建築所需電力的 90-100%2。完成第二大太陽能屋頂.CTP 太陽能裝置是 AGT 為慶祝其成立 14 週年而完成的 300 個太陽能公用設施屋頂之一。安裝在 CTP 屋頂上的 3,974 塊太陽能電池板將產生 1.6MW 的可持續能源。然而,高昂的材料成本預計將成為綠色建築行業的主要障礙。
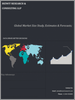
研究全球綠色建築市場的重點地區是亞太地區、北美、歐洲、拉丁美洲和世界其他地區。綠色建築是北美和歐洲的一個大市場。該地區市場的特點是對可持續建築的認識不斷提高,對低能耗解決方案的需求不斷增加。然而,在印度和中國等新興國家,由於工業部門的擴張和城市化進程的進展,亞太地區被認為是增長最快的地區。此外,工業污染的增加和環境法規的收緊預計將推動工業領域的市場擴張。
本報告中包括的主要市場進入者是:
Alumasc 集團有限公司
鮑德有限公司
賓德霍爾茲有限公司
阿魯蒂多有限公司
福爾波國際公司
克拉克集團
特納公司
漢塞爾菲爾普斯
吉本建築有限公司
懷廷特納承包公司
本研究的目的是確定近年來各個細分市場和國家的市場規模,並預測未來八年的價值。該報告旨在捕捉所研究的每個地區和國家的行業的定性和定量方面。此外,它還提供了有關關鍵方面的詳細信息,例如定義市場未來增長的驅動因素和挑戰。此外,報告還應詳細分析主要參與者的競爭格局和產品供應,以及微觀市場中可供利益相關者投資的機會。市場的詳細細分和子細分如下所述。
按材質
木頭
再生金屬
玻璃纖維
礦棉
其他
按用途
家用
商業的
工業的
按地區
北美
美國
加拿大
歐洲
英國
德國
法國
西班牙
意大利
歐洲其他地區
亞太地區
中國
印度
日本
澳大利亞
韓國
其他亞太地區
拉丁美洲
巴西
墨西哥
世界其他地區
此外,本研究考慮的年份是:
實際年份 - 2018 年、2019 年、2020 年
2021 年基準年
預測期 - 2022-2028
本報告的目標受眾是全球綠色建築市場
主要諮詢公司和顧問
大公司、中型公司、中小企業
風險投資
增值經銷商 (VAR)
第三方知識提供者
投資銀行家
投資者
目錄
第一章執行摘要
- 市場快照
- 2020-2028年全球市場和細分市場的估計和預測
- 綠色建築市場:按地區劃分,2020-2028
- 綠色建築市場:按材料,2020-2028
- 2020-2028 年按應用分列的綠色建築市場
- 主要趨勢
- 調查方法
- 調查先決條件
第 2 章綠色建築全球市場定義和範圍
- 調查目的
- 市場定義和範圍
- 調查範圍
- 產業進化
- 調查目標年份
- 貨幣兌換率
第三章全球綠色建築市場動態
- 綠色建築市場影響分析(2020-2028)
- 市場驅動力
- 建築活動增加
- 政府支持政策
- 市場挑戰
- 綠色建築造價高
- 市場機會
- 投資綠色建築技術
- 市場驅動力
第四章全球綠色建築市場行業分析
- 波特五力模型
- 供應商的議價能力
- 買方議價能力
- 新進入者的威脅
- 替代品的威脅
- 競爭對手之間的競爭
- 波特五力模型的未來方法(2018-2028)
- PEST分析
- 政治的
- 經濟的
- 社會的
- 技術的
- 招商引資模式
- 分析師結論/建議
- 頂級投資機會
- 獲勝的最佳策略
第 5 章風險評估:COVID-19 的影響
- 評估 COVID-19 對行業的整體影響
- COVID-19 之前和 COVID-19 之後的市場情景
6 全球綠色建築市場,按材料分類
- 市場快照
- 全球綠色建築市場:按材料、按性能、潛力分析
- 2018-2028 年全球綠色建築市場、估計和預測(按材料)
- 綠色建築市場,細分分析
- 木頭
- 再生金屬
- 玻璃纖維
- 礦棉
- 其他
7 全球綠色建築市場,按應用
- 市場快照
- 全球綠色建築市場:按應用進行的性能潛力分析
- 2018-2028 年按應用分列的全球綠色建築市場、估計和預測
- 全球綠色建築市場,細分分析
- 住宅領域
- 商業設施
- 工業的
8 全球綠色建築市場:區域分析
- 綠色建築市場,區域市場快照
- 北美
- 美國
- 2018-2028 年按材料分類的估計和預測
- 2018-2028 年按應用劃分的估計和預測
- 加拿大
- 美國
- 歐洲綠色建築市場快照
- 英國
- 德國
- 法國
- 西班牙
- 意大利
- 歐洲其他地區
- 亞太綠色建築市場概況
- 中國
- 印度
- 日本
- 澳大利亞
- 韓國
- 亞太其他地區
- 拉丁美洲綠色建築市場概況
- 巴西
- 墨西哥
- 世界其他地區
第 9 章 競爭信息
- 頂級市場戰略
- 公司簡介
- Alumasc Group Plc
- 主要信息
- 概述
- 財務(如果有數據)
- 產品概要
- 近期發展狀況
- Bauder Ltd.
- Binderholz GmBH
- Certain Teed Corporation
- Forbo International SA
- Clark Group
- The Turner Corp.
- Hensel Phelps
- Gilbane Building Co.
- The Whiting-Turner Contracting Co.
- Alumasc Group Plc
第 10 章 調查過程
- 調查過程
- 數據挖掘
- 分析
- 市場估計
- 驗證
- 出版物
- 調查屬性
- 調查先決條件
Global Green Building Market is valued approximately USD 20.35 billion in 2021 and is anticipated to grow with a healthy growth rate of more than 1.5% over the forecast period 2022-2028. Green buildings, also known as sustainable construction, are structures that are ecologically responsible and energy efficient throughout their entire cycle. Green construction approaches strive to lessen a building's environmental effect. Most green construction materials, such as timber, recycled metal, fibreglass, and mineral wool, are renewable and non-toxic in nature. Green buildings generate renewable energy on-site using biomass, solar power, hydropower, and wind power. Because of rising environmental concerns and severe government requirements, the worldwide market for green buildings is likely to rise steadily. Green buildings are predicted to rise in popularity in the industrial sector due to their low operating and maintenance expenses. Rising demand for energy-efficient technology is predicted to drive market demand for green buildings. Growing demand for green buildings in the residential and commercial sectors is likely to drive market expansion over the forecast period. Green building certification programmes like LEED and the ICC 700 National Green Building Standard are projected to boost demand for green building projects in the future. The number of LEED-certified projects in the United States climbed from 296 in 2006 to over 67,200 in 2018. Market growth is being driven by the continued fast adoption of green technology and sustainability solutions. As an example, Advanced Green Technologies (AGT) finished South Florida's second-largest solar roof, which generates 90 to 100 percent of the power necessary for the entire building, at the Costex Tractor Parts (CTP) headquarters in Doral in April 2021. The CTP solar installation is one of 300 solar business roof installations completed by AGT to commemorate the company's 14th anniversary. The 3,974 solar panels on the CTP roof create 1.6 MW of sustainable energy. However, high material costs are projected to be a significant impediment to the green construction sector.
The key regions considered for the Global Green Building Market study includes Asia Pacific, North America, Europe, Latin America, and Rest of the World. Green construction is a large market in North America and Europe. This region's market is characterized by growing awareness of sustainable building and rising demand for low-energy consumption solutions. However, because to the expanding industrial sector and increasing urbanization in emerging nations such as India and China, Asia Pacific is likely to be the fastest-growing area. Furthermore, rising industrial pollution, along with stringent environmental restrictions in the area, is likely to boost market expansion in the industrial sector.
Major market player included in this report are:
Alumasc Group Plc
Bauder Ltd.
Binderholz GmBH
Certain Teed Corporation
Forbo International SA
Clark Group
The Turner Corp.
Hensel Phelps
Gilbane Building Co.
The Whiting-Turner Contracting Co.
The objective of the study is to define market sizes of different segments & countries in recent years and to forecast the values to the coming eight years. The report is designed to incorporate both qualitative and quantitative aspects of the industry within each of the regions and countries involved in the study. Furthermore, the report also caters the detailed information about the crucial aspects such as driving factors & challenges which will define the future growth of the market. Additionally, the report shall also incorporate available opportunities in micro markets for stakeholders to invest along with the detailed analysis of competitive landscape and product offerings of key players. The detailed segments and sub-segment of the market are explained below:
By Material:
Lumber
Recycled Metal
Fiberglass
Mineral Wool
Others
By Application:
Residential
Commercial
Industrial
By Region:
North America
U.S.
Canada
Europe
UK
Germany
France
Spain
Italy
ROE
Asia Pacific
China
India
Japan
Australia
South Korea
RoAPAC
Latin America
Brazil
Mexico
Rest of the World
Furthermore, years considered for the study are as follows:
Historical year - 2018, 2019, 2020
Base year - 2021
Forecast period - 2022 to 2028
Target Audience of the Global Green Building Market in Market Study:
Key Consulting Companies & Advisors
Large, medium-sized, and small enterprises
Venture capitalists
Value-Added Resellers (VARs)
Third-party knowledge providers
Investment bankers
Investors
Table of Contents
Chapter 1. Executive Summary
- 1.1. Market Snapshot
- 1.2. Global & Segmental Market Estimates & Forecasts, 2020-2028 (USD Billion)
- 1.2.1. Green Building Market, by Region, 2020-2028 (USD Billion)
- 1.2.2. Green Building Market, by Material, 2020-2028 (USD Billion)
- 1.2.3. Green Building Market, by Application, 2020-2028 (USD Billion)
- 1.3. Key Trends
- 1.4. Estimation Methodology
- 1.5. Research Assumption
Chapter 2. Global Green Building Market Definition and Scope
- 2.1. Objective of the Study
- 2.2. Market Definition & Scope
- 2.2.1. Scope of the Study
- 2.2.2. Industry Evolution
- 2.3. Years Considered for the Study
- 2.4. Currency Conversion Rates
Chapter 3. Global Green Building Market Dynamics
- 3.1. Green Building Market Impact Analysis (2020-2028)
- 3.1.1. Market Drivers
- 3.1.1.1. Increasing construction activity
- 3.1.1.2. Supportive government policies
- 3.1.2. Market Challenges
- 3.1.2.1. High cost of green building
- 3.1.3. Market Opportunities
- 3.1.3.1. Investments in green building technology
- 3.1.1. Market Drivers
Chapter 4. Global Green Building Market Industry Analysis
- 4.1. Porter's 5 Force Model
- 4.1.1. Bargaining Power of Suppliers
- 4.1.2. Bargaining Power of Buyers
- 4.1.3. Threat of New Entrants
- 4.1.4. Threat of Substitutes
- 4.1.5. Competitive Rivalry
- 4.1.6. Futuristic Approach to Porter's 5 Force Model (2018-2028)
- 4.2. PEST Analysis
- 4.2.1. Political
- 4.2.2. Economical
- 4.2.3. Social
- 4.2.4. Technological
- 4.3. Investment Adoption Model
- 4.4. Analyst Recommendation & Conclusion
- 4.5. Top investment opportunity
- 4.6. Top winning strategies
Chapter 5. Risk Assessment: COVID-19 Impact
- 5.1.1. Assessment of the overall impact of COVID-19 on the industry
- 5.1.2. Pre COVID-19 and post COVID-19 Market scenario
Chapter 6. Global Green Building Market, by Material
- 6.1. Market Snapshot
- 6.2. Global Green Building Market by Material, Performance - Potential Analysis
- 6.3. Global Green Building Market Estimates & Forecasts by Material 2018-2028 (USD Billion)
- 6.4. Green Building Market, Sub Segment Analysis
- 6.4.1. Lumber
- 6.4.2. Recycled Metal
- 6.4.3. Fiberglass
- 6.4.4. Mineral Wool
- 6.4.5. Others
Chapter 7. Global Green Building Market, by Application
- 7.1. Market Snapshot
- 7.2. Global Green Building Market by Application, Performance - Potential Analysis
- 7.3. Global Green Building Market Estimates & Forecasts by Application 2018-2028 (USD Billion)
- 7.4. Green Building Market, Sub Segment Analysis
- 7.4.1. Residential
- 7.4.2. Commercial
- 7.4.3. Industrial
Chapter 8. Global Green Building Market, Regional Analysis
- 8.1. Green Building Market, Regional Market Snapshot
- 8.2. North America Green Building Market
- 8.2.1. U.S. Green Building Market
- 8.2.1.1. Material breakdown estimates & forecasts, 2018-2028
- 8.2.1.2. Application breakdown estimates & forecasts, 2018-2028
- 8.2.2. Canada Green Building Market
- 8.2.1. U.S. Green Building Market
- 8.3. Europe Green Building Market Snapshot
- 8.3.1. U.K. Green Building Market
- 8.3.2. Germany Green Building Market
- 8.3.3. France Green Building Market
- 8.3.4. Spain Green Building Market
- 8.3.5. Italy Green Building Market
- 8.3.6. Rest of Europe Green Building Market
- 8.4. Asia-Pacific Green Building Market Snapshot
- 8.4.1. China Green Building Market
- 8.4.2. India Green Building Market
- 8.4.3. Japan Green Building Market
- 8.4.4. Australia Green Building Market
- 8.4.5. South Korea Green Building Market
- 8.4.6. Rest of Asia Pacific Green Building Market
- 8.5. Latin America Green Building Market Snapshot
- 8.5.1. Brazil Green Building Market
- 8.5.2. Mexico Green Building Market
- 8.6. Rest of The World Green Building Market
Chapter 9. Competitive Intelligence
- 9.1. Top Market Strategies
- 9.2. Company Profiles
- 9.2.1. Alumasc Group Plc
- 9.2.1.1. Key Information
- 9.2.1.2. Overview
- 9.2.1.3. Financial (Subject to Data Availability)
- 9.2.1.4. Product Summary
- 9.2.1.5. Recent Developments
- 9.2.2. Bauder Ltd.
- 9.2.3. Binderholz GmBH
- 9.2.4. Certain Teed Corporation
- 9.2.5. Forbo International SA
- 9.2.6. Clark Group
- 9.2.7. The Turner Corp.
- 9.2.8. Hensel Phelps
- 9.2.9. Gilbane Building Co.
- 9.2.10. The Whiting-Turner Contracting Co.
- 9.2.1. Alumasc Group Plc
Chapter 10. Research Process
- 10.1. Research Process
- 10.1.1. Data Mining
- 10.1.2. Analysis
- 10.1.3. Market Estimation
- 10.1.4. Validation
- 10.1.5. Publishing
- 10.2. Research Attributes
- 10.3. Research Assumption
LIST OF TABLES
- TABLE 1. Global Green Building Market, report scope
- TABLE 2. Global Green Building Market estimates & forecasts by Region 2018-2028 (USD Billion)
- TABLE 3. Global Green Building Market estimates & forecasts by Material 2018-2028 (USD Billion)
- TABLE 4. Global Green Building Market estimates & forecasts by Application 2018-2028 (USD Billion)
- TABLE 5. Global Green Building Market by segment, estimates & forecasts, 2018-2028 (USD Billion)
- TABLE 6. Global Green Building Market by region, estimates & forecasts, 2018-2028 (USD Billion)
- TABLE 7. Global Green Building Market by segment, estimates & forecasts, 2018-2028 (USD Billion)
- TABLE 8. Global Green Building Market by region, estimates & forecasts, 2018-2028 (USD Billion)
- TABLE 9. Global Green Building Market by segment, estimates & forecasts, 2018-2028 (USD Billion)
- TABLE 10. Global Green Building Market by region, estimates & forecasts, 2018-2028 (USD Billion)
- TABLE 11. Global Green Building Market by segment, estimates & forecasts, 2018-2028 (USD Billion)
- TABLE 12. Global Green Building Market by region, estimates & forecasts, 2018-2028 (USD Billion)
- TABLE 13. Global Green Building Market by segment, estimates & forecasts, 2018-2028 (USD Billion)
- TABLE 14. Global Green Building Market by region, estimates & forecasts, 2018-2028 (USD Billion)
- TABLE 15. U.S. Green Building Market estimates & forecasts, 2018-2028 (USD Billion)
- TABLE 16. U.S. Green Building Market estimates & forecasts by segment 2018-2028 (USD Billion)
- TABLE 17. U.S. Green Building Market estimates & forecasts by segment 2018-2028 (USD Billion)
- TABLE 18. Canada Green Building Market estimates & forecasts, 2018-2028 (USD Billion)
- TABLE 19. Canada Green Building Market estimates & forecasts by segment 2018-2028 (USD Billion)
- TABLE 20. Canada Green Building Market estimates & forecasts by segment 2018-2028 (USD Billion)
- TABLE 21. UK Green Building Market estimates & forecasts, 2018-2028 (USD Billion)
- TABLE 22. UK Green Building Market estimates & forecasts by segment 2018-2028 (USD Billion)
- TABLE 23. UK Green Building Market estimates & forecasts by segment 2018-2028 (USD Billion)
- TABLE 24. Germany Green Building Market estimates & forecasts, 2018-2028 (USD Billion)
- TABLE 25. Germany Green Building Market estimates & forecasts by segment 2018-2028 (USD Billion)
- TABLE 26. Germany Green Building Market estimates & forecasts by segment 2018-2028 (USD Billion)
- TABLE 27. RoE Green Building Market estimates & forecasts, 2018-2028 (USD Billion)
- TABLE 28. RoE Green Building Market estimates & forecasts by segment 2018-2028 (USD Billion)
- TABLE 29. RoE Green Building Market estimates & forecasts by segment 2018-2028 (USD Billion)
- TABLE 30. China Green Building Market estimates & forecasts, 2018-2028 (USD Billion)
- TABLE 31. China Green Building Market estimates & forecasts by segment 2018-2028 (USD Billion)
- TABLE 32. China Green Building Market estimates & forecasts by segment 2018-2028 (USD Billion)
- TABLE 33. India Green Building Market estimates & forecasts, 2018-2028 (USD Billion)
- TABLE 34. India Green Building Market estimates & forecasts by segment 2018-2028 (USD Billion)
- TABLE 35. India Green Building Market estimates & forecasts by segment 2018-2028 (USD Billion)
- TABLE 36. Japan Green Building Market estimates & forecasts, 2018-2028 (USD Billion)
- TABLE 37. Japan Green Building Market estimates & forecasts by segment 2018-2028 (USD Billion)
- TABLE 38. Japan Green Building Market estimates & forecasts by segment 2018-2028 (USD Billion)
- TABLE 39. RoAPAC Green Building Market estimates & forecasts, 2018-2028 (USD Billion)
- TABLE 40. RoAPAC Green Building Market estimates & forecasts by segment 2018-2028 (USD Billion)
- TABLE 41. RoAPAC Green Building Market estimates & forecasts by segment 2018-2028 (USD Billion)
- TABLE 42. Brazil Green Building Market estimates & forecasts, 2018-2028 (USD Billion)
- TABLE 43. Brazil Green Building Market estimates & forecasts by segment 2018-2028 (USD Billion)
- TABLE 44. Brazil Green Building Market estimates & forecasts by segment 2018-2028 (USD Billion)
- TABLE 45. Mexico Green Building Market estimates & forecasts, 2018-2028 (USD Billion)
- TABLE 46. Mexico Green Building Market estimates & forecasts by segment 2018-2028 (USD Billion)
- TABLE 47. Mexico Green Building Market estimates & forecasts by segment 2018-2028 (USD Billion)
- TABLE 48. RoLA Green Building Market estimates & forecasts, 2018-2028 (USD Billion)
- TABLE 49. RoLA Green Building Market estimates & forecasts by segment 2018-2028 (USD Billion)
- TABLE 50. RoLA Green Building Market estimates & forecasts by segment 2018-2028 (USD Billion)
- TABLE 51. Row Green Building Market estimates & forecasts, 2018-2028 (USD Billion)
- TABLE 52. Row Green Building Market estimates & forecasts by segment 2018-2028 (USD Billion)
- TABLE 53. Row Green Building Market estimates & forecasts by segment 2018-2028 (USD Billion)
- TABLE 54. List of secondary sources, used in the study of global Green Building Market
- TABLE 55. List of primary sources, used in the study of global Green Building Market
- TABLE 56. Years considered for the study
- TABLE 57. Exchange rates considered
LIST OF FIGURES
List of figures
- FIG 1. Global Green Building Market, research methodology
- FIG 2. Global Green Building Market, Market estimation techniques
- FIG 3. Global Market size estimates & forecast methods
- FIG 4. Global Green Building Market, key trends 2021
- FIG 5. Global Green Building Market, growth prospects 2022-2028
- FIG 6. Global Green Building Market, porters 5 force model
- FIG 7. Global Green Building Market, pest analysis
- FIG 8. Global Green Building Market, value chain analysis
- FIG 9. Global Green Building Market by segment, 2018 & 2028 (USD Billion)
- FIG 10. Global Green Building Market by segment, 2018 & 2028 (USD Billion)
- FIG 11. Global Green Building Market by segment, 2018 & 2028 (USD Billion)
- FIG 12. Global Green Building Market by segment, 2018 & 2028 (USD Billion)
- FIG 13. Global Green Building Market by segment, 2018 & 2028 (USD Billion)
- FIG 14. Global Green Building Market, regional snapshot 2018 & 2028
- FIG 15. North America Green Building Market 2018 & 2028 (USD Billion)
- FIG 16. Europe Green Building Market 2018 & 2028 (USD Billion)
- FIG 17. Asia pacific Green Building Market 2018 & 2028 (USD Billion)
- FIG 18. Latin America Green Building Market 2018 & 2028 (USD Billion)
- FIG 19. Global Green Building Market, company Market share analysis (2021)


