


 |
市場調查報告書
商品編碼
1447179
生命科學 IT 市場:按解決方案、類型和最終用戶分類:2024-2033 年全球機會分析和產業預測Life Sciences IT Market By Solution, By Type, By End User : Global Opportunity Analysis and Industry Forecast, 2024-2033 |
||||||
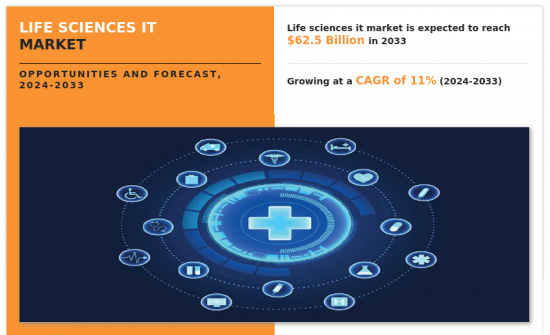
2023 年,全球生命科學 IT 市場價值為 213 億美元,預計 2024 年至 2033 年複合年成長率為 11%,到 2033 年達到 625 億美元。
生命科學IT是資訊科技在製藥、生物科技和醫療保健等生命科學領域的應用。該 IT 專業在支持和推進生命科學產業的許多方面(從研發到製造和病患照護)方面發揮著至關重要的作用。生命科學 IT 軟體和服務可協助科學家和研究人員管理大量生物和化學資料,並促進對生命科學研究各個方面的分析。該技術對於藥物發現至關重要,有助於識別潛在的治療標靶並簡化開發新藥。
由於生命科學產業擴大採用生命科學分析軟體以及實驗室自動化的發展趨勢,生命科學 IT 市場預計將顯著成長。
生命科學分析軟體的日益普及已成為生命科學 IT 市場的關鍵促進因素。這是因為人們越來越認知到高階分析在增強研發流程、最佳化業務效率和促進資料主導決策方面發揮的關鍵作用。分析軟體使生命科學公司能夠利用巨量資料和複雜資料集的力量,使研究人員和科學家能夠從大量資訊中提取有意義的見解。
先進分析工具的整合顯著簡化了藥物發現和開發流程,實現了更準確的標靶識別、更深入地了解生物途徑並加速了臨床試驗設計。例如,根據美國國家醫學圖書館2020年的報告,巨量資料正在生物資料驅動的臨床研究和其他研究領域中獲得認可。此外,分析軟體透過促進即時監控和報告,在確保法規遵循方面發揮關鍵作用,從而提高研究資料的整體品質和完整性。
此外,實驗室自動化的上升趨勢預計將成為生命科學 IT 市場成長的關鍵驅動力。生命科學 IT 解決方案旨在解決生命科學研究人員和專業人員面臨的獨特挑戰,提供整合和最佳化實驗室工作流程各個方面的綜合平台。實驗室自動化軟體的主要好處之一是資料管理,這些系統有助於無縫組織、儲存和搜尋大量複雜的科學資料。這不僅提高了資料準確性,還透過減少人工錯誤和減少管理任務上花費的時間來加快研究步伐。
此外,生命科學 IT 解決方案也為實驗室流程(從樣本追蹤、實驗效能到資料分析)的自動化做出了重大貢獻。例如,全球生命科學解決方案公司 Thermo Fisher Scientific 提供 Momentum,這是實驗室自動化的工作流程排程軟體。該軟體可讓您在功能強大且易於使用的視覺化環境中定義、執行和監控科學流程和工作流程。其直覺的調度介面、智慧資料驅動的決策能力、卓越的連接性和靈活的模擬模式可協助您實現卓越的效能。
自動化不僅加快了工作速度,還確保了實驗的一致性和可重複性。因此,實驗室自動化的成長趨勢預計將顯著促進市場成長。
然而,資料安全和隱私問題已成為限制市場成長的主要問題。生命科學產業嚴重依賴收集、儲存和分析大量敏感資料,包括病患記錄、臨床試驗資訊和基因組資料。隨著醫療保健流程變得數位化並採用雲端處理和巨量資料分析等尖端技術,資料外洩和未授權存取的風險正在增加。因此,對資料安全和隱私的擔憂預計將抑制市場成長。
生命科學 IT 市場按解決方案、類型、最終用戶和地區進行細分。依解決方案分為藥物發現資訊學、臨床試驗管理、生物資訊學、實驗室資訊管理等。依類型分為軟體和服務。依最終用戶分類,可分為製藥/生技公司、合約研發組織等。按地區分類,我們有北美(美國、加拿大、墨西哥)、歐洲(德國、英國、英國、義大利、西班牙其他歐洲國家地區)、亞太地區(中國、日本、澳洲、印度、韓國、其他亞太地區),在亞太地區(巴西、日本、阿拉伯、澳洲、印度、韓國和亞太其他地區)進行分析。
相關人員的主要利益
- 本報告對 2023 年至 2033 年生命科學 IT 市場分析的細分市場、當前趨勢、估計/趨勢分析和動態進行了定量分析,以識別生命科學 IT 市場的整體機會。
- 我們提供市場研究以及與市場促進因素、市場限制和市場機會相關的資訊。
- 波特的五力分析揭示了買家和供應商的潛力,幫助相關人員做出利潤驅動的業務決策並加強供應商和買家網路。
- 生命科學市場區隔的詳細分析有助於識別市場機會。
- 每個地區的主要國家都根據其對全球市場的收益貢獻繪製了地圖。
- 市場參與者定位有助於基準化分析,並提供對市場參與者當前地位的清晰了解。
- 該報告包括對區域和全球生命科學市場趨勢、主要企業、細分市場、應用領域和市場成長策略的分析。
該報告可以客製化。
- 監管指引
- 根據客戶興趣加入公司簡介
- 按國家或地區進行的附加分析 – 市場規模和預測
- 公司簡介的擴充列表
- 歷史市場資料
- 主要企業詳細資料(Excel 格式,包括位置、聯絡資訊、供應商/供應商網路等)
目錄
第1章簡介
第 2 章執行摘要
第3章市場概況
- 市場定義和範圍
- 主要發現
- 影響因素
- 主要投資機會
- 波特五力分析
- 市場動態
- 促進因素
- 實驗室自動化的趨勢不斷成長。
- 對先進分析工具的需求不斷成長
- 生命科學 IT 解決方案在藥物發現過程中的採用率很高。
- 抑制因素
- 資料隱私和安全問題
- 機會
- 生命科學IT技術的技術進步
- 促進因素
第 4 章生命科學 IT 市場:按解決方案
- 概述
- 藥物發現資訊學
- 臨床試驗管理
- 生物資訊學
- 臨床試驗資訊管理
- 其他
第5章生命科學 IT 市場:依類型
- 概述
- 軟體
- 服務
第 6 章 生命科學 IT 市場:以最終使用者分類
- 概述
- 製藥和生物技術公司
- 研究開發合約組織
- 其他
第 7 章 生命科學 IT 市場:按地區
- 概述
- 北美洲
- 美國
- 加拿大
- 墨西哥
- 歐洲
- 德國
- 法國
- 英國
- 義大利
- 西班牙
- 其他
- 亞太地區
- 日本
- 中國
- 印度
- 澳洲
- 韓國
- 其他
- 拉丁美洲/中東/非洲
- 巴西
- 沙烏地阿拉伯
- 南非
- 其他
第8章 競爭形勢
- 介紹
- 關鍵成功策略
- 10家主要企業產品圖譜
- 競爭對手儀表板
- 競爭熱圖
- 2023年主要企業定位
第9章 公司簡介
- Thermo Fisher Scientific Inc.
- Qiagen NV.
- Agilent Technologies, Inc.
- Oracle Corporation
- Revvity, Inc.
- Clario
- IBM Corporation
- DNAnexus, Inc.
- Genedata AG
- Illumina, Inc.
The global life sciences IT market was valued at $21.3 billion in 2023, and is projected to reach $62.5 billion by 2033, growing at a CAGR of 11% from 2024 to 2033.
Life science IT is the application of information technology in the field of life sciences, including pharmaceuticals, biotechnology, and healthcare. This specialized branch of IT plays a pivotal role in supporting and advancing various aspects of the life sciences industry, from R&D to manufacturing and patient care. Life science IT software and services aid scientists and researchers in managing vast amounts of biological and chemical data, facilitating the analysis of various aspects of life sciences research. This technology is crucial for drug discovery, helping to streamline the identification of potential therapeutic targets and the development of new drugs.
The life science IT market is expected to register significant growth, owing to rise in adoption of life sciences analytical software in life sciences industry, and growing trend towards laboratory automation.
Rise in adoption of the life sciences analytical software has emerged as major driver for the life science IT market. This can be attributed to increasing awareness about the crucial role that advanced analytics plays in enhancing R&D processes, optimizing operational efficiency, and facilitating data-driven decision-making. Analytical software enables life sciences companies to harness the power of big data and complex datasets; thereby empowering researchers and scientists to extract meaningful insights from vast pools of information.
The integration of sophisticated analytics tools has significantly streamlined drug discovery and development processes, allowing for more precise target identification, better understanding of biological pathways, and accelerated clinical trial designs. For instance, according to a 2020 report by National Library of Medicine, big data is gaining recognition in clinical studies and other research areas driven by biological data. Moreover, analytical software plays a crucial role in ensuring regulatory compliance, as it facilitates real-time monitoring and reporting; thereby enhancing the overall quality and integrity of research data.
Furthermore, the growing trend towards the laboratory automation is expected to act as a major driver for the growth of the life science IT market. Life science IT solutions are designed to address the unique challenges faced by life sciences researchers and professionals, offering a comprehensive platform that integrates and optimizes various facets of laboratory workflows. One of the key advantages of laboratory automation software lies in data management, where these software systems facilitate seamless organization, storage, and retrieval of vast volumes of complex scientific data. This not only enhances data accuracy but also accelerates the pace of research by reducing manual errors and the time spent on administrative tasks.
Furthermore, life science IT solutions contribute significantly to the automation of laboratory processes, ranging from sample tracking and experiment execution to data analysis. For instance, Thermo Fisher Scientific Inc., a global life science solution company provides Momentum workflow scheduling software for laboratory automation. It enables users to define, execute, and monitor scientific processes and workflows in a powerful yet easy-to-use visual environment. Its intuitive scheduling interface, intelligent data-driven decision-making capabilities, superior connectivity, and flexible simulation modes help attain superior performance.
Automation not only expedites tasks but also ensures consistency and reproducibility in experiments, which is a crucial factor in maintaining high-quality research standards. Thus, the growing trend towards laboratory automation is expected to contribute significantly in the growth of the market.
However, data security and privacy concerns have emerged as major concerns restraining the growth of the market. The life sciences industry relies heavily on the collection, storage, and analysis of vast amounts of sensitive and confidential data, including patient records, clinical trial information, and genomic data. With increase in digitization of healthcare processes and the adoption of advanced technologies such as cloud computing and big data analytics, the risk of data breaches and unauthorized access has escalated. Thus, data security and privacy concerns are expected to restrain the growth of the market.
The life science IT market is segmented on the basis of solution, type, end user, and region. By solution, it is divided into drug discovery informatics, clinical trial management, bioinformatics, laboratory information management, and others. By type, it is bifurcated into software and services. By end user, it is segmented into pharmaceutical and biotechnology companies, contract R&D organizations, and other. Region-wise, the market is analyzed across North America (the U.S., Canada, and Mexico), Europe (Germany, France, the UK, Italy, Spain, and rest of Europe), Asia-Pacific (China, Japan, Australia, India, South Korea, and rest of Asia-Pacific), and LAMEA (Brazil, South Africa, Saudi Arabia, and rest of LAMEA).
The major players profiled in the report are Thermo Fisher Scientific Inc, Illumina, Qiagen N.V., Revvity, Inc, Agilent Technologies Inc, Oracle, Clario Inc, IBM Corp, DNAnexus Inc, and Genedata AG.
Key Benefits For Stakeholders
- This report provides a quantitative analysis of the market segments, current trends, estimations, and dynamics of the life sciences it market analysis from 2023 to 2033 to identify the prevailing life sciences it market opportunities.
- The market research is offered along with information related to key drivers, restraints, and opportunities.
- Porter's five forces analysis highlights the potency of buyers and suppliers to enable stakeholders make profit-oriented business decisions and strengthen their supplier-buyer network.
- In-depth analysis of the life sciences it market segmentation assists to determine the prevailing market opportunities.
- Major countries in each region are mapped according to their revenue contribution to the global market.
- Market player positioning facilitates benchmarking and provides a clear understanding of the present position of the market players.
- The report includes the analysis of the regional as well as global life sciences it market trends, key players, market segments, application areas, and market growth strategies.
Additional benefits you will get with this purchase are:
- Quarterly Update and* (only available with a corporate license, on listed price)
- 5 additional Company Profile of client Choice pre- or Post-purchase, as a free update.
- Free Upcoming Version on the Purchase of Five and Enterprise User License.
- 16 analyst hours of support* (post-purchase, if you find additional data requirements upon review of the report, you may receive support amounting to 16 analyst hours to solve questions, and post-sale queries)
- 15% Free Customization* (in case the scope or segment of the report does not match your requirements, 15% is equivalent to 3 working days of free work, applicable once)
- Free data Pack on the Five and Enterprise User License. (Excel version of the report)
- Free Updated report if the report is 6-12 months old or older.
- 24-hour priority response*
- Free Industry updates and white papers.
Possible Customization with this report (with additional cost and timeline, please talk to the sales executive to know more)
- Regulatory Guidelines
- Additional company profiles with specific to client's interest
- Additional country or region analysis- market size and forecast
- Expanded list for Company Profiles
- Historic market data
- Key player details (including location, contact details, supplier/vendor network etc. in excel format)
Key Market Segments
By Solution
- Drug Discovery Informatics
- Clinical Trial Management
- Bioinformatics
- Laboratory Information Management
- Others
By Type
- Software
- Service
By End User
- Others
- Pharmaceutical and Biotechnology Companies
- Contract Research and Development Organizations
By Region
- North America
- U.S.
- Canada
- Mexico
- Europe
- Germany
- France
- UK
- Italy
- Spain
- Rest of Europe
- Asia-Pacific
- Japan
- China
- India
- Australia
- South Korea
- Rest of Asia-Pacific
- LAMEA
- Brazil
- Saudi Arabia
- South Africa
- Rest of LAMEA
Key Market Players:
- Thermo Fisher Scientific Inc.
- Qiagen NV.
- Agilent Technologies, Inc.
- Oracle Corporation
- Clario
- IBM Corporation
- Genedata AG
- Illumina, Inc.
- Revvity, Inc.
- DNAnexus, Inc.
TABLE OF CONTENTS
CHAPTER 1: INTRODUCTION
- 1.1. Report description
- 1.2. Key market segments
- 1.3. Key benefits to the stakeholders
- 1.4. Research methodology
- 1.4.1. Primary research
- 1.4.2. Secondary research
- 1.4.3. Analyst tools and models
CHAPTER 2: EXECUTIVE SUMMARY
- 2.1. CXO Perspective
CHAPTER 3: MARKET OVERVIEW
- 3.1. Market definition and scope
- 3.2. Key findings
- 3.2.1. Top impacting factors
- 3.2.2. Top investment pockets
- 3.3. Porter's five forces analysis
- 3.3.1. Low bargaining power of suppliers
- 3.3.2. Low threat of new entrants
- 3.3.3. Low threat of substitutes
- 3.3.4. Low intensity of rivalry
- 3.3.5. Low bargaining power of buyers
- 3.4. Market dynamics
- 3.4.1. Drivers
- 3.4.1.1. Growing trend towards laboratory automation.
- 3.4.1.2. Rise in demand for advance analytical tool
- 3.4.1.3. High adoption of life sciences IT solutions in drug discovery process.
- 3.4.2. Restraints
- 3.4.2.1. Data privacy and security concerns
- 3.4.3. Opportunities
- 3.4.3.1. Technological advancement in life sciences IT technology
- 3.4.1. Drivers
CHAPTER 4: LIFE SCIENCES IT MARKET, BY SOLUTION
- 4.1. Overview
- 4.1.1. Market size and forecast
- 4.2. Drug Discovery Informatics
- 4.2.1. Key market trends, growth factors and opportunities
- 4.2.2. Market size and forecast, by region
- 4.2.3. Market share analysis by country
- 4.3. Clinical Trial Management
- 4.3.1. Key market trends, growth factors and opportunities
- 4.3.2. Market size and forecast, by region
- 4.3.3. Market share analysis by country
- 4.4. Bioinformatics
- 4.4.1. Key market trends, growth factors and opportunities
- 4.4.2. Market size and forecast, by region
- 4.4.3. Market share analysis by country
- 4.5. Laboratory Information Management
- 4.5.1. Key market trends, growth factors and opportunities
- 4.5.2. Market size and forecast, by region
- 4.5.3. Market share analysis by country
- 4.6. Others
- 4.6.1. Key market trends, growth factors and opportunities
- 4.6.2. Market size and forecast, by region
- 4.6.3. Market share analysis by country
CHAPTER 5: LIFE SCIENCES IT MARKET, BY TYPE
- 5.1. Overview
- 5.1.1. Market size and forecast
- 5.2. Software
- 5.2.1. Key market trends, growth factors and opportunities
- 5.2.2. Market size and forecast, by region
- 5.2.3. Market share analysis by country
- 5.3. Service
- 5.3.1. Key market trends, growth factors and opportunities
- 5.3.2. Market size and forecast, by region
- 5.3.3. Market share analysis by country
CHAPTER 6: LIFE SCIENCES IT MARKET, BY END USER
- 6.1. Overview
- 6.1.1. Market size and forecast
- 6.2. Pharmaceutical and Biotechnology Companies
- 6.2.1. Key market trends, growth factors and opportunities
- 6.2.2. Market size and forecast, by region
- 6.2.3. Market share analysis by country
- 6.3. Contract Research and Development Organizations
- 6.3.1. Key market trends, growth factors and opportunities
- 6.3.2. Market size and forecast, by region
- 6.3.3. Market share analysis by country
- 6.4. Others
- 6.4.1. Key market trends, growth factors and opportunities
- 6.4.2. Market size and forecast, by region
- 6.4.3. Market share analysis by country
CHAPTER 7: LIFE SCIENCES IT MARKET, BY REGION
- 7.1. Overview
- 7.1.1. Market size and forecast By Region
- 7.2. North America
- 7.2.1. Key market trends, growth factors and opportunities
- 7.2.2. Market size and forecast, by Solution
- 7.2.3. Market size and forecast, by Type
- 7.2.4. Market size and forecast, by End User
- 7.2.5. Market size and forecast, by country
- 7.2.5.1. U.S.
- 7.2.5.1.1. Market size and forecast, by Solution
- 7.2.5.1.2. Market size and forecast, by Type
- 7.2.5.1.3. Market size and forecast, by End User
- 7.2.5.2. Canada
- 7.2.5.2.1. Market size and forecast, by Solution
- 7.2.5.2.2. Market size and forecast, by Type
- 7.2.5.2.3. Market size and forecast, by End User
- 7.2.5.3. Mexico
- 7.2.5.3.1. Market size and forecast, by Solution
- 7.2.5.3.2. Market size and forecast, by Type
- 7.2.5.3.3. Market size and forecast, by End User
- 7.3. Europe
- 7.3.1. Key market trends, growth factors and opportunities
- 7.3.2. Market size and forecast, by Solution
- 7.3.3. Market size and forecast, by Type
- 7.3.4. Market size and forecast, by End User
- 7.3.5. Market size and forecast, by country
- 7.3.5.1. Germany
- 7.3.5.1.1. Market size and forecast, by Solution
- 7.3.5.1.2. Market size and forecast, by Type
- 7.3.5.1.3. Market size and forecast, by End User
- 7.3.5.2. France
- 7.3.5.2.1. Market size and forecast, by Solution
- 7.3.5.2.2. Market size and forecast, by Type
- 7.3.5.2.3. Market size and forecast, by End User
- 7.3.5.3. UK
- 7.3.5.3.1. Market size and forecast, by Solution
- 7.3.5.3.2. Market size and forecast, by Type
- 7.3.5.3.3. Market size and forecast, by End User
- 7.3.5.4. Italy
- 7.3.5.4.1. Market size and forecast, by Solution
- 7.3.5.4.2. Market size and forecast, by Type
- 7.3.5.4.3. Market size and forecast, by End User
- 7.3.5.5. Spain
- 7.3.5.5.1. Market size and forecast, by Solution
- 7.3.5.5.2. Market size and forecast, by Type
- 7.3.5.5.3. Market size and forecast, by End User
- 7.3.5.6. Rest of Europe
- 7.3.5.6.1. Market size and forecast, by Solution
- 7.3.5.6.2. Market size and forecast, by Type
- 7.3.5.6.3. Market size and forecast, by End User
- 7.4. Asia-Pacific
- 7.4.1. Key market trends, growth factors and opportunities
- 7.4.2. Market size and forecast, by Solution
- 7.4.3. Market size and forecast, by Type
- 7.4.4. Market size and forecast, by End User
- 7.4.5. Market size and forecast, by country
- 7.4.5.1. Japan
- 7.4.5.1.1. Market size and forecast, by Solution
- 7.4.5.1.2. Market size and forecast, by Type
- 7.4.5.1.3. Market size and forecast, by End User
- 7.4.5.2. China
- 7.4.5.2.1. Market size and forecast, by Solution
- 7.4.5.2.2. Market size and forecast, by Type
- 7.4.5.2.3. Market size and forecast, by End User
- 7.4.5.3. India
- 7.4.5.3.1. Market size and forecast, by Solution
- 7.4.5.3.2. Market size and forecast, by Type
- 7.4.5.3.3. Market size and forecast, by End User
- 7.4.5.4. Australia
- 7.4.5.4.1. Market size and forecast, by Solution
- 7.4.5.4.2. Market size and forecast, by Type
- 7.4.5.4.3. Market size and forecast, by End User
- 7.4.5.5. South Korea
- 7.4.5.5.1. Market size and forecast, by Solution
- 7.4.5.5.2. Market size and forecast, by Type
- 7.4.5.5.3. Market size and forecast, by End User
- 7.4.5.6. Rest of Asia-Pacific
- 7.4.5.6.1. Market size and forecast, by Solution
- 7.4.5.6.2. Market size and forecast, by Type
- 7.4.5.6.3. Market size and forecast, by End User
- 7.5. LAMEA
- 7.5.1. Key market trends, growth factors and opportunities
- 7.5.2. Market size and forecast, by Solution
- 7.5.3. Market size and forecast, by Type
- 7.5.4. Market size and forecast, by End User
- 7.5.5. Market size and forecast, by country
- 7.5.5.1. Brazil
- 7.5.5.1.1. Market size and forecast, by Solution
- 7.5.5.1.2. Market size and forecast, by Type
- 7.5.5.1.3. Market size and forecast, by End User
- 7.5.5.2. Saudi Arabia
- 7.5.5.2.1. Market size and forecast, by Solution
- 7.5.5.2.2. Market size and forecast, by Type
- 7.5.5.2.3. Market size and forecast, by End User
- 7.5.5.3. South Africa
- 7.5.5.3.1. Market size and forecast, by Solution
- 7.5.5.3.2. Market size and forecast, by Type
- 7.5.5.3.3. Market size and forecast, by End User
- 7.5.5.4. Rest of LAMEA
- 7.5.5.4.1. Market size and forecast, by Solution
- 7.5.5.4.2. Market size and forecast, by Type
- 7.5.5.4.3. Market size and forecast, by End User
CHAPTER 8: COMPETITIVE LANDSCAPE
- 8.1. Introduction
- 8.2. Top winning strategies
- 8.3. Product mapping of top 10 player
- 8.4. Competitive dashboard
- 8.5. Competitive heatmap
- 8.6. Top player positioning, 2023
CHAPTER 9: COMPANY PROFILES
- 9.1. Thermo Fisher Scientific Inc.
- 9.1.1. Company overview
- 9.1.2. Key executives
- 9.1.3. Company snapshot
- 9.1.4. Operating business segments
- 9.1.5. Product portfolio
- 9.1.6. Business performance
- 9.2. Qiagen NV.
- 9.2.1. Company overview
- 9.2.2. Key executives
- 9.2.3. Company snapshot
- 9.2.4. Operating business segments
- 9.2.5. Product portfolio
- 9.2.6. Business performance
- 9.2.7. Key strategic moves and developments
- 9.3. Agilent Technologies, Inc.
- 9.3.1. Company overview
- 9.3.2. Key executives
- 9.3.3. Company snapshot
- 9.3.4. Operating business segments
- 9.3.5. Product portfolio
- 9.3.6. Business performance
- 9.4. Oracle Corporation
- 9.4.1. Company overview
- 9.4.2. Key executives
- 9.4.3. Company snapshot
- 9.4.4. Operating business segments
- 9.4.5. Product portfolio
- 9.4.6. Business performance
- 9.5. Revvity, Inc.
- 9.5.1. Company overview
- 9.5.2. Key executives
- 9.5.3. Company snapshot
- 9.5.4. Operating business segments
- 9.5.5. Product portfolio
- 9.5.6. Key strategic moves and developments
- 9.6. Clario
- 9.6.1. Company overview
- 9.6.2. Key executives
- 9.6.3. Company snapshot
- 9.6.4. Operating business segments
- 9.6.5. Product portfolio
- 9.6.6. Key strategic moves and developments
- 9.7. IBM Corporation
- 9.7.1. Company overview
- 9.7.2. Key executives
- 9.7.3. Company snapshot
- 9.7.4. Operating business segments
- 9.7.5. Product portfolio
- 9.7.6. Business performance
- 9.8. DNAnexus, Inc.
- 9.8.1. Company overview
- 9.8.2. Key executives
- 9.8.3. Company snapshot
- 9.8.4. Operating business segments
- 9.8.5. Product portfolio
- 9.8.6. Key strategic moves and developments
- 9.9. Genedata AG
- 9.9.1. Company overview
- 9.9.2. Key executives
- 9.9.3. Company snapshot
- 9.9.4. Operating business segments
- 9.9.5. Product portfolio
- 9.9.6. Key strategic moves and developments
- 9.10. Illumina, Inc.
- 9.10.1. Company overview
- 9.10.2. Key executives
- 9.10.3. Company snapshot
- 9.10.4. Operating business segments
- 9.10.5. Product portfolio
- 9.10.6. Business performance
LIST OF TABLES
- TABLE 01. GLOBAL LIFE SCIENCES IT MARKET, BY SOLUTION, 2023-2033 ($MILLION)
- TABLE 02. LIFE SCIENCES IT MARKET FOR DRUG DISCOVERY INFORMATICS, BY REGION, 2023-2033 ($MILLION)
- TABLE 03. LIFE SCIENCES IT MARKET FOR CLINICAL TRIAL MANAGEMENT, BY REGION, 2023-2033 ($MILLION)
- TABLE 04. LIFE SCIENCES IT MARKET FOR BIOINFORMATICS, BY REGION, 2023-2033 ($MILLION)
- TABLE 05. LIFE SCIENCES IT MARKET FOR LABORATORY INFORMATION MANAGEMENT, BY REGION, 2023-2033 ($MILLION)
- TABLE 06. LIFE SCIENCES IT MARKET FOR OTHERS, BY REGION, 2023-2033 ($MILLION)
- TABLE 07. GLOBAL LIFE SCIENCES IT MARKET, BY TYPE, 2023-2033 ($MILLION)
- TABLE 08. LIFE SCIENCES IT MARKET FOR SOFTWARE, BY REGION, 2023-2033 ($MILLION)
- TABLE 09. LIFE SCIENCES IT MARKET FOR SERVICE, BY REGION, 2023-2033 ($MILLION)
- TABLE 10. GLOBAL LIFE SCIENCES IT MARKET, BY END USER, 2023-2033 ($MILLION)
- TABLE 11. LIFE SCIENCES IT MARKET FOR PHARMACEUTICAL AND BIOTECHNOLOGY COMPANIES, BY REGION, 2023-2033 ($MILLION)
- TABLE 12. LIFE SCIENCES IT MARKET FOR CONTRACT RESEARCH AND DEVELOPMENT ORGANIZATIONS, BY REGION, 2023-2033 ($MILLION)
- TABLE 13. LIFE SCIENCES IT MARKET FOR OTHERS, BY REGION, 2023-2033 ($MILLION)
- TABLE 14. LIFE SCIENCES IT MARKET, BY REGION, 2023-2033 ($MILLION)
- TABLE 15. NORTH AMERICA LIFE SCIENCES IT MARKET, BY SOLUTION, 2023-2033 ($MILLION)
- TABLE 16. NORTH AMERICA LIFE SCIENCES IT MARKET, BY TYPE, 2023-2033 ($MILLION)
- TABLE 17. NORTH AMERICA LIFE SCIENCES IT MARKET, BY END USER, 2023-2033 ($MILLION)
- TABLE 18. NORTH AMERICA LIFE SCIENCES IT MARKET, BY COUNTRY, 2023-2033 ($MILLION)
- TABLE 19. U.S. LIFE SCIENCES IT MARKET, BY SOLUTION, 2023-2033 ($MILLION)
- TABLE 20. U.S. LIFE SCIENCES IT MARKET, BY TYPE, 2023-2033 ($MILLION)
- TABLE 21. U.S. LIFE SCIENCES IT MARKET, BY END USER, 2023-2033 ($MILLION)
- TABLE 22. CANADA LIFE SCIENCES IT MARKET, BY SOLUTION, 2023-2033 ($MILLION)
- TABLE 23. CANADA LIFE SCIENCES IT MARKET, BY TYPE, 2023-2033 ($MILLION)
- TABLE 24. CANADA LIFE SCIENCES IT MARKET, BY END USER, 2023-2033 ($MILLION)
- TABLE 25. MEXICO LIFE SCIENCES IT MARKET, BY SOLUTION, 2023-2033 ($MILLION)
- TABLE 26. MEXICO LIFE SCIENCES IT MARKET, BY TYPE, 2023-2033 ($MILLION)
- TABLE 27. MEXICO LIFE SCIENCES IT MARKET, BY END USER, 2023-2033 ($MILLION)
- TABLE 28. EUROPE LIFE SCIENCES IT MARKET, BY SOLUTION, 2023-2033 ($MILLION)
- TABLE 29. EUROPE LIFE SCIENCES IT MARKET, BY TYPE, 2023-2033 ($MILLION)
- TABLE 30. EUROPE LIFE SCIENCES IT MARKET, BY END USER, 2023-2033 ($MILLION)
- TABLE 31. EUROPE LIFE SCIENCES IT MARKET, BY COUNTRY, 2023-2033 ($MILLION)
- TABLE 32. GERMANY LIFE SCIENCES IT MARKET, BY SOLUTION, 2023-2033 ($MILLION)
- TABLE 33. GERMANY LIFE SCIENCES IT MARKET, BY TYPE, 2023-2033 ($MILLION)
- TABLE 34. GERMANY LIFE SCIENCES IT MARKET, BY END USER, 2023-2033 ($MILLION)
- TABLE 35. FRANCE LIFE SCIENCES IT MARKET, BY SOLUTION, 2023-2033 ($MILLION)
- TABLE 36. FRANCE LIFE SCIENCES IT MARKET, BY TYPE, 2023-2033 ($MILLION)
- TABLE 37. FRANCE LIFE SCIENCES IT MARKET, BY END USER, 2023-2033 ($MILLION)
- TABLE 38. UK LIFE SCIENCES IT MARKET, BY SOLUTION, 2023-2033 ($MILLION)
- TABLE 39. UK LIFE SCIENCES IT MARKET, BY TYPE, 2023-2033 ($MILLION)
- TABLE 40. UK LIFE SCIENCES IT MARKET, BY END USER, 2023-2033 ($MILLION)
- TABLE 41. ITALY LIFE SCIENCES IT MARKET, BY SOLUTION, 2023-2033 ($MILLION)
- TABLE 42. ITALY LIFE SCIENCES IT MARKET, BY TYPE, 2023-2033 ($MILLION)
- TABLE 43. ITALY LIFE SCIENCES IT MARKET, BY END USER, 2023-2033 ($MILLION)
- TABLE 44. SPAIN LIFE SCIENCES IT MARKET, BY SOLUTION, 2023-2033 ($MILLION)
- TABLE 45. SPAIN LIFE SCIENCES IT MARKET, BY TYPE, 2023-2033 ($MILLION)
- TABLE 46. SPAIN LIFE SCIENCES IT MARKET, BY END USER, 2023-2033 ($MILLION)
- TABLE 47. REST OF EUROPE LIFE SCIENCES IT MARKET, BY SOLUTION, 2023-2033 ($MILLION)
- TABLE 48. REST OF EUROPE LIFE SCIENCES IT MARKET, BY TYPE, 2023-2033 ($MILLION)
- TABLE 49. REST OF EUROPE LIFE SCIENCES IT MARKET, BY END USER, 2023-2033 ($MILLION)
- TABLE 50. ASIA-PACIFIC LIFE SCIENCES IT MARKET, BY SOLUTION, 2023-2033 ($MILLION)
- TABLE 51. ASIA-PACIFIC LIFE SCIENCES IT MARKET, BY TYPE, 2023-2033 ($MILLION)
- TABLE 52. ASIA-PACIFIC LIFE SCIENCES IT MARKET, BY END USER, 2023-2033 ($MILLION)
- TABLE 53. ASIA-PACIFIC LIFE SCIENCES IT MARKET, BY COUNTRY, 2023-2033 ($MILLION)
- TABLE 54. JAPAN LIFE SCIENCES IT MARKET, BY SOLUTION, 2023-2033 ($MILLION)
- TABLE 55. JAPAN LIFE SCIENCES IT MARKET, BY TYPE, 2023-2033 ($MILLION)
- TABLE 56. JAPAN LIFE SCIENCES IT MARKET, BY END USER, 2023-2033 ($MILLION)
- TABLE 57. CHINA LIFE SCIENCES IT MARKET, BY SOLUTION, 2023-2033 ($MILLION)
- TABLE 58. CHINA LIFE SCIENCES IT MARKET, BY TYPE, 2023-2033 ($MILLION)
- TABLE 59. CHINA LIFE SCIENCES IT MARKET, BY END USER, 2023-2033 ($MILLION)
- TABLE 60. INDIA LIFE SCIENCES IT MARKET, BY SOLUTION, 2023-2033 ($MILLION)
- TABLE 61. INDIA LIFE SCIENCES IT MARKET, BY TYPE, 2023-2033 ($MILLION)
- TABLE 62. INDIA LIFE SCIENCES IT MARKET, BY END USER, 2023-2033 ($MILLION)
- TABLE 63. AUSTRALIA LIFE SCIENCES IT MARKET, BY SOLUTION, 2023-2033 ($MILLION)
- TABLE 64. AUSTRALIA LIFE SCIENCES IT MARKET, BY TYPE, 2023-2033 ($MILLION)
- TABLE 65. AUSTRALIA LIFE SCIENCES IT MARKET, BY END USER, 2023-2033 ($MILLION)
- TABLE 66. SOUTH KOREA LIFE SCIENCES IT MARKET, BY SOLUTION, 2023-2033 ($MILLION)
- TABLE 67. SOUTH KOREA LIFE SCIENCES IT MARKET, BY TYPE, 2023-2033 ($MILLION)
- TABLE 68. SOUTH KOREA LIFE SCIENCES IT MARKET, BY END USER, 2023-2033 ($MILLION)
- TABLE 69. REST OF ASIA-PACIFIC LIFE SCIENCES IT MARKET, BY SOLUTION, 2023-2033 ($MILLION)
- TABLE 70. REST OF ASIA-PACIFIC LIFE SCIENCES IT MARKET, BY TYPE, 2023-2033 ($MILLION)
- TABLE 71. REST OF ASIA-PACIFIC LIFE SCIENCES IT MARKET, BY END USER, 2023-2033 ($MILLION)
- TABLE 72. LAMEA LIFE SCIENCES IT MARKET, BY SOLUTION, 2023-2033 ($MILLION)
- TABLE 73. LAMEA LIFE SCIENCES IT MARKET, BY TYPE, 2023-2033 ($MILLION)
- TABLE 74. LAMEA LIFE SCIENCES IT MARKET, BY END USER, 2023-2033 ($MILLION)
- TABLE 75. LAMEA LIFE SCIENCES IT MARKET, BY COUNTRY, 2023-2033 ($MILLION)
- TABLE 76. BRAZIL LIFE SCIENCES IT MARKET, BY SOLUTION, 2023-2033 ($MILLION)
- TABLE 77. BRAZIL LIFE SCIENCES IT MARKET, BY TYPE, 2023-2033 ($MILLION)
- TABLE 78. BRAZIL LIFE SCIENCES IT MARKET, BY END USER, 2023-2033 ($MILLION)
- TABLE 79. SAUDI ARABIA LIFE SCIENCES IT MARKET, BY SOLUTION, 2023-2033 ($MILLION)
- TABLE 80. SAUDI ARABIA LIFE SCIENCES IT MARKET, BY TYPE, 2023-2033 ($MILLION)
- TABLE 81. SAUDI ARABIA LIFE SCIENCES IT MARKET, BY END USER, 2023-2033 ($MILLION)
- TABLE 82. SOUTH AFRICA LIFE SCIENCES IT MARKET, BY SOLUTION, 2023-2033 ($MILLION)
- TABLE 83. SOUTH AFRICA LIFE SCIENCES IT MARKET, BY TYPE, 2023-2033 ($MILLION)
- TABLE 84. SOUTH AFRICA LIFE SCIENCES IT MARKET, BY END USER, 2023-2033 ($MILLION)
- TABLE 85. REST OF LAMEA LIFE SCIENCES IT MARKET, BY SOLUTION, 2023-2033 ($MILLION)
- TABLE 86. REST OF LAMEA LIFE SCIENCES IT MARKET, BY TYPE, 2023-2033 ($MILLION)
- TABLE 87. REST OF LAMEA LIFE SCIENCES IT MARKET, BY END USER, 2023-2033 ($MILLION)
- TABLE 88. THERMO FISHER SCIENTIFIC INC. : KEY EXECUTIVES
- TABLE 89. THERMO FISHER SCIENTIFIC INC. : COMPANY SNAPSHOT
- TABLE 90. THERMO FISHER SCIENTIFIC INC. : PRODUCT SEGMENTS
- TABLE 91. THERMO FISHER SCIENTIFIC INC. : SERVICE SEGMENTS
- TABLE 92. THERMO FISHER SCIENTIFIC INC. : PRODUCT PORTFOLIO
- TABLE 93. QIAGEN NV.: KEY EXECUTIVES
- TABLE 94. QIAGEN NV.: COMPANY SNAPSHOT
- TABLE 95. QIAGEN NV.: PRODUCT SEGMENTS
- TABLE 96. QIAGEN NV.: PRODUCT PORTFOLIO
- TABLE 97. QIAGEN NV.: KEY STRATERGIES
- TABLE 98. AGILENT TECHNOLOGIES, INC.: KEY EXECUTIVES
- TABLE 99. AGILENT TECHNOLOGIES, INC.: COMPANY SNAPSHOT
- TABLE 100. AGILENT TECHNOLOGIES, INC.: PRODUCT SEGMENTS
- TABLE 101. AGILENT TECHNOLOGIES, INC.: PRODUCT PORTFOLIO
- TABLE 102. ORACLE CORPORATION: KEY EXECUTIVES
- TABLE 103. ORACLE CORPORATION: COMPANY SNAPSHOT
- TABLE 104. ORACLE CORPORATION: SERVICE SEGMENTS
- TABLE 105. ORACLE CORPORATION: PRODUCT PORTFOLIO
- TABLE 106. REVVITY, INC.: KEY EXECUTIVES
- TABLE 107. REVVITY, INC.: COMPANY SNAPSHOT
- TABLE 108. REVVITY, INC.: PRODUCT SEGMENTS
- TABLE 109. REVVITY, INC.: PRODUCT PORTFOLIO
- TABLE 110. REVVITY, INC.: KEY STRATERGIES
- TABLE 111. CLARIO: KEY EXECUTIVES
- TABLE 112. CLARIO: COMPANY SNAPSHOT
- TABLE 113. CLARIO: PRODUCT SEGMENTS
- TABLE 114. CLARIO: PRODUCT PORTFOLIO
- TABLE 115. CLARIO: KEY STRATERGIES
- TABLE 116. IBM CORPORATION: KEY EXECUTIVES
- TABLE 117. IBM CORPORATION: COMPANY SNAPSHOT
- TABLE 118. IBM CORPORATION: PRODUCT SEGMENTS
- TABLE 119. IBM CORPORATION: PRODUCT PORTFOLIO
- TABLE 120. DNANEXUS, INC.: KEY EXECUTIVES
- TABLE 121. DNANEXUS, INC.: COMPANY SNAPSHOT
- TABLE 122. DNANEXUS, INC.: PRODUCT SEGMENTS
- TABLE 123. DNANEXUS, INC.: PRODUCT PORTFOLIO
- TABLE 124. DNANEXUS, INC.: KEY STRATERGIES
- TABLE 125. GENEDATA AG: KEY EXECUTIVES
- TABLE 126. GENEDATA AG: COMPANY SNAPSHOT
- TABLE 127. GENEDATA AG: PRODUCT SEGMENTS
- TABLE 128. GENEDATA AG: PRODUCT PORTFOLIO
- TABLE 129. GENEDATA AG: KEY STRATERGIES
- TABLE 130. ILLUMINA, INC.: KEY EXECUTIVES
- TABLE 131. ILLUMINA, INC.: COMPANY SNAPSHOT
- TABLE 132. ILLUMINA, INC.: PRODUCT SEGMENTS
- TABLE 133. ILLUMINA, INC.: PRODUCT PORTFOLIO
LIST OF FIGURES
- FIGURE 01. LIFE SCIENCES IT MARKET, 2023-2033
- FIGURE 02. SEGMENTATION OF LIFE SCIENCES IT MARKET,2023-2033
- FIGURE 03. TOP IMPACTING FACTORS IN LIFE SCIENCES IT MARKET (2023 TO 2024)
- FIGURE 04. TOP INVESTMENT POCKETS IN LIFE SCIENCES IT MARKET (2024-2033)
- FIGURE 05. LOW BARGAINING POWER OF SUPPLIERS
- FIGURE 06. LOW THREAT OF NEW ENTRANTS
- FIGURE 07. LOW THREAT OF SUBSTITUTES
- FIGURE 08. LOW INTENSITY OF RIVALRY
- FIGURE 09. LOW BARGAINING POWER OF BUYERS
- FIGURE 10. GLOBAL LIFE SCIENCES IT MARKET:DRIVERS, RESTRAINTS AND OPPORTUNITIES
- FIGURE 11. LIFE SCIENCES IT MARKET, BY SOLUTION, 2023 AND 2033(%)
- FIGURE 12. COMPARATIVE SHARE ANALYSIS OF LIFE SCIENCES IT MARKET FOR DRUG DISCOVERY INFORMATICS, BY COUNTRY 2023 AND 2033(%)
- FIGURE 13. COMPARATIVE SHARE ANALYSIS OF LIFE SCIENCES IT MARKET FOR CLINICAL TRIAL MANAGEMENT, BY COUNTRY 2023 AND 2033(%)
- FIGURE 14. COMPARATIVE SHARE ANALYSIS OF LIFE SCIENCES IT MARKET FOR BIOINFORMATICS, BY COUNTRY 2023 AND 2033(%)
- FIGURE 15. COMPARATIVE SHARE ANALYSIS OF LIFE SCIENCES IT MARKET FOR LABORATORY INFORMATION MANAGEMENT, BY COUNTRY 2023 AND 2033(%)
- FIGURE 16. COMPARATIVE SHARE ANALYSIS OF LIFE SCIENCES IT MARKET FOR OTHERS, BY COUNTRY 2023 AND 2033(%)
- FIGURE 17. LIFE SCIENCES IT MARKET, BY TYPE, 2023 AND 2033(%)
- FIGURE 18. COMPARATIVE SHARE ANALYSIS OF LIFE SCIENCES IT MARKET FOR SOFTWARE, BY COUNTRY 2023 AND 2033(%)
- FIGURE 19. COMPARATIVE SHARE ANALYSIS OF LIFE SCIENCES IT MARKET FOR SERVICE, BY COUNTRY 2023 AND 2033(%)
- FIGURE 20. LIFE SCIENCES IT MARKET, BY END USER, 2023 AND 2033(%)
- FIGURE 21. COMPARATIVE SHARE ANALYSIS OF LIFE SCIENCES IT MARKET FOR PHARMACEUTICAL AND BIOTECHNOLOGY COMPANIES, BY COUNTRY 2023 AND 2033(%)
- FIGURE 22. COMPARATIVE SHARE ANALYSIS OF LIFE SCIENCES IT MARKET FOR CONTRACT RESEARCH AND DEVELOPMENT ORGANIZATIONS, BY COUNTRY 2023 AND 2033(%)
- FIGURE 23. COMPARATIVE SHARE ANALYSIS OF LIFE SCIENCES IT MARKET FOR OTHERS, BY COUNTRY 2023 AND 2033(%)
- FIGURE 24. LIFE SCIENCES IT MARKET BY REGION, 2023 AND 2033(%)
- FIGURE 25. U.S. LIFE SCIENCES IT MARKET, 2023-2033 ($MILLION)
- FIGURE 26. CANADA LIFE SCIENCES IT MARKET, 2023-2033 ($MILLION)
- FIGURE 27. MEXICO LIFE SCIENCES IT MARKET, 2023-2033 ($MILLION)
- FIGURE 28. GERMANY LIFE SCIENCES IT MARKET, 2023-2033 ($MILLION)
- FIGURE 29. FRANCE LIFE SCIENCES IT MARKET, 2023-2033 ($MILLION)
- FIGURE 30. UK LIFE SCIENCES IT MARKET, 2023-2033 ($MILLION)
- FIGURE 31. ITALY LIFE SCIENCES IT MARKET, 2023-2033 ($MILLION)
- FIGURE 32. SPAIN LIFE SCIENCES IT MARKET, 2023-2033 ($MILLION)
- FIGURE 33. REST OF EUROPE LIFE SCIENCES IT MARKET, 2023-2033 ($MILLION)
- FIGURE 34. JAPAN LIFE SCIENCES IT MARKET, 2023-2033 ($MILLION)
- FIGURE 35. CHINA LIFE SCIENCES IT MARKET, 2023-2033 ($MILLION)
- FIGURE 36. INDIA LIFE SCIENCES IT MARKET, 2023-2033 ($MILLION)
- FIGURE 37. AUSTRALIA LIFE SCIENCES IT MARKET, 2023-2033 ($MILLION)
- FIGURE 38. SOUTH KOREA LIFE SCIENCES IT MARKET, 2023-2033 ($MILLION)
- FIGURE 39. REST OF ASIA-PACIFIC LIFE SCIENCES IT MARKET, 2023-2033 ($MILLION)
- FIGURE 40. BRAZIL LIFE SCIENCES IT MARKET, 2023-2033 ($MILLION)
- FIGURE 41. SAUDI ARABIA LIFE SCIENCES IT MARKET, 2023-2033 ($MILLION)
- FIGURE 42. SOUTH AFRICA LIFE SCIENCES IT MARKET, 2023-2033 ($MILLION)
- FIGURE 43. REST OF LAMEA LIFE SCIENCES IT MARKET, 2023-2033 ($MILLION)
- FIGURE 44. TOP WINNING STRATEGIES, BY YEAR (2021-2024)
- FIGURE 45. TOP WINNING STRATEGIES, BY DEVELOPMENT (2021-2024)
- FIGURE 46. TOP WINNING STRATEGIES, BY COMPANY (2021-2024)
- FIGURE 47. PRODUCT MAPPING OF TOP 10 PLAYERS
- FIGURE 48. COMPETITIVE DASHBOARD
- FIGURE 49. COMPETITIVE HEATMAP: LIFE SCIENCES IT MARKET
- FIGURE 50. TOP PLAYER POSITIONING, 2023
- FIGURE 51. THERMO FISHER SCIENTIFIC INC. : NET REVENUE, 2020-2022 ($MILLION)
- FIGURE 52. THERMO FISHER SCIENTIFIC INC. : REVENUE SHARE BY SEGMENT, 2022 (%)
- FIGURE 53. THERMO FISHER SCIENTIFIC INC. : REVENUE SHARE BY REGION, 2022 (%)
- FIGURE 54. QIAGEN NV.: NET REVENUE, 2020-2022 ($MILLION)
- FIGURE 55. QIAGEN NV.: REVENUE SHARE BY REGION, 2022 (%)
- FIGURE 56. QIAGEN NV.: REVENUE SHARE BY SEGMENT, 2022 (%)
- FIGURE 57. AGILENT TECHNOLOGIES, INC.: NET REVENUE, 2020-2022 ($MILLION)
- FIGURE 58. AGILENT TECHNOLOGIES, INC.: RESEARCH & DEVELOPMENT EXPENDITURE, 2020-2022 ($MILLION)
- FIGURE 59. AGILENT TECHNOLOGIES, INC.: REVENUE SHARE BY SEGMENT, 2022 (%)
- FIGURE 60. AGILENT TECHNOLOGIES, INC.: REVENUE SHARE BY REGION, 2022 (%)
- FIGURE 61. ORACLE CORPORATION: NET REVENUE, 2020-2022 ($MILLION)
- FIGURE 62. ORACLE CORPORATION: REVENUE SHARE BY SEGMENT, 2022 (%)
- FIGURE 63. ORACLE CORPORATION: REVENUE SHARE BY REGION, 2022 (%)
- FIGURE 64. IBM CORPORATION: NET REVENUE, 2020-2022 ($MILLION)
- FIGURE 65. IBM CORPORATION: RESEARCH & DEVELOPMENT EXPENDITURE, 2020-2022 ($MILLION)
- FIGURE 66. IBM CORPORATION: REVENUE SHARE BY SEGMENT, 2022 (%)
- FIGURE 67. IBM CORPORATION: REVENUE SHARE BY REGION, 2022 (%)
- FIGURE 68. ILLUMINA, INC.: NET REVENUE, 2020-2022 ($MILLION)
- FIGURE 69. ILLUMINA, INC.: REVENUE SHARE BY SEGMENT, 2022 (%)
- FIGURE 70. ILLUMINA, INC.: REVENUE SHARE BY REGION, 2022 (%)
 生命科學和化學儀器市場 - 全球行業規模、佔有率、趨勢、機會和預測,按技術、最終用戶、地區、競爭細分,2019-2029F
 南美洲和中美洲智慧生命科學製造市場預測至 2033 年 - 區域分析 - 按組件(解決方案和服務)、技術和應用(製藥、生物製藥和醫療器材)
 亞太地區智慧生命科學製造市場預測至 2033 年 - 區域分析 - 按組件(解決方案和服務)、技術和應用(製藥、生物製藥和醫療器材)
 北美智慧生命科學製造市場預測至 2028 年 - 區域分析 - 按組件(解決方案和服務)、技術、最終用途行業(製藥、生物製藥和醫療器材)
 歐洲智慧生命科學製造市場預測至 2028 年 - 區域分析 - 按組件(解決方案和服務)、技術、應用(製藥、生物製藥和醫療器材)
 2023-2030 年生命科學分析市場中的全球人工智慧 (AI)
 全球生命科學和實驗室設備市場 - 市場規模、佔有率、成長分析:按設備類型、按技術類型、按用途、按最終用戶 - 行業預測 (2023-2030)
 生命科學及化學測量設備的全球市場:2023年
 生命科學產品市場:各產品類型,各用途,各終端用戶,各地區-市場規模,佔有率,展望,機會分析,2023~2030年
 生命科學產品設計與開發服務市場:按階段、最終用戶和用途- 2023-2030 年全球預測