


 |
市場調查報告書
商品編碼
1447160
線性致動器市場:按執行機構、最終用途產業:2023-2032 年全球機會分析與產業預測Linear Actuator Market By Operation Mechanism (Electric, Pneumatic, Hydraulic, Others), By End Use Industry (Automotive, Construction, Energy and Mining, Healthcare, Others): Global Opportunity Analysis and Industry Forecast, 2023-2032 |
||||||
2022年,線性致動器市值為174.392億美元,預計到2032年將達到311.9972億美元,2023年至2032年的複合年成長率為6.05%。
線性致動器是一種設計用於產生直線運動的機械裝置。將電力、液壓、氣壓等能量轉換成直線運動。這種類型的運動對於各種任務至關重要,例如推、拉、舉起和精確定位物體。線性致動器因其對運動和定位的精確控制而廣泛應用於眾多行業,包括工業自動化、車輛製造、機器人和家用電子電器。線性致動器是需要受控線性位移的系統中的關鍵元件。
醫療保健產業的進步是線性致動器市場的重要促進因素,這主要是由於線性致動器在醫療設備和裝置中的使用不斷增加。這些致動器對於在各種醫療應用中提供精確和受控的運動至關重要。例如,在核磁共振造影系統等先進成像設備中,線性致動器用於調整設備和患者的位置以獲得最佳成像。這種準確性對於準確診斷至關重要。同樣,在手術機器人中,致動器可以在手術過程中實現精確的運動,從而提高手術精度和患者治療效果。隨著醫療技術的進步以及醫療保健領域對精度和自動化的需求不斷增加,對可靠、高效的線性致動器的需求不斷增加,推動了該領域的市場成長。
然而,在惡劣環境下的可靠性問題對線性致動器市場產生重大影響。這些致動器對於各種行業的精密運動控制至關重要,並且經常面臨高溫、灰塵、潮濕和腐蝕性元素等極端條件。例如,在採礦業中,致動器暴露在強烈的灰塵和濕氣中,導致頻繁磨損。這需要定期維護和更換,從而增加營運成本和停機時間。在惡劣條件下保持穩定的性能和長壽命的這些挑戰正在限制市場,並隨著行業尋求更耐用和低維護的解決方案而推動市場成長,並產生影響。
此外,環保致動器解決方案的開拓為線性致動器市場帶來了巨大的機遇,特別是在業界越來越重視永續性下。例如,由可回收致動器製成或低功耗設計的致動器可以滿足環境目標。在汽車產業中,這些環保線性致動器可用於電動車充電站,以在不影響性能的情況下實現高效、永續的運作。除了遵守更嚴格的環境法規外,致動器製造商還透過減少產品的環境足跡、開闢創新和市場成長的新途徑來吸引以綠色技術為重點的市場。
線性致動器市場按運行機制、最終用途行業和地區進行細分。根據運行機制,市場分為電動線性致動器、氣動線性致動器、液壓線性致動器等。根據最終用途產業,線性致動器產業分為汽車、建築、能源和採礦、醫療保健等。依地區分類,市場分為北美(美國、加拿大、墨西哥)、歐洲(英國、德國、法國、其他歐洲國家)、亞太地區(中國、日本、印度、韓國、亞太地區其他地區) 、拉丁美洲(Latin America)。、中東和非洲)。
相關人員的主要利益
- 本報告對 2022 年至 2032 年線性致動器市場分析的細分市場、當前趨勢、估計/趨勢分析和動態進行了定量分析,以確定線性致動器市場的強大機會。
- 我們提供市場研究以及與市場促進因素、市場限制和市場機會相關的資訊。
- 波特的五力分析強調買家和供應商幫助相關人員做出利潤驅動的商業決策並加強供應商-買家網路的力量。
- 對線性致動器市場細分的詳細分析有助於識別市場機會。
- 每個地區的主要國家都根據其對全球市場的收益貢獻繪製了地圖。
- 市場參與者定位有助於基準化分析,並提供對市場參與者當前地位的清晰了解。
- 它包括對區域和全球線性致動器市場趨勢、主要企業、細分市場、應用領域和市場成長策略的分析。
可使用此報告進行客製化(需要額外費用和時間表)
- 產品基準/產品規格及應用
- 產品生命週期
- 供應鏈分析與供應商利潤
- 按地區分類的新參與企業
- 按產品/細分市場區隔
- 新產品開發/主要企業產品矩陣
- 根據客戶興趣新增其他公司簡介
- 按國家或地區進行的附加分析 – 市場規模和預測
- 公司簡介的擴充列表
- 歷史市場資料
- 主要參與者的詳細資料(Excel格式,包括位置、聯絡資訊、供應商/供應商網路等)
- 全球/區域/國家層級參與者的市場佔有率分析
目錄
第1章簡介
第 2 章執行摘要
第3章市場概況
- 市場定義和範圍
- 主要發現
- 影響因素
- 主要投資機會
- 波特五力分析
- 市場動態
- 促進因素
- 機器人技術的進步
- 製造自動化的進展
- 裝置小型化
- 抑制因素
- 初期投資成本高
- 機會
- 物聯網 (IoT) 整合
- 促進因素
第4章線性致動器市場:依執行機構分類
- 概述
- 電動
- 氣動
- 油壓
- 其他
第5章線性致動器市場:依最終用途產業
- 概述
- 車
- 建造
- 能源/礦業
- 衛生保健
- 其他
第6章線性致動器市場:依地區
- 概述
- 北美洲
- 美國
- 加拿大
- 墨西哥
- 歐洲
- 英國
- 德國
- 法國
- 其他
- 亞太地區
- 中國
- 日本
- 印度
- 韓國
- 其他
- 拉丁美洲
- 拉丁美洲
- 中東
- 非洲
第7章 競爭形勢
- 介紹
- 關鍵成功策略
- 10家主要企業產品圖譜
- 競爭對手儀表板
- 競爭熱圖
- 2022年主要企業定位
第8章 公司簡介
- Bosch Rexroth AG
- Emerson Electric Co.
- HepcoMotion Ltd.
- Kollmorgen Corporation
- LINAK
- Oriental Motor Co., Ltd.
- Parker Hannifin Corporation
- Rockwell Automation Inc.
- Thomson Industries, Inc.
- Tolomatic, Inc.
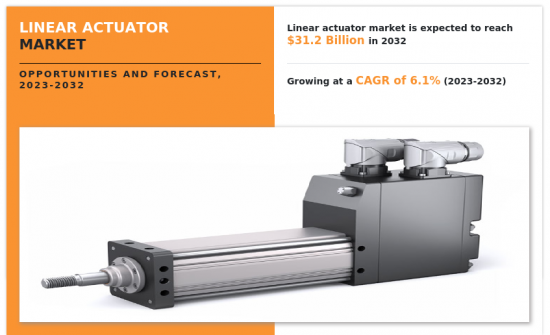
The linear actuator market was valued at $17,439.2 million in 2022, and is projected to reach $31,199.72 million by 2032, registering a CAGR of 6.05% from 2023 to 2032.
A linear actuator is a mechanical device designed to create motion in a straight line. It converts energy, typically electrical, hydraulic, or pneumatic, into linear motion. This type of movement is essential for a variety of tasks, including pushing, pulling, lifting, and accurately positioning items. Linear actuators are extensively utilized across numerous industries such as industrial automation, vehicle manufacturing, robotics, and consumer electronic devices, owing to their precision in controlling motion and placement. They are key components in systems where controlled linear displacement is necessary.
The advancement of the healthcare industry is a significant driver for the linear actuator market, largely due to the rise in use of linear actuators in medical equipment and devices. These actuators are essential for providing precise and controlled movement in various medical applications. For instance, in advanced imaging equipment such as MRI machines, linear actuators are used to adjust the position of the machine or the patient for optimal imaging. This precision is crucial for accurate diagnostics. Similarly, in surgical robotics, actuators allow for meticulous movements during operations, enhancing surgical precision and patient outcomes. The need for reliable and efficient linear actuators grows with the advancement of medical technology and the increase in demand for precision and automation in healthcare, thereby boosting the market growth in this sector.
However, reliability issues in harsh environments significantly impact the linear actuator market. These actuators, crucial for precise motion control in various industries, often face extreme conditions such as high temperatures, dust, moisture, and corrosive elements. For instance, in the mining industry, actuators are exposed to severe dust and moisture, leading to frequent wear and tear. This necessitates regular maintenance and replacements, increasing operational costs and downtime. Such challenges in maintaining consistent performance and longevity under harsh conditions act as a restraint, affecting market growth as industries seek more durable and less maintenance-intensive solutions.
Moreover, developing eco-friendly actuator solutions presents a significant opportunity in the linear actuator market, particularly as industries increasingly prioritize sustainability. For example, actuators made from recyclable materials or designed for low power consumption align with environmental goals. In the automotive industry, such ecofriendly linear actuators can be used in electric vehicle charging stations, offering efficient, sustainable operation without compromising performance. Actuator manufacturers not only adhere to stricter environmental regulations but also appeal to a market that values green technology, by reducing the environmental footprint of their products, thus opening new avenues for innovation and market growth.
The linear actuator market is segmented on the basis of operation mechanism, end use industry, and region. On the basis of operation mechanism, the market is divided into electric linear actuators, pneumatic linear actuators, hydraulic linear actuators, and others. On the basis of end use industry, the linear actuator industry is fragmented into automotive, construction, energy and mining, healthcare, and others. On the basis of region, the market is analyzed across North America (the U.S., Canada, and Mexico), Europe (the UK, Germany, France, and rest of Europe), Asia-Pacific (China, Japan, India, South Korea, and rest of Asia-Pacific) and LAMEA (Latin America, Middle East, and Africa).
The major companies profiled in the report include Bosch Rexroth AG, Emerson Electric Co., HepcoMotion Ltd., Kollmorgen Corporation, LINAK, Oriental Motor Co., Ltd., Parker Hannifin Corporation, Rockwell Automation, Thomson Industries, Inc., Tolomatic, Inc.
Key Benefits For Stakeholders
- This report provides a quantitative analysis of the market segments, current trends, estimations, and dynamics of the linear actuator market analysis from 2022 to 2032 to identify the prevailing linear actuator market opportunities.
- The market research is offered along with information related to key drivers, restraints, and opportunities.
- Porter's five forces analysis highlights the potency of buyers and suppliers to enable stakeholders make profit-oriented business decisions and strengthen their supplier-buyer network.
- In-depth analysis of the linear actuator market segmentation assists to determine the prevailing market opportunities.
- Major countries in each region are mapped according to their revenue contribution to the global market.
- Market player positioning facilitates benchmarking and provides a clear understanding of the present position of the market players.
- The report includes the analysis of the regional as well as global linear actuator market trends, key players, market segments, application areas, and market growth strategies.
Additional benefits you will get with this purchase are:
- Quarterly Update and* (only available with a corporate license, on listed price)
- 5 additional Company Profile of client Choice pre- or Post-purchase, as a free update.
- Free Upcoming Version on the Purchase of Five and Enterprise User License.
- 16 analyst hours of support* (post-purchase, if you find additional data requirements upon review of the report, you may receive support amounting to 16 analyst hours to solve questions, and post-sale queries)
- 15% Free Customization* (in case the scope or segment of the report does not match your requirements, 15% is equivalent to 3 working days of free work, applicable once)
- Free data Pack on the Five and Enterprise User License. (Excel version of the report)
- Free Updated report if the report is 6-12 months old or older.
- 24-hour priority response*
- Free Industry updates and white papers.
Possible Customization with this report (with additional cost and timeline, please talk to the sales executive to know more)
- Product Benchmarking / Product specification and applications
- Product Life Cycles
- Supply Chain Analysis & Vendor Margins
- Upcoming/New Entrant by Regions
- Market share analysis of players by products/segments
- New Product Development/ Product Matrix of Key Players
- Additional company profiles with specific to client's interest
- Additional country or region analysis- market size and forecast
- Expanded list for Company Profiles
- Historic market data
- Key player details (including location, contact details, supplier/vendor network etc. in excel format)
- Market share analysis of players at global/region/country level
Key Market Segments
By Operation Mechanism
- Pneumatic
- Hydraulic
- Others
- Electric
By End Use Industry
- Automotive
- Construction
- Energy and Mining
- Healthcare
- Others
By Region
- North America
- U.S.
- Canada
- Mexico
- Europe
- UK
- Germany
- France
- Rest of Europe
- Asia-Pacific
- China
- Japan
- India
- South Korea
- Rest of Asia-Pacific
- LAMEA
- Latin America
- Middle East
- Africa
Key Market Players:
- Bosch Rexroth AG
- LINAK
- Parker Hannifin Corporation
- Rockwell Automation Inc.
- Oriental Motor Co., Ltd.
- Thomson Industries, Inc.
- HepcoMotion Ltd.
- Kollmorgen Corporation
- Emerson Electric Co.
- Tolomatic, Inc.
TABLE OF CONTENTS
CHAPTER 1: INTRODUCTION
- 1.1. Report description
- 1.2. Key market segments
- 1.3. Key benefits to the stakeholders
- 1.4. Research methodology
- 1.4.1. Primary research
- 1.4.2. Secondary research
- 1.4.3. Analyst tools and models
CHAPTER 2: EXECUTIVE SUMMARY
- 2.1. CXO Perspective
CHAPTER 3: MARKET OVERVIEW
- 3.1. Market definition and scope
- 3.2. Key findings
- 3.2.1. Top impacting factors
- 3.2.2. Top investment pockets
- 3.3. Porter's five forces analysis
- 3.3.1. Moderate to high bargaining power of suppliers
- 3.3.2. Moderate threat of new entrants
- 3.3.3. Low to moderate threat of substitutes
- 3.3.4. High intensity of rivalry
- 3.3.5. Moderate bargaining power of buyers
- 3.4. Market dynamics
- 3.4.1. Drivers
- 3.4.1.1. Advancements in robotics
- 3.4.1.2. Increased automation in manufacturing
- 3.4.1.3. Miniaturization of devices
- 3.4.2. Restraints
- 3.4.2.1. High initial investment cost
- 3.4.3. Opportunities
- 3.4.3.1. Internet of Things (IoT) integration
- 3.4.1. Drivers
CHAPTER 4: LINEAR ACTUATOR MARKET, BY OPERATION MECHANISM
- 4.1. Overview
- 4.1.1. Market size and forecast
- 4.2. Electric
- 4.2.1. Key market trends, growth factors and opportunities
- 4.2.2. Market size and forecast, by region
- 4.2.3. Market share analysis by country
- 4.3. Pneumatic
- 4.3.1. Key market trends, growth factors and opportunities
- 4.3.2. Market size and forecast, by region
- 4.3.3. Market share analysis by country
- 4.4. Hydraulic
- 4.4.1. Key market trends, growth factors and opportunities
- 4.4.2. Market size and forecast, by region
- 4.4.3. Market share analysis by country
- 4.5. Others
- 4.5.1. Key market trends, growth factors and opportunities
- 4.5.2. Market size and forecast, by region
- 4.5.3. Market share analysis by country
CHAPTER 5: LINEAR ACTUATOR MARKET, BY END USE INDUSTRY
- 5.1. Overview
- 5.1.1. Market size and forecast
- 5.2. Automotive
- 5.2.1. Key market trends, growth factors and opportunities
- 5.2.2. Market size and forecast, by region
- 5.2.3. Market share analysis by country
- 5.3. Construction
- 5.3.1. Key market trends, growth factors and opportunities
- 5.3.2. Market size and forecast, by region
- 5.3.3. Market share analysis by country
- 5.4. Energy and Mining
- 5.4.1. Key market trends, growth factors and opportunities
- 5.4.2. Market size and forecast, by region
- 5.4.3. Market share analysis by country
- 5.5. Healthcare
- 5.5.1. Key market trends, growth factors and opportunities
- 5.5.2. Market size and forecast, by region
- 5.5.3. Market share analysis by country
- 5.6. Others
- 5.6.1. Key market trends, growth factors and opportunities
- 5.6.2. Market size and forecast, by region
- 5.6.3. Market share analysis by country
CHAPTER 6: LINEAR ACTUATOR MARKET, BY REGION
- 6.1. Overview
- 6.1.1. Market size and forecast By Region
- 6.2. North America
- 6.2.1. Key market trends, growth factors and opportunities
- 6.2.2. Market size and forecast, by Operation Mechanism
- 6.2.3. Market size and forecast, by End Use Industry
- 6.2.4. Market size and forecast, by country
- 6.2.4.1. U.S.
- 6.2.4.1.1. Market size and forecast, by Operation Mechanism
- 6.2.4.1.2. Market size and forecast, by End Use Industry
- 6.2.4.2. Canada
- 6.2.4.2.1. Market size and forecast, by Operation Mechanism
- 6.2.4.2.2. Market size and forecast, by End Use Industry
- 6.2.4.3. Mexico
- 6.2.4.3.1. Market size and forecast, by Operation Mechanism
- 6.2.4.3.2. Market size and forecast, by End Use Industry
- 6.3. Europe
- 6.3.1. Key market trends, growth factors and opportunities
- 6.3.2. Market size and forecast, by Operation Mechanism
- 6.3.3. Market size and forecast, by End Use Industry
- 6.3.4. Market size and forecast, by country
- 6.3.4.1. UK
- 6.3.4.1.1. Market size and forecast, by Operation Mechanism
- 6.3.4.1.2. Market size and forecast, by End Use Industry
- 6.3.4.2. Germany
- 6.3.4.2.1. Market size and forecast, by Operation Mechanism
- 6.3.4.2.2. Market size and forecast, by End Use Industry
- 6.3.4.3. France
- 6.3.4.3.1. Market size and forecast, by Operation Mechanism
- 6.3.4.3.2. Market size and forecast, by End Use Industry
- 6.3.4.4. Rest of Europe
- 6.3.4.4.1. Market size and forecast, by Operation Mechanism
- 6.3.4.4.2. Market size and forecast, by End Use Industry
- 6.4. Asia-Pacific
- 6.4.1. Key market trends, growth factors and opportunities
- 6.4.2. Market size and forecast, by Operation Mechanism
- 6.4.3. Market size and forecast, by End Use Industry
- 6.4.4. Market size and forecast, by country
- 6.4.4.1. China
- 6.4.4.1.1. Market size and forecast, by Operation Mechanism
- 6.4.4.1.2. Market size and forecast, by End Use Industry
- 6.4.4.2. Japan
- 6.4.4.2.1. Market size and forecast, by Operation Mechanism
- 6.4.4.2.2. Market size and forecast, by End Use Industry
- 6.4.4.3. India
- 6.4.4.3.1. Market size and forecast, by Operation Mechanism
- 6.4.4.3.2. Market size and forecast, by End Use Industry
- 6.4.4.4. South Korea
- 6.4.4.4.1. Market size and forecast, by Operation Mechanism
- 6.4.4.4.2. Market size and forecast, by End Use Industry
- 6.4.4.5. Rest of Asia-Pacific
- 6.4.4.5.1. Market size and forecast, by Operation Mechanism
- 6.4.4.5.2. Market size and forecast, by End Use Industry
- 6.5. LAMEA
- 6.5.1. Key market trends, growth factors and opportunities
- 6.5.2. Market size and forecast, by Operation Mechanism
- 6.5.3. Market size and forecast, by End Use Industry
- 6.5.4. Market size and forecast, by country
- 6.5.4.1. Latin America
- 6.5.4.1.1. Market size and forecast, by Operation Mechanism
- 6.5.4.1.2. Market size and forecast, by End Use Industry
- 6.5.4.2. Middle East
- 6.5.4.2.1. Market size and forecast, by Operation Mechanism
- 6.5.4.2.2. Market size and forecast, by End Use Industry
- 6.5.4.3. Africa
- 6.5.4.3.1. Market size and forecast, by Operation Mechanism
- 6.5.4.3.2. Market size and forecast, by End Use Industry
CHAPTER 7: COMPETITIVE LANDSCAPE
- 7.1. Introduction
- 7.2. Top winning strategies
- 7.3. Product mapping of top 10 player
- 7.4. Competitive dashboard
- 7.5. Competitive heatmap
- 7.6. Top player positioning, 2022
CHAPTER 8: COMPANY PROFILES
- 8.1. Bosch Rexroth AG
- 8.1.1. Company overview
- 8.1.2. Key executives
- 8.1.3. Company snapshot
- 8.1.4. Operating business segments
- 8.1.5. Product portfolio
- 8.1.6. Key strategic moves and developments
- 8.2. Emerson Electric Co.
- 8.2.1. Company overview
- 8.2.2. Key executives
- 8.2.3. Company snapshot
- 8.2.4. Operating business segments
- 8.2.5. Product portfolio
- 8.2.6. Business performance
- 8.2.7. Key strategic moves and developments
- 8.3. HepcoMotion Ltd.
- 8.3.1. Company overview
- 8.3.2. Key executives
- 8.3.3. Company snapshot
- 8.3.4. Operating business segments
- 8.3.5. Product portfolio
- 8.4. Kollmorgen Corporation
- 8.4.1. Company overview
- 8.4.2. Key executives
- 8.4.3. Company snapshot
- 8.4.4. Operating business segments
- 8.4.5. Product portfolio
- 8.5. LINAK
- 8.5.1. Company overview
- 8.5.2. Key executives
- 8.5.3. Company snapshot
- 8.5.4. Operating business segments
- 8.5.5. Product portfolio
- 8.5.6. Key strategic moves and developments
- 8.6. Oriental Motor Co., Ltd.
- 8.6.1. Company overview
- 8.6.2. Key executives
- 8.6.3. Company snapshot
- 8.6.4. Operating business segments
- 8.6.5. Product portfolio
- 8.6.6. Key strategic moves and developments
- 8.7. Parker Hannifin Corporation
- 8.7.1. Company overview
- 8.7.2. Key executives
- 8.7.3. Company snapshot
- 8.7.4. Operating business segments
- 8.7.5. Product portfolio
- 8.7.6. Business performance
- 8.8. Rockwell Automation Inc.
- 8.8.1. Company overview
- 8.8.2. Key executives
- 8.8.3. Company snapshot
- 8.8.4. Operating business segments
- 8.8.5. Product portfolio
- 8.8.6. Business performance
- 8.9. Thomson Industries, Inc.
- 8.9.1. Company overview
- 8.9.2. Key executives
- 8.9.3. Company snapshot
- 8.9.4. Operating business segments
- 8.9.5. Product portfolio
- 8.9.6. Key strategic moves and developments
- 8.10. Tolomatic, Inc.
- 8.10.1. Company overview
- 8.10.2. Key executives
- 8.10.3. Company snapshot
- 8.10.4. Operating business segments
- 8.10.5. Product portfolio
- 8.10.6. Key strategic moves and developments
LIST OF TABLES
- TABLE 01. GLOBAL LINEAR ACTUATOR MARKET, BY OPERATION MECHANISM, 2022-2032 ($MILLION)
- TABLE 02. LINEAR ACTUATOR MARKET FOR ELECTRIC, BY REGION, 2022-2032 ($MILLION)
- TABLE 03. LINEAR ACTUATOR MARKET FOR PNEUMATIC, BY REGION, 2022-2032 ($MILLION)
- TABLE 04. LINEAR ACTUATOR MARKET FOR HYDRAULIC, BY REGION, 2022-2032 ($MILLION)
- TABLE 05. LINEAR ACTUATOR MARKET FOR OTHERS, BY REGION, 2022-2032 ($MILLION)
- TABLE 06. GLOBAL LINEAR ACTUATOR MARKET, BY END USE INDUSTRY, 2022-2032 ($MILLION)
- TABLE 07. LINEAR ACTUATOR MARKET FOR AUTOMOTIVE, BY REGION, 2022-2032 ($MILLION)
- TABLE 08. LINEAR ACTUATOR MARKET FOR CONSTRUCTION, BY REGION, 2022-2032 ($MILLION)
- TABLE 09. LINEAR ACTUATOR MARKET FOR ENERGY AND MINING, BY REGION, 2022-2032 ($MILLION)
- TABLE 10. LINEAR ACTUATOR MARKET FOR HEALTHCARE, BY REGION, 2022-2032 ($MILLION)
- TABLE 11. LINEAR ACTUATOR MARKET FOR OTHERS, BY REGION, 2022-2032 ($MILLION)
- TABLE 12. LINEAR ACTUATOR MARKET, BY REGION, 2022-2032 ($MILLION)
- TABLE 13. NORTH AMERICA LINEAR ACTUATOR MARKET, BY OPERATION MECHANISM, 2022-2032 ($MILLION)
- TABLE 14. NORTH AMERICA LINEAR ACTUATOR MARKET, BY END USE INDUSTRY, 2022-2032 ($MILLION)
- TABLE 15. NORTH AMERICA LINEAR ACTUATOR MARKET, BY COUNTRY, 2022-2032 ($MILLION)
- TABLE 16. U.S. LINEAR ACTUATOR MARKET, BY OPERATION MECHANISM, 2022-2032 ($MILLION)
- TABLE 17. U.S. LINEAR ACTUATOR MARKET, BY END USE INDUSTRY, 2022-2032 ($MILLION)
- TABLE 18. CANADA LINEAR ACTUATOR MARKET, BY OPERATION MECHANISM, 2022-2032 ($MILLION)
- TABLE 19. CANADA LINEAR ACTUATOR MARKET, BY END USE INDUSTRY, 2022-2032 ($MILLION)
- TABLE 20. MEXICO LINEAR ACTUATOR MARKET, BY OPERATION MECHANISM, 2022-2032 ($MILLION)
- TABLE 21. MEXICO LINEAR ACTUATOR MARKET, BY END USE INDUSTRY, 2022-2032 ($MILLION)
- TABLE 22. EUROPE LINEAR ACTUATOR MARKET, BY OPERATION MECHANISM, 2022-2032 ($MILLION)
- TABLE 23. EUROPE LINEAR ACTUATOR MARKET, BY END USE INDUSTRY, 2022-2032 ($MILLION)
- TABLE 24. EUROPE LINEAR ACTUATOR MARKET, BY COUNTRY, 2022-2032 ($MILLION)
- TABLE 25. UK LINEAR ACTUATOR MARKET, BY OPERATION MECHANISM, 2022-2032 ($MILLION)
- TABLE 26. UK LINEAR ACTUATOR MARKET, BY END USE INDUSTRY, 2022-2032 ($MILLION)
- TABLE 27. GERMANY LINEAR ACTUATOR MARKET, BY OPERATION MECHANISM, 2022-2032 ($MILLION)
- TABLE 28. GERMANY LINEAR ACTUATOR MARKET, BY END USE INDUSTRY, 2022-2032 ($MILLION)
- TABLE 29. FRANCE LINEAR ACTUATOR MARKET, BY OPERATION MECHANISM, 2022-2032 ($MILLION)
- TABLE 30. FRANCE LINEAR ACTUATOR MARKET, BY END USE INDUSTRY, 2022-2032 ($MILLION)
- TABLE 31. REST OF EUROPE LINEAR ACTUATOR MARKET, BY OPERATION MECHANISM, 2022-2032 ($MILLION)
- TABLE 32. REST OF EUROPE LINEAR ACTUATOR MARKET, BY END USE INDUSTRY, 2022-2032 ($MILLION)
- TABLE 33. ASIA-PACIFIC LINEAR ACTUATOR MARKET, BY OPERATION MECHANISM, 2022-2032 ($MILLION)
- TABLE 34. ASIA-PACIFIC LINEAR ACTUATOR MARKET, BY END USE INDUSTRY, 2022-2032 ($MILLION)
- TABLE 35. ASIA-PACIFIC LINEAR ACTUATOR MARKET, BY COUNTRY, 2022-2032 ($MILLION)
- TABLE 36. CHINA LINEAR ACTUATOR MARKET, BY OPERATION MECHANISM, 2022-2032 ($MILLION)
- TABLE 37. CHINA LINEAR ACTUATOR MARKET, BY END USE INDUSTRY, 2022-2032 ($MILLION)
- TABLE 38. JAPAN LINEAR ACTUATOR MARKET, BY OPERATION MECHANISM, 2022-2032 ($MILLION)
- TABLE 39. JAPAN LINEAR ACTUATOR MARKET, BY END USE INDUSTRY, 2022-2032 ($MILLION)
- TABLE 40. INDIA LINEAR ACTUATOR MARKET, BY OPERATION MECHANISM, 2022-2032 ($MILLION)
- TABLE 41. INDIA LINEAR ACTUATOR MARKET, BY END USE INDUSTRY, 2022-2032 ($MILLION)
- TABLE 42. SOUTH KOREA LINEAR ACTUATOR MARKET, BY OPERATION MECHANISM, 2022-2032 ($MILLION)
- TABLE 43. SOUTH KOREA LINEAR ACTUATOR MARKET, BY END USE INDUSTRY, 2022-2032 ($MILLION)
- TABLE 44. REST OF ASIA-PACIFIC LINEAR ACTUATOR MARKET, BY OPERATION MECHANISM, 2022-2032 ($MILLION)
- TABLE 45. REST OF ASIA-PACIFIC LINEAR ACTUATOR MARKET, BY END USE INDUSTRY, 2022-2032 ($MILLION)
- TABLE 46. LAMEA LINEAR ACTUATOR MARKET, BY OPERATION MECHANISM, 2022-2032 ($MILLION)
- TABLE 47. LAMEA LINEAR ACTUATOR MARKET, BY END USE INDUSTRY, 2022-2032 ($MILLION)
- TABLE 48. LAMEA LINEAR ACTUATOR MARKET, BY COUNTRY, 2022-2032 ($MILLION)
- TABLE 49. LATIN AMERICA LINEAR ACTUATOR MARKET, BY OPERATION MECHANISM, 2022-2032 ($MILLION)
- TABLE 50. LATIN AMERICA LINEAR ACTUATOR MARKET, BY END USE INDUSTRY, 2022-2032 ($MILLION)
- TABLE 51. MIDDLE EAST LINEAR ACTUATOR MARKET, BY OPERATION MECHANISM, 2022-2032 ($MILLION)
- TABLE 52. MIDDLE EAST LINEAR ACTUATOR MARKET, BY END USE INDUSTRY, 2022-2032 ($MILLION)
- TABLE 53. AFRICA LINEAR ACTUATOR MARKET, BY OPERATION MECHANISM, 2022-2032 ($MILLION)
- TABLE 54. AFRICA LINEAR ACTUATOR MARKET, BY END USE INDUSTRY, 2022-2032 ($MILLION)
- TABLE 55. BOSCH REXROTH AG: KEY EXECUTIVES
- TABLE 56. BOSCH REXROTH AG: COMPANY SNAPSHOT
- TABLE 57. BOSCH REXROTH AG: PRODUCT SEGMENTS
- TABLE 58. BOSCH REXROTH AG: PRODUCT PORTFOLIO
- TABLE 59. BOSCH REXROTH AG: KEY STRATERGIES
- TABLE 60. EMERSON ELECTRIC CO.: KEY EXECUTIVES
- TABLE 61. EMERSON ELECTRIC CO.: COMPANY SNAPSHOT
- TABLE 62. EMERSON ELECTRIC CO.: PRODUCT SEGMENTS
- TABLE 63. EMERSON ELECTRIC CO.: PRODUCT PORTFOLIO
- TABLE 64. EMERSON ELECTRIC CO.: KEY STRATERGIES
- TABLE 65. HEPCOMOTION LTD.: KEY EXECUTIVES
- TABLE 66. HEPCOMOTION LTD.: COMPANY SNAPSHOT
- TABLE 67. HEPCOMOTION LTD.: PRODUCT SEGMENTS
- TABLE 68. HEPCOMOTION LTD.: PRODUCT PORTFOLIO
- TABLE 69. KOLLMORGEN CORPORATION: KEY EXECUTIVES
- TABLE 70. KOLLMORGEN CORPORATION: COMPANY SNAPSHOT
- TABLE 71. KOLLMORGEN CORPORATION: SERVICE SEGMENTS
- TABLE 72. KOLLMORGEN CORPORATION: PRODUCT PORTFOLIO
- TABLE 73. LINAK: KEY EXECUTIVES
- TABLE 74. LINAK: COMPANY SNAPSHOT
- TABLE 75. LINAK: PRODUCT SEGMENTS
- TABLE 76. LINAK: PRODUCT PORTFOLIO
- TABLE 77. LINAK: KEY STRATERGIES
- TABLE 78. ORIENTAL MOTOR CO., LTD.: KEY EXECUTIVES
- TABLE 79. ORIENTAL MOTOR CO., LTD.: COMPANY SNAPSHOT
- TABLE 80. ORIENTAL MOTOR CO., LTD.: PRODUCT SEGMENTS
- TABLE 81. ORIENTAL MOTOR CO., LTD.: PRODUCT PORTFOLIO
- TABLE 82. ORIENTAL MOTOR CO., LTD.: KEY STRATERGIES
- TABLE 83. PARKER HANNIFIN CORPORATION: KEY EXECUTIVES
- TABLE 84. PARKER HANNIFIN CORPORATION: COMPANY SNAPSHOT
- TABLE 85. PARKER HANNIFIN CORPORATION: PRODUCT SEGMENTS
- TABLE 86. PARKER HANNIFIN CORPORATION: PRODUCT PORTFOLIO
- TABLE 87. ROCKWELL AUTOMATION INC.: KEY EXECUTIVES
- TABLE 88. ROCKWELL AUTOMATION INC.: COMPANY SNAPSHOT
- TABLE 89. ROCKWELL AUTOMATION INC.: SERVICE SEGMENTS
- TABLE 90. ROCKWELL AUTOMATION INC.: PRODUCT PORTFOLIO
- TABLE 91. THOMSON INDUSTRIES, INC.: KEY EXECUTIVES
- TABLE 92. THOMSON INDUSTRIES, INC.: COMPANY SNAPSHOT
- TABLE 93. THOMSON INDUSTRIES, INC.: PRODUCT SEGMENTS
- TABLE 94. THOMSON INDUSTRIES, INC.: PRODUCT PORTFOLIO
- TABLE 95. THOMSON INDUSTRIES, INC.: KEY STRATERGIES
- TABLE 96. TOLOMATIC, INC.: KEY EXECUTIVES
- TABLE 97. TOLOMATIC, INC.: COMPANY SNAPSHOT
- TABLE 98. TOLOMATIC, INC.: PRODUCT SEGMENTS
- TABLE 99. TOLOMATIC, INC.: PRODUCT PORTFOLIO
- TABLE 100. TOLOMATIC, INC.: KEY STRATERGIES
LIST OF FIGURES
- FIGURE 01. LINEAR ACTUATOR MARKET, 2022-2032
- FIGURE 02. SEGMENTATION OF LINEAR ACTUATOR MARKET,2022-2032
- FIGURE 03. TOP IMPACTING FACTORS IN LINEAR ACTUATOR MARKET (2022 TO 2032)
- FIGURE 04. TOP INVESTMENT POCKETS IN LINEAR ACTUATOR MARKET (2023-2032)
- FIGURE 05. MODERATE TO HIGH BARGAINING POWER OF SUPPLIERS
- FIGURE 06. MODERATE THREAT OF NEW ENTRANTS
- FIGURE 07. LOW TO MODERATE THREAT OF SUBSTITUTES
- FIGURE 08. HIGH INTENSITY OF RIVALRY
- FIGURE 09. MODERATE BARGAINING POWER OF BUYERS
- FIGURE 10. GLOBAL LINEAR ACTUATOR MARKET:DRIVERS, RESTRAINTS AND OPPORTUNITIES
- FIGURE 11. LINEAR ACTUATOR MARKET, BY OPERATION MECHANISM, 2022 AND 2032(%)
- FIGURE 12. COMPARATIVE SHARE ANALYSIS OF LINEAR ACTUATOR MARKET FOR ELECTRIC, BY COUNTRY 2022 AND 2032(%)
- FIGURE 13. COMPARATIVE SHARE ANALYSIS OF LINEAR ACTUATOR MARKET FOR PNEUMATIC, BY COUNTRY 2022 AND 2032(%)
- FIGURE 14. COMPARATIVE SHARE ANALYSIS OF LINEAR ACTUATOR MARKET FOR HYDRAULIC, BY COUNTRY 2022 AND 2032(%)
- FIGURE 15. COMPARATIVE SHARE ANALYSIS OF LINEAR ACTUATOR MARKET FOR OTHERS, BY COUNTRY 2022 AND 2032(%)
- FIGURE 16. LINEAR ACTUATOR MARKET, BY END USE INDUSTRY, 2022 AND 2032(%)
- FIGURE 17. COMPARATIVE SHARE ANALYSIS OF LINEAR ACTUATOR MARKET FOR AUTOMOTIVE, BY COUNTRY 2022 AND 2032(%)
- FIGURE 18. COMPARATIVE SHARE ANALYSIS OF LINEAR ACTUATOR MARKET FOR CONSTRUCTION, BY COUNTRY 2022 AND 2032(%)
- FIGURE 19. COMPARATIVE SHARE ANALYSIS OF LINEAR ACTUATOR MARKET FOR ENERGY AND MINING, BY COUNTRY 2022 AND 2032(%)
- FIGURE 20. COMPARATIVE SHARE ANALYSIS OF LINEAR ACTUATOR MARKET FOR HEALTHCARE, BY COUNTRY 2022 AND 2032(%)
- FIGURE 21. COMPARATIVE SHARE ANALYSIS OF LINEAR ACTUATOR MARKET FOR OTHERS, BY COUNTRY 2022 AND 2032(%)
- FIGURE 22. LINEAR ACTUATOR MARKET BY REGION, 2022 AND 2032(%)
- FIGURE 23. U.S. LINEAR ACTUATOR MARKET, 2022-2032 ($MILLION)
- FIGURE 24. CANADA LINEAR ACTUATOR MARKET, 2022-2032 ($MILLION)
- FIGURE 25. MEXICO LINEAR ACTUATOR MARKET, 2022-2032 ($MILLION)
- FIGURE 26. UK LINEAR ACTUATOR MARKET, 2022-2032 ($MILLION)
- FIGURE 27. GERMANY LINEAR ACTUATOR MARKET, 2022-2032 ($MILLION)
- FIGURE 28. FRANCE LINEAR ACTUATOR MARKET, 2022-2032 ($MILLION)
- FIGURE 29. REST OF EUROPE LINEAR ACTUATOR MARKET, 2022-2032 ($MILLION)
- FIGURE 30. CHINA LINEAR ACTUATOR MARKET, 2022-2032 ($MILLION)
- FIGURE 31. JAPAN LINEAR ACTUATOR MARKET, 2022-2032 ($MILLION)
- FIGURE 32. INDIA LINEAR ACTUATOR MARKET, 2022-2032 ($MILLION)
- FIGURE 33. SOUTH KOREA LINEAR ACTUATOR MARKET, 2022-2032 ($MILLION)
- FIGURE 34. REST OF ASIA-PACIFIC LINEAR ACTUATOR MARKET, 2022-2032 ($MILLION)
- FIGURE 35. LATIN AMERICA LINEAR ACTUATOR MARKET, 2022-2032 ($MILLION)
- FIGURE 36. MIDDLE EAST LINEAR ACTUATOR MARKET, 2022-2032 ($MILLION)
- FIGURE 37. AFRICA LINEAR ACTUATOR MARKET, 2022-2032 ($MILLION)
- FIGURE 38. TOP WINNING STRATEGIES, BY YEAR (2020-2023)
- FIGURE 39. TOP WINNING STRATEGIES, BY DEVELOPMENT (2020-2023)
- FIGURE 40. TOP WINNING STRATEGIES, BY COMPANY (2020-2023)
- FIGURE 41. PRODUCT MAPPING OF TOP 10 PLAYERS
- FIGURE 42. COMPETITIVE DASHBOARD
- FIGURE 43. COMPETITIVE HEATMAP: LINEAR ACTUATOR MARKET
- FIGURE 44. TOP PLAYER POSITIONING, 2022
- FIGURE 45. EMERSON ELECTRIC CO.: NET SALES, 2021-2023 ($MILLION)
- FIGURE 46. EMERSON ELECTRIC CO.: REVENUE SHARE BY REGION, 2023 (%)
- FIGURE 47. PARKER-HANNIFIN CORPORATION: NET SALES, 2021-2023 ($MILLION)
- FIGURE 48. PARKER-HANNIFIN CORPORATION: RESEARCH & DEVELOPMENT EXPENDITURE, 2021-2023 ($MILLION)
- FIGURE 49. PARKER-HANNIFIN CORPORATION: REVENUE SHARE BY SEGMENT, 2023 (%)
- FIGURE 50. PARKER-HANNIFIN CORPORATION: REVENUE SHARE BY REGION, 2023 (%)
- FIGURE 51. ROCKWELL AUTOMATION INC.: NET SALES, 2020-2022 ($MILLION)
- FIGURE 52. ROCKWELL AUTOMATION INC.: REVENUE SHARE BY SEGMENT, 2022 (%)
- FIGURE 53. ROCKWELL AUTOMATION INC.: REVENUE SHARE BY REGION, 2022 (%)


