


 |
市場調查報告書
商品編碼
1446903
聚脲塗料市場:依原料類型、聚脲類型、技術、最終用途產業:2023-2032年全球市場機會分析與產業預測Polyurea Coatings Market By Raw Material Type, By Polyurea Type, By Technology, By End Use Industry : Global Opportunity Analysis and Industry Forecast, 2023-2032 |
||||||
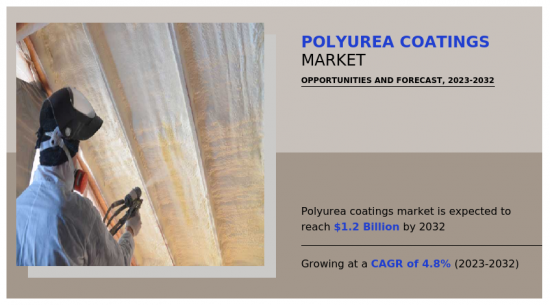
2022年,全球聚脲塗料市場價值為7億美元,預計2023年至2032年複合年成長率為4.8%,到2032年將達到12億美元。
聚脲塗料是一種由胺和異氰酸酯混合而成的防護塗料。這種化學製程可生產出柔韌、持久的合成橡膠塗層,可用於多種應用。這些塗料具有獨特的性能,例如高拉伸強度、彈性、耐化學性和耐環境條件、快速固化時間和優異的耐磨性。這些塗料廣泛用於防水、防腐、工業地板材料以及建築、交通、石油和天然氣以及汽車應用等多種行業的其他防護塗料需求。
全球聚脲塗料市場的成長主要是由汽車、運輸、石油和天然氣以及船舶等各種最終用途行業對聚脲塗料的需求不斷成長所推動的。這些塗料在汽車工業中用於增強外觀、防腐和床襯。聚脲堅韌且耐腐蝕,是保護卡車底板、車底和底盤零件免受磨料、化學物質和路鹽侵害的理想材料。在汽車製造過程中,聚脲塗料的快速固化特性有助於高效生產和快速週轉時間。
聚脲塗料在石油和天然氣行業中至關重要,因為設備和基礎設施暴露在惡劣的環境中,以防止腐蝕並防止化學物質暴露。由於管道、儲存槽和海上結構暴露在惡劣的條件和腐蝕性化合物中,聚脲塗料的耐用性正在推動需求。此外,聚脲的彈性和伸長特性使其能夠適應石油和天然氣設施中存在的結構運動,從而使塗層能夠隨著時間的推移保持其完整性。
此外,聚脲塗料能夠耐受該行業中經常遇到的化學物質,例如碳氫化合物和腐蝕劑,使其成為維持關鍵資產的耐用性和安全性的可靠選擇。
聚脲塗料用於船舶工業,以保護船舶免受磨損、紫外線輻射和海水的影響。它提供了針對這些元素的強大屏障。塗層的防水特性有助於防止船舶表面劣化和腐蝕。此外,它還用於飛機工業,透過提供耐腐蝕、耐燃料暴露和耐環境因素來保護飛機外部和零件。聚脲塗層的輕質特性在飛機應用中具有優勢,在飛機應用中,減少多餘的重量對於提高燃油效率至關重要。因此,聚脲塗料在各行業的使用正在迅速增加,市場預計將會成長。
然而,聚脲塗料的市場擴張受到原料成本波動的限制,這對生產者和消費者都有影響。聚脲塗料的主要成分是從石油化學原料中獲得的胺類和異氰酸酯類。這些原料的成本受到多種外部因素的影響,包括全球石化需求的變化、供應鏈中斷和地緣政治發展。這些不確定性加劇了原料成本的波動,使生產商更難預測生產成本,也讓最終用戶更難為使用聚脲塗料的計劃製定預算。
原油和天然氣衍生物是重要的石化原料,因為它們用於生產異氰酸酯,而異氰酸酯對於聚脲配方至關重要。原油價格波動、國際衝突以及石油和汽油供應鏈的中斷可能導致這些重要原料的價格快速且不可預測地波動。市場的劇烈波動為生產者維持成本穩定帶來了挑戰,並影響了他們向客戶提供固定價格的能力。
此外,異氰酸酯和胺合成中涉及的複雜化學反應和製造過程增加了聚脲塗料製造過程的整體複雜性。由於其複雜性,製造鏈很容易受到中斷和不可預見事件的影響,例如事故、自然災害和地緣政治緊張局勢。
聚脲塗料廣泛應用於石油天然氣、汽車、建築等產業,是世界各地的理想產品。原物料價格的波動會對每個產業產生不同的影響。例如,在建設產業,聚脲塗料用於防水和防護,原料價格的意外上漲不僅會影響計劃預算,還會導致施工延誤。同樣,在汽車行業中,聚脲塗料用於防銹和增強美觀,成本波動可能會影響製造商的總製造成本並影響最終產品的價格。因此,原料價格的波動抑制了聚脲塗料市場的成長。
聚脲塗料因其低揮發性有機化合物 (VOC) 成分、快速固化、彈性和適應性而被認為是永續塗料。傳統塗料往往含有高濃度的VOC,對人體有害,造成空氣污染。同時,低VOC聚脲配方可減少塗布和固化過程中釋放的有毒化合物的量,滿足嚴格的環境標準並改善室內外空氣品質。
此外,聚脲塗料永續性的關鍵因素是其固化時間短。使用快速乾燥的油漆可以減少釋放到大氣中的污染物量。這樣做可以提高整體塗料塗布效率,並減少使用能源密集建築和設備對環境的影響。因此,聚脲塗料代表了一種更環保的選擇,特別是在及時性和資源效率是重要因素的計劃中。
此外,聚脲的使用壽命長且富有彈性,需要較少的維護、修復和重新噴漆,使其更加環保。由於聚脲塗層表面的使用壽命較長,隨著時間的推移,使用的材料資源會減少。這種長使用壽命的特性對於基礎設施計劃尤其有利,在這些項目中,塗層對於保護表面免受磨損、腐蝕和環境退化至關重要。這些塗料透過最大限度地減少重塗或更換的需要,減少了整體環境影響並節省了資源。
此外,在聚脲塗料領域,將生物基和永續原料納入配方中是持續研究和開發的主要重點。製造商致力於透過探索替代原料和減少對石化產品成分的依賴來進一步改善聚脲塗料的環境狀況。這種對創新的承諾與開發既環保又高效的被覆劑的更大行業趨勢一致。因此,環保產品的激增為聚脲塗料市場的擴大創造了潛在的機會。
聚脲塗料市場按原料類型、聚脲類型、技術、最終用途產業和地區細分。根據原料類型,市場分為脂肪族異氰酸酯和芳香族異氰酸酯。依聚脲類型的不同,分為純聚脲塗料和混合聚脲塗料。從技術面來看,市場分為噴塗、注射和手動混合。依最終用途行業分為建築、交通、工業和其他。按地區分類,我們研究了北美、歐洲、亞太地區和拉丁美洲地區 (LAMEA) 的市場。
相關人員的主要利益
- 本報告定量分析了 2022 年至 2032 年聚脲塗料市場的細分市場、當前趨勢、估計和動態,並確定了聚脲塗料市場的強大機會。
- 我們提供市場研究以及與市場促進因素、市場限制和市場機會相關的資訊。
- 波特的五力分析揭示了買家和供應商的潛力,幫助相關人員做出利潤驅動的業務決策並加強供應商和買家網路。
- 對聚脲塗料市場區隔的詳細分析有助於識別市場機會。
- 我們根據每個地區的主要國家對全球市場的收益貢獻繪製了地圖。
- 市場參與者定位有助於基準化分析,並提供對市場參與者當前地位的清晰了解。
- 該報告包括對區域和全球聚脲塗料市場趨勢、主要企業、細分市場、應用領域和市場成長策略的分析。
可以使用此報告進行客製化
- 製造能力
- 產品基準/產品規格及應用
- 產品生命週期
- 情境分析及成長趨勢比較
- 按地區分類的新參與企業
- 科技趨勢分析
- 新品開發/各大廠商產品矩陣
- 監管指引
- 針對客戶興趣的其他公司簡介
- 公司簡介的擴充列表
- 主要參與者的詳細資料(Excel格式,包括位置、聯絡資訊、供應商/供應商網路等)
- 全球/區域/國家層級參與者的市場佔有率分析
- SWOT分析
- 市場規模及預測
目錄
第1章簡介
第 2 章執行摘要
第3章市場概況
- 市場定義和範圍
- 主要發現
- 影響因素
- 主要投資機會
- 波特五力分析
- 市場動態
- 促進因素
- 抑制因素
- 機會
- 價值鏈分析
- 價格分析
- 關鍵監管分析
- 專利情況
- 監管指引
第4章聚脲塗料市場:依原料類型
- 概述
- 脂肪族異氰酸酯
- 芳香族異氰酸酯
第5章聚脲塗料市場:按聚脲類型
- 概述
- 純聚脲塗料
- 混合聚脲塗料
第6章聚脲塗料市場:依技術分類
- 概述
- 噴
- 注射
- 手動攪拌
第7章聚脲塗料市場:按最終用戶產業
- 概述
- 建築/施工
- 運輸
- 工業
- 其他
第8章聚脲塗料市場:按地區
- 概述
- 北美洲
- 美國
- 加拿大
- 墨西哥
- 歐洲
- 德國
- 英國
- 法國
- 西班牙
- 義大利
- 其他
- 亞太地區
- 中國
- 印度
- 日本
- 韓國
- 澳洲
- 其他
- 拉丁美洲/中東/非洲
- 巴西
- 沙烏地阿拉伯
- 南非
- 其他
第9章 競爭格局
- 介紹
- 關鍵成功策略
- 10家主要企業產品圖譜
- 競爭對手儀表板
- 競爭熱圖
- 2022年主要企業定位
第10章 公司簡介
- BASF SE
- Huntsman International LLC
- Pearl Polyurethane
- Polycoat Products Inc.
- PPG Industries, Inc.
- Sika AG
- SPI Performance Coatings
- SWD urethane Co., Ltd.
- Teknos Group
- The Sherwin-Williams Company
The global polyurea coatings market was valued at $0.7 billion in 2022, and is projected to reach $1.2 billion by 2032, growing at a CAGR of 4.8% from 2023 to 2032.
Polyurea coatings are a class of protective coating materials produced when amines and isocyanates are combined. This chemical process produces a flexible and long-lasting elastomeric coating with various uses. These coatings have distinct properties such as high tensile strength, flexibility, resilience to chemicals and environmental conditions, fast cure times, and great abrasion resistance. These coatings are widely used in various industries, including construction, transportation, oil & gas, and automotive applications, for waterproofing, corrosion protection, industrial flooring, and other protective coating needs.
The growth of the global polyurea coatings market is majorly driven by increase in demand for polyurea coatings across various end-use industries such as automotive, transportation, oil & gas, and marine. These coatings are employed in the automotive industry for visual enhancements, corrosion prevention, and bed lining. Polyurea is an ideal material to protect truck beds, underbodies, and chassis parts from abrasive materials, chemicals, and road salts as it is strong and resistant to corrosion. The automotive manufacturing process benefits from the fast-curing time of polyurea coatings, which facilitates efficient production and expedient turnaround times.
Polyurea coatings are essential to prevent corrosion and provide protection against chemical exposure in the oil and gas industry, where equipment and infrastructure are exposed to harsh environments. The durability of polyurea coatings is boosts their demand, as pipelines, storage tanks, and offshore constructions are exposed to severe conditions and corrosive compounds. Moreover, the ability of polyurea's flexibility and elongation properties to adapt to the structural movements present in oil & gas facilities ensures that coatings will retain their integrity over time.
Furthermore, polyurea coatings are a dependable option to maintain the durability and security of important assets due to their resistance to chemicals that are frequently encountered in the industry, such as hydrocarbons and corrosive agents.
Polyurea coatings are employed in the marine industry to protect marine vessels from abrasion, UV rays, and saltwater. They offer a strong barrier against these elements. The waterproofing properties of the coatings are helpful to prevent surface degradation and corrosion on ships. In addition, these coatings are used in the aviation industry to preserve the exteriors and components of aircraft by providing resistance against corrosion, fuel exposure, and environmental elements. Polyurea coatings' small weight may be beneficial in aviation applications, where reducing excess weight is essential for fuel economy. Thus, surge in use of polyurea coatings in various industries is expected to foster the market growth.
However, the market expansion for polyurea coatings is restricted by the fluctuating cost of raw materials, which affects both producers and consumers. Polyurea coatings consist of essential constituents, such as amines and isocyanates, obtained from petrochemical feedstocks. These raw materials' costs are influenced by several external factors, including shifts in the demand for petrochemicals globally, disruptions in the supply chain, and geopolitical developments. The fluctuation in raw material costs is worsened by these uncertainties, making it difficult for producers to predict production costs and for end users to budget for projects that utilize polyurea coatings.
Crude oil and natural gas derivatives are important petrochemical feedstocks as they are used to produce isocyanates, which are an essential part of polyurea formulations. The price of these essential raw materials might vary rapidly and unpredictably due to fluctuations in oil prices, international conflicts, or interruptions in the supply chain for petrol and oil. The level of volatility in the market presents producers with difficulties to maintain cost stability, which affects their capacity to provide clients with fixed prices.
Furthermore, the complicated chemical reactions and manufacturing processes involved in the synthesis of isocyanates and amines contribute to the overall complexity of the polyurea coating production process. The manufacturing chain is susceptible to disruptions due to its complexity, which may include unexpected events like accidents, natural disasters, or geopolitical tensions.
Polyurea coatings have a wide range of uses in oil & gas, automotive, construction, and other industries, which makes them ideal across the globe. The variations in the price of raw materials may have varying effects on each of these industries. In the construction industry, for instance, where polyurea coatings are used for waterproofing and protection, unexpected increases in the cost of raw materials might influence project budgets as well as cause construction schedule delays. Similarly, in the automotive industry, where polyurea coatings are applied to protect against corrosion and to improve aesthetics, variations in cost may affect manufacturers' total manufacturing costs, which can then have an impact on final product prices. Thus, fluctuations in the raw material prices restrain the growth of the polyurea coating market.
Polyurea coatings are considered sustainable due to their low volatile organic compound (VOC) compositions, quick cure times, resilience, and adaptability. High concentrations of VOCs are frequently found in traditional coatings, which may damage human health and contribute to air pollution. Low-VOC polyurea formulations, on the other hand, reduce the amount of toxic compounds released during application and curing, complying with strict environmental standards, and enhancing both indoor and outdoor air quality.
Moreover, a key factor in polyurea coatings' sustainability is their quick cure time. When coatings with shorter drying times are used, the amount of pollutants released into the atmosphere is reduced. By doing this, coating application efficiency is increased overall, and the environmental impact of using energy-intensive buildings and equipment is reduced. Hence, polyurea coatings are a more environmentally friendly choice, particularly for projects where timeliness and resource efficiency are crucial factors.
Furthermore, polyurea coatings are ecological as they require less frequent maintenance, repairs, and recoating due to their lifetime and resilience. Over time, fewer material resources are used since polyurea-coated surfaces have an extended service life. In infrastructure projects, where coatings are essential for shielding surfaces from wear, corrosion, and environmental deterioration, this longevity feature is especially beneficial. These coatings reduce overall environmental impact and conserve resources by minimizing the need for recoating and replacement.
Moreover, integrating biobased and sustainable raw materials into formulations is a major focus of continuing research and development in the polyurea coatings sector. Manufacturers focus on improving the environmental profile of polyurea coatings even more by exploring substitute feedstocks and lowering dependency on components generated from petrochemicals. This commitment to innovation is consistent with the larger industry trend toward the development of coatings that are both environmentally friendly and highly effective. Thus, surge in environmentally friendly products presents potential opportunity for the expansion of the polyurea coating market.
The polyurea coating market is segmented on the basis of raw material type, polyurea type, technology, end-use industry, and region. On the basis of raw material type, the market is bifurcated into aliphatic isocyanate and aromatic isocyanate. Depending on polyurea type, it is classified into pure polyurea coatings and hybrid polyurea coatings. On the basis of technology, the market is divided into spraying, pouring, and hand mixing. By end-use industry, it is categorized into building and construction, transportation, industrial, and others. Region wise, the market is studied across North America, Europe, Asia-Pacific, and LAMEA.
The major players operating in the global polyurea coating market are BASF SE, Huntsman International LLC, Pearl Polyurethane, Polycoat Products, PPG Industries, Inc., Sika AG, SPI Performance Coatings, SWD urethane Co., Ltd., Teknos Group, and The Sherwin-Williams Company.
Other players include ArmorThane, ISOMAT, MARVEL COATINGS, Nukote Coating Systems, Rhino Linings Corporation, Rust-Oleum, Specialty Products Inc., Taiwan PU Corporation, The Euclid Chemical Company, and VIP Coatings Intl GmbH & Co.KG.
Key Benefits For Stakeholders
- This report provides a quantitative analysis of the market segments, current trends, estimations, and dynamics of the polyurea coatings market analysis from 2022 to 2032 to identify the prevailing polyurea coatings market opportunities.
- The market research is offered along with information related to key drivers, restraints, and opportunities.
- Porter's five forces analysis highlights the potency of buyers and suppliers to enable stakeholders make profit-oriented business decisions and strengthen their supplier-buyer network.
- In-depth analysis of the polyurea coatings market segmentation assists to determine the prevailing market opportunities.
- Major countries in each region are mapped according to their revenue contribution to the global market.
- Market player positioning facilitates benchmarking and provides a clear understanding of the present position of the market players.
- The report includes the analysis of the regional as well as global polyurea coatings market trends, key players, market segments, application areas, and market growth strategies.
Additional benefits you will get with this purchase are:
- Quarterly Update and* (only available with a corporate license, on listed price)
- 5 additional Company Profile of client Choice pre- or Post-purchase, as a free update.
- Free Upcoming Version on the Purchase of Five and Enterprise User License.
- 16 analyst hours of support* (post-purchase, if you find additional data requirements upon review of the report, you may receive support amounting to 16 analyst hours to solve questions, and post-sale queries)
- 15% Free Customization* (in case the scope or segment of the report does not match your requirements, 15% is equivalent to 3 working days of free work, applicable once)
- Free data Pack on the Five and Enterprise User License. (Excel version of the report)
- Free Updated report if the report is 6-12 months old or older.
- 24-hour priority response*
- Free Industry updates and white papers.
Possible Customization with this report (with additional cost and timeline, please talk to the sales executive to know more)
- Manufacturing Capacity
- Product Benchmarking / Product specification and applications
- Product Life Cycles
- Senario Analysis & Growth Trend Comparision
- Upcoming/New Entrant by Regions
- Technology Trend Analysis
- New Product Development/ Product Matrix of Key Players
- Regulatory Guidelines
- Additional company profiles with specific to client's interest
- Expanded list for Company Profiles
- Key player details (including location, contact details, supplier/vendor network etc. in excel format)
- Market share analysis of players at global/region/country level
- SWOT Analysis
- Volume Market Size and Forecast
Key Market Segments
By Raw Material Type
- Aliphatic Isocyanate
- Aromatic Isocyanate
By Polyurea Type
- Pure Polyurea Coatings
- Hybrid Polyurea Coatings
By Technology
- Spraying
- Pouring
- Hand Mixing
By End Use Industry
- Building and construction
- Transportation
- Industrial
- Others
By Region
- North America
- U.S.
- Canada
- Mexico
- Europe
- Germany
- UK
- France
- Spain
- Italy
- Rest of Europe
- Asia-Pacific
- China
- India
- Japan
- South Korea
- Australia
- Rest of Asia-Pacific
- LAMEA
- Brazil
- Saudi Arabia
- South Africa
- Rest of LAMEA
Key Market Players:
- BASF SE
- Huntsman International LLC
- Pearl Polyurethane
- Polycoat Products Inc.
- PPG Industries, Inc.
- Sika AG
- SPI Performance Coatings
- SWD urethane Co., Ltd.
- Teknos Group
- The Sherwin-Williams Company
TABLE OF CONTENTS
CHAPTER 1: INTRODUCTION
- 1.1. Report description
- 1.2. Key market segments
- 1.3. Key benefits to the stakeholders
- 1.4. Research methodology
- 1.4.1. Primary research
- 1.4.2. Secondary research
- 1.4.3. Analyst tools and models
CHAPTER 2: EXECUTIVE SUMMARY
- 2.1. CXO Perspective
CHAPTER 3: MARKET OVERVIEW
- 3.1. Market definition and scope
- 3.2. Key findings
- 3.2.1. Top impacting factors
- 3.2.2. Top investment pockets
- 3.3. Porter's five forces analysis
- 3.4. Market dynamics
- 3.4.1. Drivers
- 3.4.2. Restraints
- 3.4.3. Opportunities
- 3.5. Value Chain Analysis
- 3.6. Pricing Analysis
- 3.7. Key Regulation Analysis
- 3.8. Patent Landscape
- 3.9. Regulatory Guidelines
CHAPTER 4: POLYUREA COATINGS MARKET, BY RAW MATERIAL TYPE
- 4.1. Overview
- 4.1.1. Market size and forecast
- 4.2. Aliphatic Isocyanate
- 4.2.1. Key market trends, growth factors and opportunities
- 4.2.2. Market size and forecast, by region
- 4.2.3. Market share analysis by country
- 4.3. Aromatic Isocyanate
- 4.3.1. Key market trends, growth factors and opportunities
- 4.3.2. Market size and forecast, by region
- 4.3.3. Market share analysis by country
CHAPTER 5: POLYUREA COATINGS MARKET, BY POLYUREA TYPE
- 5.1. Overview
- 5.1.1. Market size and forecast
- 5.2. Pure Polyurea Coatings
- 5.2.1. Key market trends, growth factors and opportunities
- 5.2.2. Market size and forecast, by region
- 5.2.3. Market share analysis by country
- 5.3. Hybrid Polyurea Coatings
- 5.3.1. Key market trends, growth factors and opportunities
- 5.3.2. Market size and forecast, by region
- 5.3.3. Market share analysis by country
CHAPTER 6: POLYUREA COATINGS MARKET, BY TECHNOLOGY
- 6.1. Overview
- 6.1.1. Market size and forecast
- 6.2. Spraying
- 6.2.1. Key market trends, growth factors and opportunities
- 6.2.2. Market size and forecast, by region
- 6.2.3. Market share analysis by country
- 6.3. Pouring
- 6.3.1. Key market trends, growth factors and opportunities
- 6.3.2. Market size and forecast, by region
- 6.3.3. Market share analysis by country
- 6.4. Hand Mixing
- 6.4.1. Key market trends, growth factors and opportunities
- 6.4.2. Market size and forecast, by region
- 6.4.3. Market share analysis by country
CHAPTER 7: POLYUREA COATINGS MARKET, BY END USE INDUSTRY
- 7.1. Overview
- 7.1.1. Market size and forecast
- 7.2. Building and construction
- 7.2.1. Key market trends, growth factors and opportunities
- 7.2.2. Market size and forecast, by region
- 7.2.3. Market share analysis by country
- 7.3. Transportation
- 7.3.1. Key market trends, growth factors and opportunities
- 7.3.2. Market size and forecast, by region
- 7.3.3. Market share analysis by country
- 7.4. Industrial
- 7.4.1. Key market trends, growth factors and opportunities
- 7.4.2. Market size and forecast, by region
- 7.4.3. Market share analysis by country
- 7.5. Others
- 7.5.1. Key market trends, growth factors and opportunities
- 7.5.2. Market size and forecast, by region
- 7.5.3. Market share analysis by country
CHAPTER 8: POLYUREA COATINGS MARKET, BY REGION
- 8.1. Overview
- 8.1.1. Market size and forecast By Region
- 8.2. North America
- 8.2.1. Key market trends, growth factors and opportunities
- 8.2.2. Market size and forecast, by Raw Material Type
- 8.2.3. Market size and forecast, by Polyurea Type
- 8.2.4. Market size and forecast, by Technology
- 8.2.5. Market size and forecast, by End Use Industry
- 8.2.6. Market size and forecast, by country
- 8.2.6.1. U.S.
- 8.2.6.1.1. Market size and forecast, by Raw Material Type
- 8.2.6.1.2. Market size and forecast, by Polyurea Type
- 8.2.6.1.3. Market size and forecast, by Technology
- 8.2.6.1.4. Market size and forecast, by End Use Industry
- 8.2.6.2. Canada
- 8.2.6.2.1. Market size and forecast, by Raw Material Type
- 8.2.6.2.2. Market size and forecast, by Polyurea Type
- 8.2.6.2.3. Market size and forecast, by Technology
- 8.2.6.2.4. Market size and forecast, by End Use Industry
- 8.2.6.3. Mexico
- 8.2.6.3.1. Market size and forecast, by Raw Material Type
- 8.2.6.3.2. Market size and forecast, by Polyurea Type
- 8.2.6.3.3. Market size and forecast, by Technology
- 8.2.6.3.4. Market size and forecast, by End Use Industry
- 8.3. Europe
- 8.3.1. Key market trends, growth factors and opportunities
- 8.3.2. Market size and forecast, by Raw Material Type
- 8.3.3. Market size and forecast, by Polyurea Type
- 8.3.4. Market size and forecast, by Technology
- 8.3.5. Market size and forecast, by End Use Industry
- 8.3.6. Market size and forecast, by country
- 8.3.6.1. Germany
- 8.3.6.1.1. Market size and forecast, by Raw Material Type
- 8.3.6.1.2. Market size and forecast, by Polyurea Type
- 8.3.6.1.3. Market size and forecast, by Technology
- 8.3.6.1.4. Market size and forecast, by End Use Industry
- 8.3.6.2. UK
- 8.3.6.2.1. Market size and forecast, by Raw Material Type
- 8.3.6.2.2. Market size and forecast, by Polyurea Type
- 8.3.6.2.3. Market size and forecast, by Technology
- 8.3.6.2.4. Market size and forecast, by End Use Industry
- 8.3.6.3. France
- 8.3.6.3.1. Market size and forecast, by Raw Material Type
- 8.3.6.3.2. Market size and forecast, by Polyurea Type
- 8.3.6.3.3. Market size and forecast, by Technology
- 8.3.6.3.4. Market size and forecast, by End Use Industry
- 8.3.6.4. Spain
- 8.3.6.4.1. Market size and forecast, by Raw Material Type
- 8.3.6.4.2. Market size and forecast, by Polyurea Type
- 8.3.6.4.3. Market size and forecast, by Technology
- 8.3.6.4.4. Market size and forecast, by End Use Industry
- 8.3.6.5. Italy
- 8.3.6.5.1. Market size and forecast, by Raw Material Type
- 8.3.6.5.2. Market size and forecast, by Polyurea Type
- 8.3.6.5.3. Market size and forecast, by Technology
- 8.3.6.5.4. Market size and forecast, by End Use Industry
- 8.3.6.6. Rest of Europe
- 8.3.6.6.1. Market size and forecast, by Raw Material Type
- 8.3.6.6.2. Market size and forecast, by Polyurea Type
- 8.3.6.6.3. Market size and forecast, by Technology
- 8.3.6.6.4. Market size and forecast, by End Use Industry
- 8.4. Asia-Pacific
- 8.4.1. Key market trends, growth factors and opportunities
- 8.4.2. Market size and forecast, by Raw Material Type
- 8.4.3. Market size and forecast, by Polyurea Type
- 8.4.4. Market size and forecast, by Technology
- 8.4.5. Market size and forecast, by End Use Industry
- 8.4.6. Market size and forecast, by country
- 8.4.6.1. China
- 8.4.6.1.1. Market size and forecast, by Raw Material Type
- 8.4.6.1.2. Market size and forecast, by Polyurea Type
- 8.4.6.1.3. Market size and forecast, by Technology
- 8.4.6.1.4. Market size and forecast, by End Use Industry
- 8.4.6.2. India
- 8.4.6.2.1. Market size and forecast, by Raw Material Type
- 8.4.6.2.2. Market size and forecast, by Polyurea Type
- 8.4.6.2.3. Market size and forecast, by Technology
- 8.4.6.2.4. Market size and forecast, by End Use Industry
- 8.4.6.3. Japan
- 8.4.6.3.1. Market size and forecast, by Raw Material Type
- 8.4.6.3.2. Market size and forecast, by Polyurea Type
- 8.4.6.3.3. Market size and forecast, by Technology
- 8.4.6.3.4. Market size and forecast, by End Use Industry
- 8.4.6.4. South Korea
- 8.4.6.4.1. Market size and forecast, by Raw Material Type
- 8.4.6.4.2. Market size and forecast, by Polyurea Type
- 8.4.6.4.3. Market size and forecast, by Technology
- 8.4.6.4.4. Market size and forecast, by End Use Industry
- 8.4.6.5. Australia
- 8.4.6.5.1. Market size and forecast, by Raw Material Type
- 8.4.6.5.2. Market size and forecast, by Polyurea Type
- 8.4.6.5.3. Market size and forecast, by Technology
- 8.4.6.5.4. Market size and forecast, by End Use Industry
- 8.4.6.6. Rest of Asia-Pacific
- 8.4.6.6.1. Market size and forecast, by Raw Material Type
- 8.4.6.6.2. Market size and forecast, by Polyurea Type
- 8.4.6.6.3. Market size and forecast, by Technology
- 8.4.6.6.4. Market size and forecast, by End Use Industry
- 8.5. LAMEA
- 8.5.1. Key market trends, growth factors and opportunities
- 8.5.2. Market size and forecast, by Raw Material Type
- 8.5.3. Market size and forecast, by Polyurea Type
- 8.5.4. Market size and forecast, by Technology
- 8.5.5. Market size and forecast, by End Use Industry
- 8.5.6. Market size and forecast, by country
- 8.5.6.1. Brazil
- 8.5.6.1.1. Market size and forecast, by Raw Material Type
- 8.5.6.1.2. Market size and forecast, by Polyurea Type
- 8.5.6.1.3. Market size and forecast, by Technology
- 8.5.6.1.4. Market size and forecast, by End Use Industry
- 8.5.6.2. Saudi Arabia
- 8.5.6.2.1. Market size and forecast, by Raw Material Type
- 8.5.6.2.2. Market size and forecast, by Polyurea Type
- 8.5.6.2.3. Market size and forecast, by Technology
- 8.5.6.2.4. Market size and forecast, by End Use Industry
- 8.5.6.3. South Africa
- 8.5.6.3.1. Market size and forecast, by Raw Material Type
- 8.5.6.3.2. Market size and forecast, by Polyurea Type
- 8.5.6.3.3. Market size and forecast, by Technology
- 8.5.6.3.4. Market size and forecast, by End Use Industry
- 8.5.6.4. Rest of LAMEA
- 8.5.6.4.1. Market size and forecast, by Raw Material Type
- 8.5.6.4.2. Market size and forecast, by Polyurea Type
- 8.5.6.4.3. Market size and forecast, by Technology
- 8.5.6.4.4. Market size and forecast, by End Use Industry
CHAPTER 9: COMPETITIVE LANDSCAPE
- 9.1. Introduction
- 9.2. Top winning strategies
- 9.3. Product mapping of top 10 player
- 9.4. Competitive dashboard
- 9.5. Competitive heatmap
- 9.6. Top player positioning, 2022
CHAPTER 10: COMPANY PROFILES
- 10.1. BASF SE
- 10.1.1. Company overview
- 10.1.2. Key executives
- 10.1.3. Company snapshot
- 10.1.4. Operating business segments
- 10.1.5. Product portfolio
- 10.1.6. Business performance
- 10.1.7. Key strategic moves and developments
- 10.2. Huntsman International LLC
- 10.2.1. Company overview
- 10.2.2. Key executives
- 10.2.3. Company snapshot
- 10.2.4. Operating business segments
- 10.2.5. Product portfolio
- 10.2.6. Business performance
- 10.2.7. Key strategic moves and developments
- 10.3. Pearl Polyurethane
- 10.3.1. Company overview
- 10.3.2. Key executives
- 10.3.3. Company snapshot
- 10.3.4. Operating business segments
- 10.3.5. Product portfolio
- 10.3.6. Business performance
- 10.3.7. Key strategic moves and developments
- 10.4. Polycoat Products Inc.
- 10.4.1. Company overview
- 10.4.2. Key executives
- 10.4.3. Company snapshot
- 10.4.4. Operating business segments
- 10.4.5. Product portfolio
- 10.4.6. Business performance
- 10.4.7. Key strategic moves and developments
- 10.5. PPG Industries, Inc.
- 10.5.1. Company overview
- 10.5.2. Key executives
- 10.5.3. Company snapshot
- 10.5.4. Operating business segments
- 10.5.5. Product portfolio
- 10.5.6. Business performance
- 10.5.7. Key strategic moves and developments
- 10.6. Sika AG
- 10.6.1. Company overview
- 10.6.2. Key executives
- 10.6.3. Company snapshot
- 10.6.4. Operating business segments
- 10.6.5. Product portfolio
- 10.6.6. Business performance
- 10.6.7. Key strategic moves and developments
- 10.7. SPI Performance Coatings
- 10.7.1. Company overview
- 10.7.2. Key executives
- 10.7.3. Company snapshot
- 10.7.4. Operating business segments
- 10.7.5. Product portfolio
- 10.7.6. Business performance
- 10.7.7. Key strategic moves and developments
- 10.8. SWD urethane Co., Ltd.
- 10.8.1. Company overview
- 10.8.2. Key executives
- 10.8.3. Company snapshot
- 10.8.4. Operating business segments
- 10.8.5. Product portfolio
- 10.8.6. Business performance
- 10.8.7. Key strategic moves and developments
- 10.9. Teknos Group
- 10.9.1. Company overview
- 10.9.2. Key executives
- 10.9.3. Company snapshot
- 10.9.4. Operating business segments
- 10.9.5. Product portfolio
- 10.9.6. Business performance
- 10.9.7. Key strategic moves and developments
- 10.10. The Sherwin-Williams Company
- 10.10.1. Company overview
- 10.10.2. Key executives
- 10.10.3. Company snapshot
- 10.10.4. Operating business segments
- 10.10.5. Product portfolio
- 10.10.6. Business performance
- 10.10.7. Key strategic moves and developments
LIST OF TABLES
- TABLE 01. GLOBAL POLYUREA COATINGS MARKET, BY RAW MATERIAL TYPE, 2022-2032 ($MILLION)
- TABLE 02. GLOBAL POLYUREA COATINGS MARKET, BY RAW MATERIAL TYPE, 2022-2032 (KILOTON)
- TABLE 03. POLYUREA COATINGS MARKET FOR ALIPHATIC ISOCYANATE, BY REGION, 2022-2032 ($MILLION)
- TABLE 04. POLYUREA COATINGS MARKET FOR ALIPHATIC ISOCYANATE, BY REGION, 2022-2032 (KILOTON)
- TABLE 05. POLYUREA COATINGS MARKET FOR AROMATIC ISOCYANATE, BY REGION, 2022-2032 ($MILLION)
- TABLE 06. POLYUREA COATINGS MARKET FOR AROMATIC ISOCYANATE, BY REGION, 2022-2032 (KILOTON)
- TABLE 07. GLOBAL POLYUREA COATINGS MARKET, BY POLYUREA TYPE, 2022-2032 ($MILLION)
- TABLE 08. GLOBAL POLYUREA COATINGS MARKET, BY POLYUREA TYPE, 2022-2032 (KILOTON)
- TABLE 09. POLYUREA COATINGS MARKET FOR PURE POLYUREA COATINGS, BY REGION, 2022-2032 ($MILLION)
- TABLE 10. POLYUREA COATINGS MARKET FOR PURE POLYUREA COATINGS, BY REGION, 2022-2032 (KILOTON)
- TABLE 11. POLYUREA COATINGS MARKET FOR HYBRID POLYUREA COATINGS, BY REGION, 2022-2032 ($MILLION)
- TABLE 12. POLYUREA COATINGS MARKET FOR HYBRID POLYUREA COATINGS, BY REGION, 2022-2032 (KILOTON)
- TABLE 13. GLOBAL POLYUREA COATINGS MARKET, BY TECHNOLOGY, 2022-2032 ($MILLION)
- TABLE 14. GLOBAL POLYUREA COATINGS MARKET, BY TECHNOLOGY, 2022-2032 (KILOTON)
- TABLE 15. POLYUREA COATINGS MARKET FOR SPRAYING, BY REGION, 2022-2032 ($MILLION)
- TABLE 16. POLYUREA COATINGS MARKET FOR SPRAYING, BY REGION, 2022-2032 (KILOTON)
- TABLE 17. POLYUREA COATINGS MARKET FOR POURING, BY REGION, 2022-2032 ($MILLION)
- TABLE 18. POLYUREA COATINGS MARKET FOR POURING, BY REGION, 2022-2032 (KILOTON)
- TABLE 19. POLYUREA COATINGS MARKET FOR HAND MIXING, BY REGION, 2022-2032 ($MILLION)
- TABLE 20. POLYUREA COATINGS MARKET FOR HAND MIXING, BY REGION, 2022-2032 (KILOTON)
- TABLE 21. GLOBAL POLYUREA COATINGS MARKET, BY END USE INDUSTRY, 2022-2032 ($MILLION)
- TABLE 22. GLOBAL POLYUREA COATINGS MARKET, BY END USE INDUSTRY, 2022-2032 (KILOTON)
- TABLE 23. POLYUREA COATINGS MARKET FOR BUILDING AND CONSTRUCTION, BY REGION, 2022-2032 ($MILLION)
- TABLE 24. POLYUREA COATINGS MARKET FOR BUILDING AND CONSTRUCTION, BY REGION, 2022-2032 (KILOTON)
- TABLE 25. POLYUREA COATINGS MARKET FOR TRANSPORTATION, BY REGION, 2022-2032 ($MILLION)
- TABLE 26. POLYUREA COATINGS MARKET FOR TRANSPORTATION, BY REGION, 2022-2032 (KILOTON)
- TABLE 27. POLYUREA COATINGS MARKET FOR INDUSTRIAL, BY REGION, 2022-2032 ($MILLION)
- TABLE 28. POLYUREA COATINGS MARKET FOR INDUSTRIAL, BY REGION, 2022-2032 (KILOTON)
- TABLE 29. POLYUREA COATINGS MARKET FOR OTHERS, BY REGION, 2022-2032 ($MILLION)
- TABLE 30. POLYUREA COATINGS MARKET FOR OTHERS, BY REGION, 2022-2032 (KILOTON)
- TABLE 31. POLYUREA COATINGS MARKET, BY REGION, 2022-2032 ($MILLION)
- TABLE 32. POLYUREA COATINGS MARKET, BY REGION, 2022-2032 (KILOTON)
- TABLE 33. NORTH AMERICA POLYUREA COATINGS MARKET, BY RAW MATERIAL TYPE, 2022-2032 ($MILLION)
- TABLE 34. NORTH AMERICA POLYUREA COATINGS MARKET, BY RAW MATERIAL TYPE, 2022-2032 (KILOTON)
- TABLE 35. NORTH AMERICA POLYUREA COATINGS MARKET, BY POLYUREA TYPE, 2022-2032 ($MILLION)
- TABLE 36. NORTH AMERICA POLYUREA COATINGS MARKET, BY POLYUREA TYPE, 2022-2032 (KILOTON)
- TABLE 37. NORTH AMERICA POLYUREA COATINGS MARKET, BY TECHNOLOGY, 2022-2032 ($MILLION)
- TABLE 38. NORTH AMERICA POLYUREA COATINGS MARKET, BY TECHNOLOGY, 2022-2032 (KILOTON)
- TABLE 39. NORTH AMERICA POLYUREA COATINGS MARKET, BY END USE INDUSTRY, 2022-2032 ($MILLION)
- TABLE 40. NORTH AMERICA POLYUREA COATINGS MARKET, BY END USE INDUSTRY, 2022-2032 (KILOTON)
- TABLE 41. NORTH AMERICA POLYUREA COATINGS MARKET, BY COUNTRY, 2022-2032 ($MILLION)
- TABLE 42. NORTH AMERICA POLYUREA COATINGS MARKET, BY COUNTRY, 2022-2032 (KILOTON)
- TABLE 43. U.S. POLYUREA COATINGS MARKET, BY RAW MATERIAL TYPE, 2022-2032 ($MILLION)
- TABLE 44. U.S. POLYUREA COATINGS MARKET, BY RAW MATERIAL TYPE, 2022-2032 (KILOTON)
- TABLE 45. U.S. POLYUREA COATINGS MARKET, BY POLYUREA TYPE, 2022-2032 ($MILLION)
- TABLE 46. U.S. POLYUREA COATINGS MARKET, BY POLYUREA TYPE, 2022-2032 (KILOTON)
- TABLE 47. U.S. POLYUREA COATINGS MARKET, BY TECHNOLOGY, 2022-2032 ($MILLION)
- TABLE 48. U.S. POLYUREA COATINGS MARKET, BY TECHNOLOGY, 2022-2032 (KILOTON)
- TABLE 49. U.S. POLYUREA COATINGS MARKET, BY END USE INDUSTRY, 2022-2032 ($MILLION)
- TABLE 50. U.S. POLYUREA COATINGS MARKET, BY END USE INDUSTRY, 2022-2032 (KILOTON)
- TABLE 51. CANADA POLYUREA COATINGS MARKET, BY RAW MATERIAL TYPE, 2022-2032 ($MILLION)
- TABLE 52. CANADA POLYUREA COATINGS MARKET, BY RAW MATERIAL TYPE, 2022-2032 (KILOTON)
- TABLE 53. CANADA POLYUREA COATINGS MARKET, BY POLYUREA TYPE, 2022-2032 ($MILLION)
- TABLE 54. CANADA POLYUREA COATINGS MARKET, BY POLYUREA TYPE, 2022-2032 (KILOTON)
- TABLE 55. CANADA POLYUREA COATINGS MARKET, BY TECHNOLOGY, 2022-2032 ($MILLION)
- TABLE 56. CANADA POLYUREA COATINGS MARKET, BY TECHNOLOGY, 2022-2032 (KILOTON)
- TABLE 57. CANADA POLYUREA COATINGS MARKET, BY END USE INDUSTRY, 2022-2032 ($MILLION)
- TABLE 58. CANADA POLYUREA COATINGS MARKET, BY END USE INDUSTRY, 2022-2032 (KILOTON)
- TABLE 59. MEXICO POLYUREA COATINGS MARKET, BY RAW MATERIAL TYPE, 2022-2032 ($MILLION)
- TABLE 60. MEXICO POLYUREA COATINGS MARKET, BY RAW MATERIAL TYPE, 2022-2032 (KILOTON)
- TABLE 61. MEXICO POLYUREA COATINGS MARKET, BY POLYUREA TYPE, 2022-2032 ($MILLION)
- TABLE 62. MEXICO POLYUREA COATINGS MARKET, BY POLYUREA TYPE, 2022-2032 (KILOTON)
- TABLE 63. MEXICO POLYUREA COATINGS MARKET, BY TECHNOLOGY, 2022-2032 ($MILLION)
- TABLE 64. MEXICO POLYUREA COATINGS MARKET, BY TECHNOLOGY, 2022-2032 (KILOTON)
- TABLE 65. MEXICO POLYUREA COATINGS MARKET, BY END USE INDUSTRY, 2022-2032 ($MILLION)
- TABLE 66. MEXICO POLYUREA COATINGS MARKET, BY END USE INDUSTRY, 2022-2032 (KILOTON)
- TABLE 67. EUROPE POLYUREA COATINGS MARKET, BY RAW MATERIAL TYPE, 2022-2032 ($MILLION)
- TABLE 68. EUROPE POLYUREA COATINGS MARKET, BY RAW MATERIAL TYPE, 2022-2032 (KILOTON)
- TABLE 69. EUROPE POLYUREA COATINGS MARKET, BY POLYUREA TYPE, 2022-2032 ($MILLION)
- TABLE 70. EUROPE POLYUREA COATINGS MARKET, BY POLYUREA TYPE, 2022-2032 (KILOTON)
- TABLE 71. EUROPE POLYUREA COATINGS MARKET, BY TECHNOLOGY, 2022-2032 ($MILLION)
- TABLE 72. EUROPE POLYUREA COATINGS MARKET, BY TECHNOLOGY, 2022-2032 (KILOTON)
- TABLE 73. EUROPE POLYUREA COATINGS MARKET, BY END USE INDUSTRY, 2022-2032 ($MILLION)
- TABLE 74. EUROPE POLYUREA COATINGS MARKET, BY END USE INDUSTRY, 2022-2032 (KILOTON)
- TABLE 75. EUROPE POLYUREA COATINGS MARKET, BY COUNTRY, 2022-2032 ($MILLION)
- TABLE 76. EUROPE POLYUREA COATINGS MARKET, BY COUNTRY, 2022-2032 (KILOTON)
- TABLE 77. GERMANY POLYUREA COATINGS MARKET, BY RAW MATERIAL TYPE, 2022-2032 ($MILLION)
- TABLE 78. GERMANY POLYUREA COATINGS MARKET, BY RAW MATERIAL TYPE, 2022-2032 (KILOTON)
- TABLE 79. GERMANY POLYUREA COATINGS MARKET, BY POLYUREA TYPE, 2022-2032 ($MILLION)
- TABLE 80. GERMANY POLYUREA COATINGS MARKET, BY POLYUREA TYPE, 2022-2032 (KILOTON)
- TABLE 81. GERMANY POLYUREA COATINGS MARKET, BY TECHNOLOGY, 2022-2032 ($MILLION)
- TABLE 82. GERMANY POLYUREA COATINGS MARKET, BY TECHNOLOGY, 2022-2032 (KILOTON)
- TABLE 83. GERMANY POLYUREA COATINGS MARKET, BY END USE INDUSTRY, 2022-2032 ($MILLION)
- TABLE 84. GERMANY POLYUREA COATINGS MARKET, BY END USE INDUSTRY, 2022-2032 (KILOTON)
- TABLE 85. UK POLYUREA COATINGS MARKET, BY RAW MATERIAL TYPE, 2022-2032 ($MILLION)
- TABLE 86. UK POLYUREA COATINGS MARKET, BY RAW MATERIAL TYPE, 2022-2032 (KILOTON)
- TABLE 87. UK POLYUREA COATINGS MARKET, BY POLYUREA TYPE, 2022-2032 ($MILLION)
- TABLE 88. UK POLYUREA COATINGS MARKET, BY POLYUREA TYPE, 2022-2032 (KILOTON)
- TABLE 89. UK POLYUREA COATINGS MARKET, BY TECHNOLOGY, 2022-2032 ($MILLION)
- TABLE 90. UK POLYUREA COATINGS MARKET, BY TECHNOLOGY, 2022-2032 (KILOTON)
- TABLE 91. UK POLYUREA COATINGS MARKET, BY END USE INDUSTRY, 2022-2032 ($MILLION)
- TABLE 92. UK POLYUREA COATINGS MARKET, BY END USE INDUSTRY, 2022-2032 (KILOTON)
- TABLE 93. FRANCE POLYUREA COATINGS MARKET, BY RAW MATERIAL TYPE, 2022-2032 ($MILLION)
- TABLE 94. FRANCE POLYUREA COATINGS MARKET, BY RAW MATERIAL TYPE, 2022-2032 (KILOTON)
- TABLE 95. FRANCE POLYUREA COATINGS MARKET, BY POLYUREA TYPE, 2022-2032 ($MILLION)
- TABLE 96. FRANCE POLYUREA COATINGS MARKET, BY POLYUREA TYPE, 2022-2032 (KILOTON)
- TABLE 97. FRANCE POLYUREA COATINGS MARKET, BY TECHNOLOGY, 2022-2032 ($MILLION)
- TABLE 98. FRANCE POLYUREA COATINGS MARKET, BY TECHNOLOGY, 2022-2032 (KILOTON)
- TABLE 99. FRANCE POLYUREA COATINGS MARKET, BY END USE INDUSTRY, 2022-2032 ($MILLION)
- TABLE 100. FRANCE POLYUREA COATINGS MARKET, BY END USE INDUSTRY, 2022-2032 (KILOTON)
- TABLE 101. SPAIN POLYUREA COATINGS MARKET, BY RAW MATERIAL TYPE, 2022-2032 ($MILLION)
- TABLE 102. SPAIN POLYUREA COATINGS MARKET, BY RAW MATERIAL TYPE, 2022-2032 (KILOTON)
- TABLE 103. SPAIN POLYUREA COATINGS MARKET, BY POLYUREA TYPE, 2022-2032 ($MILLION)
- TABLE 104. SPAIN POLYUREA COATINGS MARKET, BY POLYUREA TYPE, 2022-2032 (KILOTON)
- TABLE 105. SPAIN POLYUREA COATINGS MARKET, BY TECHNOLOGY, 2022-2032 ($MILLION)
- TABLE 106. SPAIN POLYUREA COATINGS MARKET, BY TECHNOLOGY, 2022-2032 (KILOTON)
- TABLE 107. SPAIN POLYUREA COATINGS MARKET, BY END USE INDUSTRY, 2022-2032 ($MILLION)
- TABLE 108. SPAIN POLYUREA COATINGS MARKET, BY END USE INDUSTRY, 2022-2032 (KILOTON)
- TABLE 109. ITALY POLYUREA COATINGS MARKET, BY RAW MATERIAL TYPE, 2022-2032 ($MILLION)
- TABLE 110. ITALY POLYUREA COATINGS MARKET, BY RAW MATERIAL TYPE, 2022-2032 (KILOTON)
- TABLE 111. ITALY POLYUREA COATINGS MARKET, BY POLYUREA TYPE, 2022-2032 ($MILLION)
- TABLE 112. ITALY POLYUREA COATINGS MARKET, BY POLYUREA TYPE, 2022-2032 (KILOTON)
- TABLE 113. ITALY POLYUREA COATINGS MARKET, BY TECHNOLOGY, 2022-2032 ($MILLION)
- TABLE 114. ITALY POLYUREA COATINGS MARKET, BY TECHNOLOGY, 2022-2032 (KILOTON)
- TABLE 115. ITALY POLYUREA COATINGS MARKET, BY END USE INDUSTRY, 2022-2032 ($MILLION)
- TABLE 116. ITALY POLYUREA COATINGS MARKET, BY END USE INDUSTRY, 2022-2032 (KILOTON)
- TABLE 117. REST OF EUROPE POLYUREA COATINGS MARKET, BY RAW MATERIAL TYPE, 2022-2032 ($MILLION)
- TABLE 118. REST OF EUROPE POLYUREA COATINGS MARKET, BY RAW MATERIAL TYPE, 2022-2032 (KILOTON)
- TABLE 119. REST OF EUROPE POLYUREA COATINGS MARKET, BY POLYUREA TYPE, 2022-2032 ($MILLION)
- TABLE 120. REST OF EUROPE POLYUREA COATINGS MARKET, BY POLYUREA TYPE, 2022-2032 (KILOTON)
- TABLE 121. REST OF EUROPE POLYUREA COATINGS MARKET, BY TECHNOLOGY, 2022-2032 ($MILLION)
- TABLE 122. REST OF EUROPE POLYUREA COATINGS MARKET, BY TECHNOLOGY, 2022-2032 (KILOTON)
- TABLE 123. REST OF EUROPE POLYUREA COATINGS MARKET, BY END USE INDUSTRY, 2022-2032 ($MILLION)
- TABLE 124. REST OF EUROPE POLYUREA COATINGS MARKET, BY END USE INDUSTRY, 2022-2032 (KILOTON)
- TABLE 125. ASIA-PACIFIC POLYUREA COATINGS MARKET, BY RAW MATERIAL TYPE, 2022-2032 ($MILLION)
- TABLE 126. ASIA-PACIFIC POLYUREA COATINGS MARKET, BY RAW MATERIAL TYPE, 2022-2032 (KILOTON)
- TABLE 127. ASIA-PACIFIC POLYUREA COATINGS MARKET, BY POLYUREA TYPE, 2022-2032 ($MILLION)
- TABLE 128. ASIA-PACIFIC POLYUREA COATINGS MARKET, BY POLYUREA TYPE, 2022-2032 (KILOTON)
- TABLE 129. ASIA-PACIFIC POLYUREA COATINGS MARKET, BY TECHNOLOGY, 2022-2032 ($MILLION)
- TABLE 130. ASIA-PACIFIC POLYUREA COATINGS MARKET, BY TECHNOLOGY, 2022-2032 (KILOTON)
- TABLE 131. ASIA-PACIFIC POLYUREA COATINGS MARKET, BY END USE INDUSTRY, 2022-2032 ($MILLION)
- TABLE 132. ASIA-PACIFIC POLYUREA COATINGS MARKET, BY END USE INDUSTRY, 2022-2032 (KILOTON)
- TABLE 133. ASIA-PACIFIC POLYUREA COATINGS MARKET, BY COUNTRY, 2022-2032 ($MILLION)
- TABLE 134. ASIA-PACIFIC POLYUREA COATINGS MARKET, BY COUNTRY, 2022-2032 (KILOTON)
- TABLE 135. CHINA POLYUREA COATINGS MARKET, BY RAW MATERIAL TYPE, 2022-2032 ($MILLION)
- TABLE 136. CHINA POLYUREA COATINGS MARKET, BY RAW MATERIAL TYPE, 2022-2032 (KILOTON)
- TABLE 137. CHINA POLYUREA COATINGS MARKET, BY POLYUREA TYPE, 2022-2032 ($MILLION)
- TABLE 138. CHINA POLYUREA COATINGS MARKET, BY POLYUREA TYPE, 2022-2032 (KILOTON)
- TABLE 139. CHINA POLYUREA COATINGS MARKET, BY TECHNOLOGY, 2022-2032 ($MILLION)
- TABLE 140. CHINA POLYUREA COATINGS MARKET, BY TECHNOLOGY, 2022-2032 (KILOTON)
- TABLE 141. CHINA POLYUREA COATINGS MARKET, BY END USE INDUSTRY, 2022-2032 ($MILLION)
- TABLE 142. CHINA POLYUREA COATINGS MARKET, BY END USE INDUSTRY, 2022-2032 (KILOTON)
- TABLE 143. INDIA POLYUREA COATINGS MARKET, BY RAW MATERIAL TYPE, 2022-2032 ($MILLION)
- TABLE 144. INDIA POLYUREA COATINGS MARKET, BY RAW MATERIAL TYPE, 2022-2032 (KILOTON)
- TABLE 145. INDIA POLYUREA COATINGS MARKET, BY POLYUREA TYPE, 2022-2032 ($MILLION)
- TABLE 146. INDIA POLYUREA COATINGS MARKET, BY POLYUREA TYPE, 2022-2032 (KILOTON)
- TABLE 147. INDIA POLYUREA COATINGS MARKET, BY TECHNOLOGY, 2022-2032 ($MILLION)
- TABLE 148. INDIA POLYUREA COATINGS MARKET, BY TECHNOLOGY, 2022-2032 (KILOTON)
- TABLE 149. INDIA POLYUREA COATINGS MARKET, BY END USE INDUSTRY, 2022-2032 ($MILLION)
- TABLE 150. INDIA POLYUREA COATINGS MARKET, BY END USE INDUSTRY, 2022-2032 (KILOTON)
- TABLE 151. JAPAN POLYUREA COATINGS MARKET, BY RAW MATERIAL TYPE, 2022-2032 ($MILLION)
- TABLE 152. JAPAN POLYUREA COATINGS MARKET, BY RAW MATERIAL TYPE, 2022-2032 (KILOTON)
- TABLE 153. JAPAN POLYUREA COATINGS MARKET, BY POLYUREA TYPE, 2022-2032 ($MILLION)
- TABLE 154. JAPAN POLYUREA COATINGS MARKET, BY POLYUREA TYPE, 2022-2032 (KILOTON)
- TABLE 155. JAPAN POLYUREA COATINGS MARKET, BY TECHNOLOGY, 2022-2032 ($MILLION)
- TABLE 156. JAPAN POLYUREA COATINGS MARKET, BY TECHNOLOGY, 2022-2032 (KILOTON)
- TABLE 157. JAPAN POLYUREA COATINGS MARKET, BY END USE INDUSTRY, 2022-2032 ($MILLION)
- TABLE 158. JAPAN POLYUREA COATINGS MARKET, BY END USE INDUSTRY, 2022-2032 (KILOTON)
- TABLE 159. SOUTH KOREA POLYUREA COATINGS MARKET, BY RAW MATERIAL TYPE, 2022-2032 ($MILLION)
- TABLE 160. SOUTH KOREA POLYUREA COATINGS MARKET, BY RAW MATERIAL TYPE, 2022-2032 (KILOTON)
- TABLE 161. SOUTH KOREA POLYUREA COATINGS MARKET, BY POLYUREA TYPE, 2022-2032 ($MILLION)
- TABLE 162. SOUTH KOREA POLYUREA COATINGS MARKET, BY POLYUREA TYPE, 2022-2032 (KILOTON)
- TABLE 163. SOUTH KOREA POLYUREA COATINGS MARKET, BY TECHNOLOGY, 2022-2032 ($MILLION)
- TABLE 164. SOUTH KOREA POLYUREA COATINGS MARKET, BY TECHNOLOGY, 2022-2032 (KILOTON)
- TABLE 165. SOUTH KOREA POLYUREA COATINGS MARKET, BY END USE INDUSTRY, 2022-2032 ($MILLION)
- TABLE 166. SOUTH KOREA POLYUREA COATINGS MARKET, BY END USE INDUSTRY, 2022-2032 (KILOTON)
- TABLE 167. AUSTRALIA POLYUREA COATINGS MARKET, BY RAW MATERIAL TYPE, 2022-2032 ($MILLION)
- TABLE 168. AUSTRALIA POLYUREA COATINGS MARKET, BY RAW MATERIAL TYPE, 2022-2032 (KILOTON)
- TABLE 169. AUSTRALIA POLYUREA COATINGS MARKET, BY POLYUREA TYPE, 2022-2032 ($MILLION)
- TABLE 170. AUSTRALIA POLYUREA COATINGS MARKET, BY POLYUREA TYPE, 2022-2032 (KILOTON)
- TABLE 171. AUSTRALIA POLYUREA COATINGS MARKET, BY TECHNOLOGY, 2022-2032 ($MILLION)
- TABLE 172. AUSTRALIA POLYUREA COATINGS MARKET, BY TECHNOLOGY, 2022-2032 (KILOTON)
- TABLE 173. AUSTRALIA POLYUREA COATINGS MARKET, BY END USE INDUSTRY, 2022-2032 ($MILLION)
- TABLE 174. AUSTRALIA POLYUREA COATINGS MARKET, BY END USE INDUSTRY, 2022-2032 (KILOTON)
- TABLE 175. REST OF ASIA-PACIFIC POLYUREA COATINGS MARKET, BY RAW MATERIAL TYPE, 2022-2032 ($MILLION)
- TABLE 176. REST OF ASIA-PACIFIC POLYUREA COATINGS MARKET, BY RAW MATERIAL TYPE, 2022-2032 (KILOTON)
- TABLE 177. REST OF ASIA-PACIFIC POLYUREA COATINGS MARKET, BY POLYUREA TYPE, 2022-2032 ($MILLION)
- TABLE 178. REST OF ASIA-PACIFIC POLYUREA COATINGS MARKET, BY POLYUREA TYPE, 2022-2032 (KILOTON)
- TABLE 179. REST OF ASIA-PACIFIC POLYUREA COATINGS MARKET, BY TECHNOLOGY, 2022-2032 ($MILLION)
- TABLE 180. REST OF ASIA-PACIFIC POLYUREA COATINGS MARKET, BY TECHNOLOGY, 2022-2032 (KILOTON)
- TABLE 181. REST OF ASIA-PACIFIC POLYUREA COATINGS MARKET, BY END USE INDUSTRY, 2022-2032 ($MILLION)
- TABLE 182. REST OF ASIA-PACIFIC POLYUREA COATINGS MARKET, BY END USE INDUSTRY, 2022-2032 (KILOTON)
- TABLE 183. LAMEA POLYUREA COATINGS MARKET, BY RAW MATERIAL TYPE, 2022-2032 ($MILLION)
- TABLE 184. LAMEA POLYUREA COATINGS MARKET, BY RAW MATERIAL TYPE, 2022-2032 (KILOTON)
- TABLE 185. LAMEA POLYUREA COATINGS MARKET, BY POLYUREA TYPE, 2022-2032 ($MILLION)
- TABLE 186. LAMEA POLYUREA COATINGS MARKET, BY POLYUREA TYPE, 2022-2032 (KILOTON)
- TABLE 187. LAMEA POLYUREA COATINGS MARKET, BY TECHNOLOGY, 2022-2032 ($MILLION)
- TABLE 188. LAMEA POLYUREA COATINGS MARKET, BY TECHNOLOGY, 2022-2032 (KILOTON)
- TABLE 189. LAMEA POLYUREA COATINGS MARKET, BY END USE INDUSTRY, 2022-2032 ($MILLION)
- TABLE 190. LAMEA POLYUREA COATINGS MARKET, BY END USE INDUSTRY, 2022-2032 (KILOTON)
- TABLE 191. LAMEA POLYUREA COATINGS MARKET, BY COUNTRY, 2022-2032 ($MILLION)
- TABLE 192. LAMEA POLYUREA COATINGS MARKET, BY COUNTRY, 2022-2032 (KILOTON)
- TABLE 193. BRAZIL POLYUREA COATINGS MARKET, BY RAW MATERIAL TYPE, 2022-2032 ($MILLION)
- TABLE 194. BRAZIL POLYUREA COATINGS MARKET, BY RAW MATERIAL TYPE, 2022-2032 (KILOTON)
- TABLE 195. BRAZIL POLYUREA COATINGS MARKET, BY POLYUREA TYPE, 2022-2032 ($MILLION)
- TABLE 196. BRAZIL POLYUREA COATINGS MARKET, BY POLYUREA TYPE, 2022-2032 (KILOTON)
- TABLE 197. BRAZIL POLYUREA COATINGS MARKET, BY TECHNOLOGY, 2022-2032 ($MILLION)
- TABLE 198. BRAZIL POLYUREA COATINGS MARKET, BY TECHNOLOGY, 2022-2032 (KILOTON)
- TABLE 199. BRAZIL POLYUREA COATINGS MARKET, BY END USE INDUSTRY, 2022-2032 ($MILLION)
- TABLE 200. BRAZIL POLYUREA COATINGS MARKET, BY END USE INDUSTRY, 2022-2032 (KILOTON)
- TABLE 201. SAUDI ARABIA POLYUREA COATINGS MARKET, BY RAW MATERIAL TYPE, 2022-2032 ($MILLION)
- TABLE 202. SAUDI ARABIA POLYUREA COATINGS MARKET, BY RAW MATERIAL TYPE, 2022-2032 (KILOTON)
- TABLE 203. SAUDI ARABIA POLYUREA COATINGS MARKET, BY POLYUREA TYPE, 2022-2032 ($MILLION)
- TABLE 204. SAUDI ARABIA POLYUREA COATINGS MARKET, BY POLYUREA TYPE, 2022-2032 (KILOTON)
- TABLE 205. SAUDI ARABIA POLYUREA COATINGS MARKET, BY TECHNOLOGY, 2022-2032 ($MILLION)
- TABLE 206. SAUDI ARABIA POLYUREA COATINGS MARKET, BY TECHNOLOGY, 2022-2032 (KILOTON)
- TABLE 207. SAUDI ARABIA POLYUREA COATINGS MARKET, BY END USE INDUSTRY, 2022-2032 ($MILLION)
- TABLE 208. SAUDI ARABIA POLYUREA COATINGS MARKET, BY END USE INDUSTRY, 2022-2032 (KILOTON)
- TABLE 209. SOUTH AFRICA POLYUREA COATINGS MARKET, BY RAW MATERIAL TYPE, 2022-2032 ($MILLION)
- TABLE 210. SOUTH AFRICA POLYUREA COATINGS MARKET, BY RAW MATERIAL TYPE, 2022-2032 (KILOTON)
- TABLE 211. SOUTH AFRICA POLYUREA COATINGS MARKET, BY POLYUREA TYPE, 2022-2032 ($MILLION)
- TABLE 212. SOUTH AFRICA POLYUREA COATINGS MARKET, BY POLYUREA TYPE, 2022-2032 (KILOTON)
- TABLE 213. SOUTH AFRICA POLYUREA COATINGS MARKET, BY TECHNOLOGY, 2022-2032 ($MILLION)
- TABLE 214. SOUTH AFRICA POLYUREA COATINGS MARKET, BY TECHNOLOGY, 2022-2032 (KILOTON)
- TABLE 215. SOUTH AFRICA POLYUREA COATINGS MARKET, BY END USE INDUSTRY, 2022-2032 ($MILLION)
- TABLE 216. SOUTH AFRICA POLYUREA COATINGS MARKET, BY END USE INDUSTRY, 2022-2032 (KILOTON)
- TABLE 217. REST OF LAMEA POLYUREA COATINGS MARKET, BY RAW MATERIAL TYPE, 2022-2032 ($MILLION)
- TABLE 218. REST OF LAMEA POLYUREA COATINGS MARKET, BY RAW MATERIAL TYPE, 2022-2032 (KILOTON)
- TABLE 219. REST OF LAMEA POLYUREA COATINGS MARKET, BY POLYUREA TYPE, 2022-2032 ($MILLION)
- TABLE 220. REST OF LAMEA POLYUREA COATINGS MARKET, BY POLYUREA TYPE, 2022-2032 (KILOTON)
- TABLE 221. REST OF LAMEA POLYUREA COATINGS MARKET, BY TECHNOLOGY, 2022-2032 ($MILLION)
- TABLE 222. REST OF LAMEA POLYUREA COATINGS MARKET, BY TECHNOLOGY, 2022-2032 (KILOTON)
- TABLE 223. REST OF LAMEA POLYUREA COATINGS MARKET, BY END USE INDUSTRY, 2022-2032 ($MILLION)
- TABLE 224. REST OF LAMEA POLYUREA COATINGS MARKET, BY END USE INDUSTRY, 2022-2032 (KILOTON)
- TABLE 225. BASF SE: KEY EXECUTIVES
- TABLE 226. BASF SE: COMPANY SNAPSHOT
- TABLE 227. BASF SE: PRODUCT SEGMENTS
- TABLE 228. BASF SE: SERVICE SEGMENTS
- TABLE 229. BASF SE: PRODUCT PORTFOLIO
- TABLE 230. BASF SE: KEY STRATERGIES
- TABLE 231. HUNTSMAN INTERNATIONAL LLC: KEY EXECUTIVES
- TABLE 232. HUNTSMAN INTERNATIONAL LLC: COMPANY SNAPSHOT
- TABLE 233. HUNTSMAN INTERNATIONAL LLC: PRODUCT SEGMENTS
- TABLE 234. HUNTSMAN INTERNATIONAL LLC: SERVICE SEGMENTS
- TABLE 235. HUNTSMAN INTERNATIONAL LLC: PRODUCT PORTFOLIO
- TABLE 236. HUNTSMAN INTERNATIONAL LLC: KEY STRATERGIES
- TABLE 237. PEARL POLYURETHANE: KEY EXECUTIVES
- TABLE 238. PEARL POLYURETHANE: COMPANY SNAPSHOT
- TABLE 239. PEARL POLYURETHANE: PRODUCT SEGMENTS
- TABLE 240. PEARL POLYURETHANE: SERVICE SEGMENTS
- TABLE 241. PEARL POLYURETHANE: PRODUCT PORTFOLIO
- TABLE 242. PEARL POLYURETHANE: KEY STRATERGIES
- TABLE 243. POLYCOAT PRODUCTS INC.: KEY EXECUTIVES
- TABLE 244. POLYCOAT PRODUCTS INC.: COMPANY SNAPSHOT
- TABLE 245. POLYCOAT PRODUCTS INC.: PRODUCT SEGMENTS
- TABLE 246. POLYCOAT PRODUCTS INC.: SERVICE SEGMENTS
- TABLE 247. POLYCOAT PRODUCTS INC.: PRODUCT PORTFOLIO
- TABLE 248. POLYCOAT PRODUCTS INC.: KEY STRATERGIES
- TABLE 249. PPG INDUSTRIES, INC.: KEY EXECUTIVES
- TABLE 250. PPG INDUSTRIES, INC.: COMPANY SNAPSHOT
- TABLE 251. PPG INDUSTRIES, INC.: PRODUCT SEGMENTS
- TABLE 252. PPG INDUSTRIES, INC.: SERVICE SEGMENTS
- TABLE 253. PPG INDUSTRIES, INC.: PRODUCT PORTFOLIO
- TABLE 254. PPG INDUSTRIES, INC.: KEY STRATERGIES
- TABLE 255. SIKA AG: KEY EXECUTIVES
- TABLE 256. SIKA AG: COMPANY SNAPSHOT
- TABLE 257. SIKA AG: PRODUCT SEGMENTS
- TABLE 258. SIKA AG: SERVICE SEGMENTS
- TABLE 259. SIKA AG: PRODUCT PORTFOLIO
- TABLE 260. SIKA AG: KEY STRATERGIES
- TABLE 261. SPI PERFORMANCE COATINGS: KEY EXECUTIVES
- TABLE 262. SPI PERFORMANCE COATINGS: COMPANY SNAPSHOT
- TABLE 263. SPI PERFORMANCE COATINGS: PRODUCT SEGMENTS
- TABLE 264. SPI PERFORMANCE COATINGS: SERVICE SEGMENTS
- TABLE 265. SPI PERFORMANCE COATINGS: PRODUCT PORTFOLIO
- TABLE 266. SPI PERFORMANCE COATINGS: KEY STRATERGIES
- TABLE 267. SWD URETHANE CO., LTD.: KEY EXECUTIVES
- TABLE 268. SWD URETHANE CO., LTD.: COMPANY SNAPSHOT
- TABLE 269. SWD URETHANE CO., LTD.: PRODUCT SEGMENTS
- TABLE 270. SWD URETHANE CO., LTD.: SERVICE SEGMENTS
- TABLE 271. SWD URETHANE CO., LTD.: PRODUCT PORTFOLIO
- TABLE 272. SWD URETHANE CO., LTD.: KEY STRATERGIES
- TABLE 273. TEKNOS GROUP: KEY EXECUTIVES
- TABLE 274. TEKNOS GROUP: COMPANY SNAPSHOT
- TABLE 275. TEKNOS GROUP: PRODUCT SEGMENTS
- TABLE 276. TEKNOS GROUP: SERVICE SEGMENTS
- TABLE 277. TEKNOS GROUP: PRODUCT PORTFOLIO
- TABLE 278. TEKNOS GROUP: KEY STRATERGIES
- TABLE 279. THE SHERWIN-WILLIAMS COMPANY: KEY EXECUTIVES
- TABLE 280. THE SHERWIN-WILLIAMS COMPANY: COMPANY SNAPSHOT
- TABLE 281. THE SHERWIN-WILLIAMS COMPANY: PRODUCT SEGMENTS
- TABLE 282. THE SHERWIN-WILLIAMS COMPANY: SERVICE SEGMENTS
- TABLE 283. THE SHERWIN-WILLIAMS COMPANY: PRODUCT PORTFOLIO
- TABLE 284. THE SHERWIN-WILLIAMS COMPANY: KEY STRATERGIES
LIST OF FIGURES
- FIGURE 01. POLYUREA COATINGS MARKET, 2022-2032
- FIGURE 02. SEGMENTATION OF POLYUREA COATINGS MARKET,2022-2032
- FIGURE 03. TOP IMPACTING FACTORS IN POLYUREA COATINGS MARKET
- FIGURE 04. TOP INVESTMENT POCKETS IN POLYUREA COATINGS MARKET (2023-2032)
- FIGURE 05. BARGAINING POWER OF SUPPLIERS
- FIGURE 06. BARGAINING POWER OF BUYERS
- FIGURE 07. THREAT OF SUBSTITUTION
- FIGURE 08. THREAT OF SUBSTITUTION
- FIGURE 09. COMPETITIVE RIVALRY
- FIGURE 10. GLOBAL POLYUREA COATINGS MARKET:DRIVERS, RESTRAINTS AND OPPORTUNITIES
- FIGURE 11. PRICING ANALYSIS: POLYUREA COATINGS MARKET 2022 AND 2032
- FIGURE 12. IMPACT OF KEY REGULATION: POLYUREA COATINGS MARKET
- FIGURE 13. PATENT ANALYSIS BY COMPANY
- FIGURE 14. PATENT ANALYSIS BY COUNTRY
- FIGURE 15. REGULATORY GUIDELINES: POLYUREA COATINGS MARKET
- FIGURE 16. POLYUREA COATINGS MARKET, BY RAW MATERIAL TYPE, 2022 AND 2032(%)
- FIGURE 17. COMPARATIVE SHARE ANALYSIS OF POLYUREA COATINGS MARKET FOR ALIPHATIC ISOCYANATE, BY COUNTRY 2022 AND 2032(%)
- FIGURE 18. COMPARATIVE SHARE ANALYSIS OF POLYUREA COATINGS MARKET FOR AROMATIC ISOCYANATE, BY COUNTRY 2022 AND 2032(%)
- FIGURE 19. POLYUREA COATINGS MARKET, BY POLYUREA TYPE, 2022 AND 2032(%)
- FIGURE 20. COMPARATIVE SHARE ANALYSIS OF POLYUREA COATINGS MARKET FOR PURE POLYUREA COATINGS, BY COUNTRY 2022 AND 2032(%)
- FIGURE 21. COMPARATIVE SHARE ANALYSIS OF POLYUREA COATINGS MARKET FOR HYBRID POLYUREA COATINGS, BY COUNTRY 2022 AND 2032(%)
- FIGURE 22. POLYUREA COATINGS MARKET, BY TECHNOLOGY, 2022 AND 2032(%)
- FIGURE 23. COMPARATIVE SHARE ANALYSIS OF POLYUREA COATINGS MARKET FOR SPRAYING, BY COUNTRY 2022 AND 2032(%)
- FIGURE 24. COMPARATIVE SHARE ANALYSIS OF POLYUREA COATINGS MARKET FOR POURING, BY COUNTRY 2022 AND 2032(%)
- FIGURE 25. COMPARATIVE SHARE ANALYSIS OF POLYUREA COATINGS MARKET FOR HAND MIXING, BY COUNTRY 2022 AND 2032(%)
- FIGURE 26. POLYUREA COATINGS MARKET, BY END USE INDUSTRY, 2022 AND 2032(%)
- FIGURE 27. COMPARATIVE SHARE ANALYSIS OF POLYUREA COATINGS MARKET FOR BUILDING AND CONSTRUCTION, BY COUNTRY 2022 AND 2032(%)
- FIGURE 28. COMPARATIVE SHARE ANALYSIS OF POLYUREA COATINGS MARKET FOR TRANSPORTATION, BY COUNTRY 2022 AND 2032(%)
- FIGURE 29. COMPARATIVE SHARE ANALYSIS OF POLYUREA COATINGS MARKET FOR INDUSTRIAL, BY COUNTRY 2022 AND 2032(%)
- FIGURE 30. COMPARATIVE SHARE ANALYSIS OF POLYUREA COATINGS MARKET FOR OTHERS, BY COUNTRY 2022 AND 2032(%)
- FIGURE 31. POLYUREA COATINGS MARKET BY REGION, 2022 AND 2032(%)
- FIGURE 32. U.S. POLYUREA COATINGS MARKET, 2022-2032 ($MILLION)
- FIGURE 33. CANADA POLYUREA COATINGS MARKET, 2022-2032 ($MILLION)
- FIGURE 34. MEXICO POLYUREA COATINGS MARKET, 2022-2032 ($MILLION)
- FIGURE 35. GERMANY POLYUREA COATINGS MARKET, 2022-2032 ($MILLION)
- FIGURE 36. UK POLYUREA COATINGS MARKET, 2022-2032 ($MILLION)
- FIGURE 37. FRANCE POLYUREA COATINGS MARKET, 2022-2032 ($MILLION)
- FIGURE 38. SPAIN POLYUREA COATINGS MARKET, 2022-2032 ($MILLION)
- FIGURE 39. ITALY POLYUREA COATINGS MARKET, 2022-2032 ($MILLION)
- FIGURE 40. REST OF EUROPE POLYUREA COATINGS MARKET, 2022-2032 ($MILLION)
- FIGURE 41. CHINA POLYUREA COATINGS MARKET, 2022-2032 ($MILLION)
- FIGURE 42. INDIA POLYUREA COATINGS MARKET, 2022-2032 ($MILLION)
- FIGURE 43. JAPAN POLYUREA COATINGS MARKET, 2022-2032 ($MILLION)
- FIGURE 44. SOUTH KOREA POLYUREA COATINGS MARKET, 2022-2032 ($MILLION)
- FIGURE 45. AUSTRALIA POLYUREA COATINGS MARKET, 2022-2032 ($MILLION)
- FIGURE 46. REST OF ASIA-PACIFIC POLYUREA COATINGS MARKET, 2022-2032 ($MILLION)
- FIGURE 47. BRAZIL POLYUREA COATINGS MARKET, 2022-2032 ($MILLION)
- FIGURE 48. SAUDI ARABIA POLYUREA COATINGS MARKET, 2022-2032 ($MILLION)
- FIGURE 49. SOUTH AFRICA POLYUREA COATINGS MARKET, 2022-2032 ($MILLION)
- FIGURE 50. REST OF LAMEA POLYUREA COATINGS MARKET, 2022-2032 ($MILLION)
- FIGURE 51. TOP WINNING STRATEGIES, BY YEAR
- FIGURE 52. TOP WINNING STRATEGIES, BY DEVELOPMENT
- FIGURE 53. TOP WINNING STRATEGIES, BY COMPANY
- FIGURE 54. PRODUCT MAPPING OF TOP 10 PLAYERS
- FIGURE 55. COMPETITIVE DASHBOARD
- FIGURE 56. COMPETITIVE HEATMAP: POLYUREA COATINGS MARKET
- FIGURE 57. TOP PLAYER POSITIONING, 2022
 聚脲塗料全球市場規模、佔有率和趨勢分析報告:按最終用戶、按聚脲類型、按原料、按技術、按地區、展望和預測,2023-2030年
 2024年聚脲塗料全球市場報告
 2030 年聚脲塗料市場預測:按聚脲類型、技術、最終用戶和地區分類的全球分析
 聚脲塗料的全球市場機會與2032年策略
 聚脲塗料市場:2023-2028年全球產業趨勢、佔有率、規模、成長、機會與預測
 聚脲塗料市場(類型:純和混合;技術:噴塗、澆注和手動混合)- 2023-2031 年全球行業分析、規模、佔有率、成長、趨勢和預測
 聚脲塗料市場:按原料、聚脲類型、技術和最終用途行業分類 - COVID-19、俄羅斯-烏克蘭衝突和高累積的累積影響 - 2023-2030 年全球預測
![聚[月尿]塗料的全球市場](/sample/img/cover/42/1265803.png) 聚[月尿]塗料的全球市場
聚[月尿]塗料的全球市場 到 2028 年的聚尿塗料市場預測—COVID-19 的影響以及按原材料、類型、技術和應用進行的全球分析
 聚脲塗料的全球市場:佔有率,規模,趨勢,產業分析報告,各原料(脂肪族,芳香族),各聚脲類型(純聚脲,混合聚脲),各技術,各終端用戶,各地區,市場區隔預測(2022年~2030年)